. 2022 Apr 15:312:198711.
doi: 10.1016/j.virusres.2022.198711. Epub 2022 Feb 14.

Systematic profiling of antigen bias in humoral response against SARS-CoV-2

Affiliations

Systematic profiling of antigen bias in humoral response against SARS-CoV-2

Nana Wei et al. Virus Res. .

Abstract

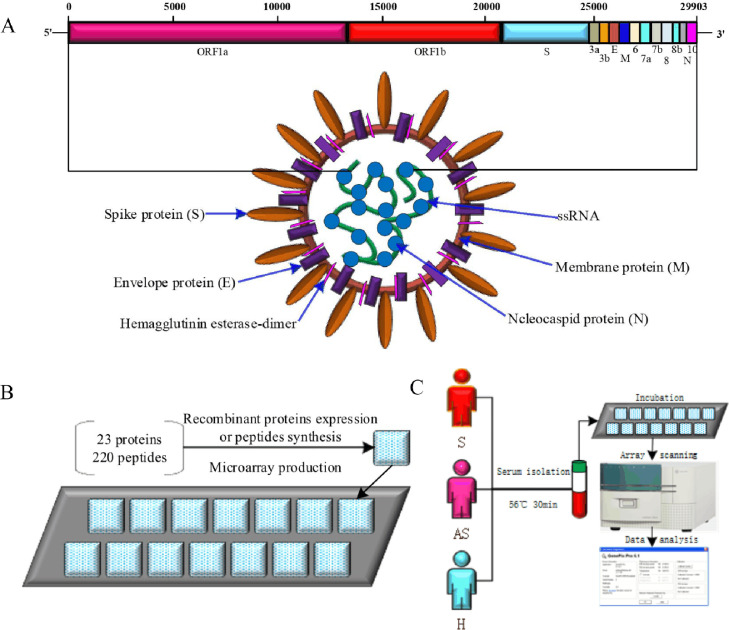
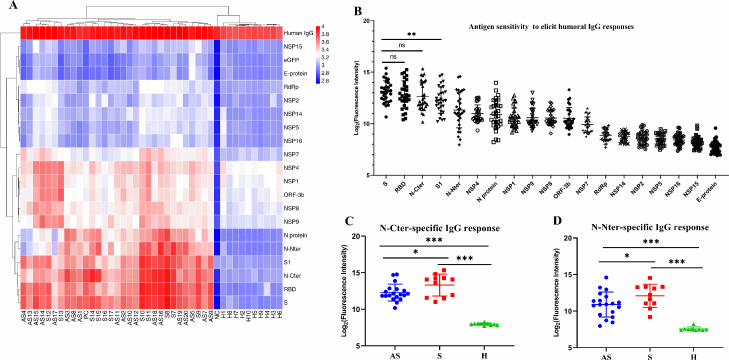
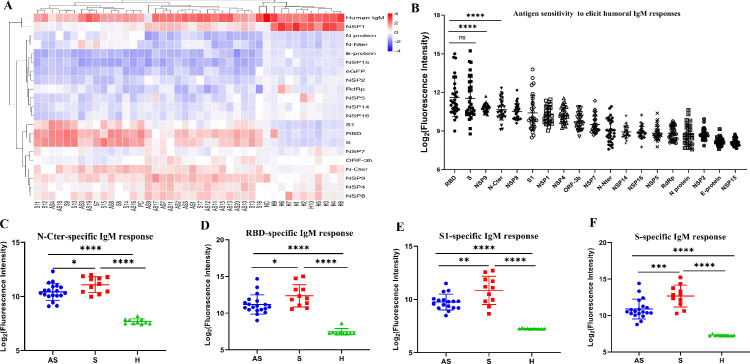
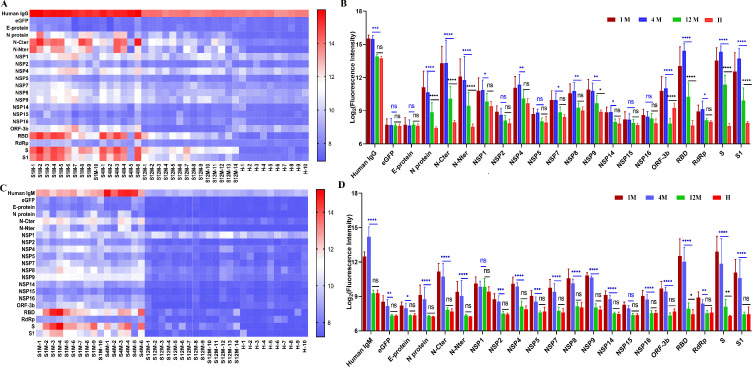
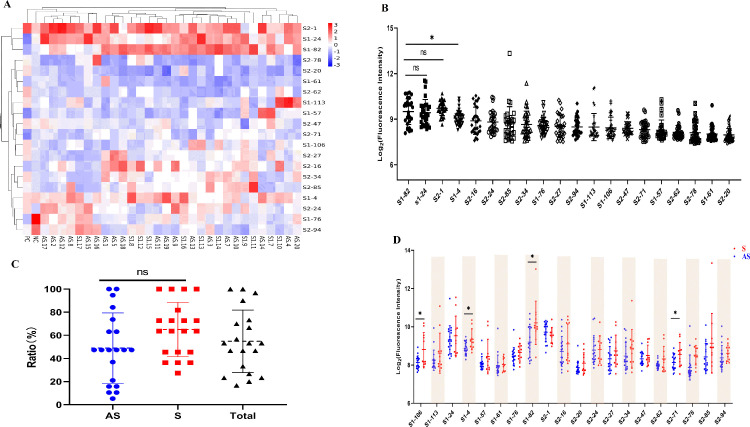
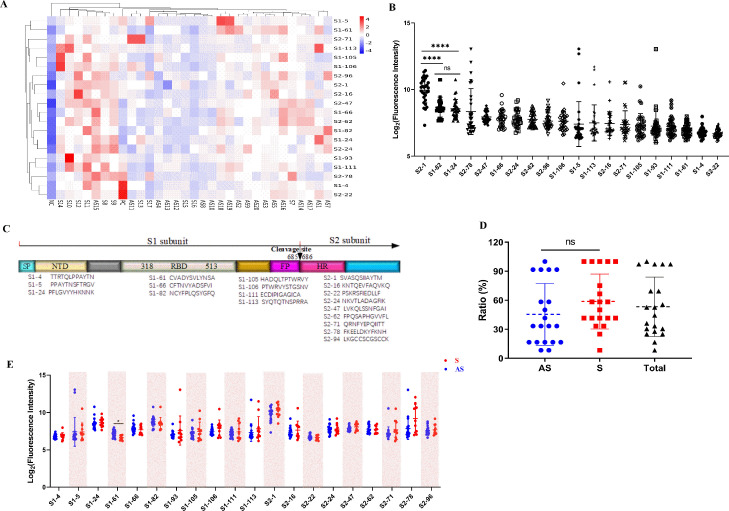
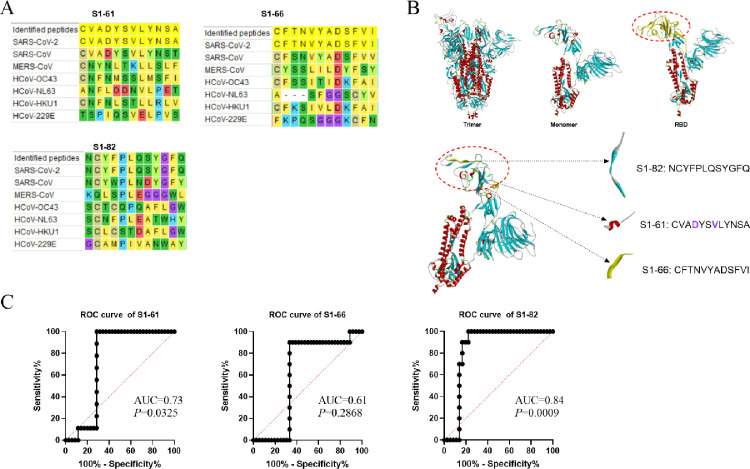
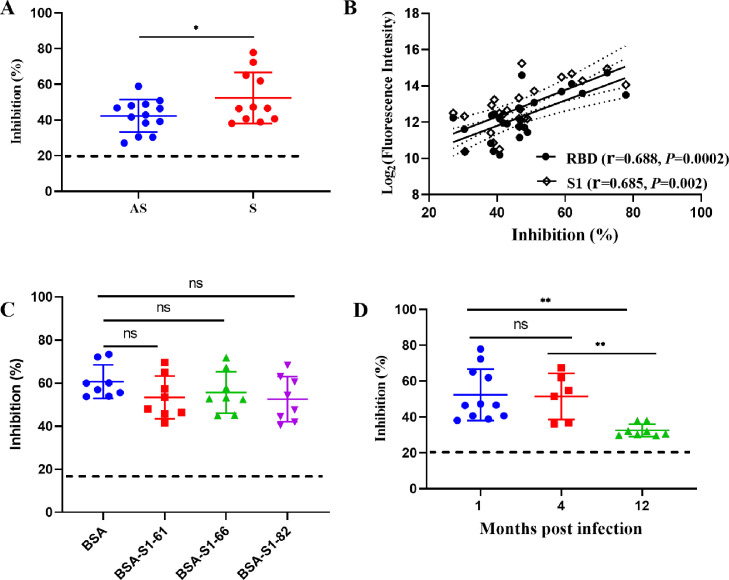
We know little about the antigen bias in SARS-CoV-2 humoral response and the epitopes of spike recognized by the immune system in asymptomatic (AS) patients and symptomatic (S) patients. Here, we used a microarray to evaluate the humoral immune response in the sera collected from 33 COVID-19-recovered patients up to 1 year. We found that the levels of IgG and IgM induced by the 23 proteins differed significantly in the same patients, and were able to distinguish AS and S patients. The N- and S-specific antibodies were detected even at 12 months after onset. Five epitopes were identified to be associated with the clinical adverse events, and three peptides located in RBD. Overall, this study presents a systemic view of the SARS-CoV-2 specific IgG and IgM responses between AS and S recovered patients and provide insights to promote precise development of SARS-CoV-2 vaccines.

Keywords: Antibodies; Antigen bias; Epitopes; Proteome microarray; SARS-CoV-2.


Conflict of interest statement

The authors declare that they have no known competing financial interests or personal relationships that could have appeared to influence the work reported in this paper.

Figures

Fig 1
Fig. 1
The evaluation and comparison of humoral immunity of SARS-CoV-2–infected patients using a modified microarray. (A) The structure diagrams of SARS-CoV-2. (B) The construction and modification of microarray. (C) The schematic diagram of SARS-CoV-2–specific IgG and IgM detection.
Fig 2
Fig. 2
The comparison of SARS-CoV-2–specific IgG fluorescence intensity profiles. (A) Each square presents the IgG antibody response against the protein (row) in the serum (column). (B) The intensity of antibodies induced by SARS-CoV-2 proteins. The intensity of antibodies against N—Cter (C) and N—Nter (D) was different between asymptomatic and symptomatic infection. AS: Asymptomatic infection (n = 19), S: Symptomatic infection (n = 11), H: Healthy controls (n = 10). One-way ANOVA were used for the data analysis. P values were calculated by the One-way ANOVA. Q values were adjusted p-values using BH method. Q-values < 0.05 were considered significant. ns: not significant, * q<0.05, ** q<0.01, **** q<0.0001.
Fig 3
Fig. 3
The comparison of SARS-CoV-2–specific IgM fluorescence intensity profiles. (A) Each square presents the IgM antibody response against the protein (row) in the serum (column). (B) The intensity of IgM antibodies induced by SARS-CoV-2 proteins. The intensity of antibodies against N—Cter (C), RBD (D), S1 (E), and S (F) was different between asymptomatic and symptomatic infection. AS: Asymptomatic infection (n = 19), S: Symptomatic infection (n = 11), H: Healthy controls (n = 10). P values were calculated by the multiple t-test. Q values were adjusted p-values using BH method. Q-values < 0.05 were considered significant. ns: not significant, * q<0.05, ** q<0.01, *** q<0.001, **** q<0.0001.
Fig 4
Fig. 4
The IgG and IgM response of the S recovered sera against the proteins at 1 month, 4 months and 12 months after infection onset. (A) The heat map of IgG response. Each square indicates the IgG antibody response against the protein (column) in the serum (row). (B) The IgG response was compared between different time points. (C) The heat map of IgM response. Each square indicates the IgM antibody response against the protein (column) in the serum (row). (D) The IgM response was compared between different time points. P values were calculated by the Two-way ANOVA. Q values were adjusted p-values using BH method. Q-values < 0.05 were considered significant. ns: not significant, * q<0.05, ** q<0.01, *** q<0.001, **** q<0.0001.
Fig 5
Fig. 5
The top 20 peptides recognized by SARS-CoV-2–specific IgM. (A) The heat map of IgM, where each square presents the IgM antibody response against the peptides (row) in the serum (column). (B) The intensity of IgM antibodies induced by the 20 peptides. (C) The percentage of positive patients recognized by the 20 peptides. (D) The level of IgM against the top 20 peptides. P values were calculated by the One-way ANOVA and multiple t-tests. Q values were adjusted p-values using BH method. Q-values < 0.05 were considered significant. ns: not significant, * q<0.05.
Fig 6
Fig. 6
The lgG immune response against the top 20 peptides. (A) The heat map of top 20 peptides response to serum isolated from asymptomatic and symptomatic patients. (B) The sensitivity of the top 20 peptides. (C) The distribution of the peptides in spike. (D) The 20 peptides-positive ratio in asymptomatic and symptomatic patients. (E) The level of IgG response against the top 20 peptides. P values were calculated by the One-way ANOVA and multiple t-tests. Q values were adjusted p-values using BH method. Q-values < 0.05 were considered significant. ns: not significant, ** q<0.01, *** q<0.0001, **** q<0.0001.
Fig 7
Fig. 7
Characteristics of the three peptides identified in RBD. (A) Sequence alignment of S1–61, S1–66, and S1–82 in different coronaviruses. (B) The location of S1–61, S1–66, and S1–82 in spike. Purple marked amino acids represent key residues of predominant binding forces. (C) The sensitivity and specificity of S1–61, S1–66, and S1–82.
Fig 8
Fig. 8
The inhibitory ability of neutralizing antibodies. (A) The inhibitory ability of serum isolated from AS and S patients to inhibit the binding of spike and ACE2. (B) The association between the humoral immune response and inhibitory ability. (C) The inhibitory ability of neutralizing antibodies after absorption of S1–61, S1–66, and S1–82 specific antibodies. For A, p-value was calculated by unpaired t-test, * p <0.05. For C-D, p values were calculated by the One-way ANOVA. Q values were adjusted p-values using BH method. Q-values < 0.05 were considered significant. ns: not significant, * q < 0.05, ** q < 0.01.

Similar articles

References

    1. Diagnosis and treatment protocol for novel coronavirus pneumonia (Trial Version 7) Chin. Med. J. (Engl.) 2020;133(9):1087–1095. doi: 10.1097/CM9.0000000000000819. - DOI - PMC - PubMed
    1. Amrun S.N., Lee C.Y., Lee B., Fong S.W., Young B.E., Chee R.S., et al. Linear B-cell epitopes in the spike and nucleocapsid proteins as markers of SARS-CoV-2 exposure and disease severity. EBioMedicine. 2020 doi: 10.1016/j.ebiom.2020.102911. - DOI - PMC - PubMed
    1. Bojkova D., Klann K., Koch B., Widera M., Krause D., Ciesek S., et al. Proteomics of SARS-CoV-2-infected host cells reveals therapy targets. NatureNature. 2020;583(7816):469–472. doi: 10.1038/s41586-020-2332-7. - DOI - PMC - PubMed
    1. Braun J., Loyal L., Frentsch M., Wendisch D., Georg P., Kurth F., et al. SARS-CoV-2-reactive T cells in healthy donors and patients with COVID-19. Nature. 2020;587(7833):270–274. doi: 10.1038/s41586-020-2598-9. - DOI - PubMed
    1. Chi X., Yan R., Zhang J., Zhang G., Zhang Y., Hao M., et al. A neutralizing human antibody binds to the N-terminal domain of the Spike protein of SARS-CoV-2. Science. 2020;369(6504):650–655. doi: 10.1126/science.abc6952. - DOI - PMC - PubMed

Publication types