Clinical Trial
. 2022 May 2;12(5):1248-1265.
doi: 10.1158/2159-8290.CD-21-1345.

Preclinical Characterization and Phase I Trial Results of a Bispecific Antibody Targeting PD-L1 and 4-1BB (GEN1046) in Patients with Advanced Refractory Solid Tumors

Affiliations
Clinical Trial

Preclinical Characterization and Phase I Trial Results of a Bispecific Antibody Targeting PD-L1 and 4-1BB (GEN1046) in Patients with Advanced Refractory Solid Tumors

Alexander Muik et al. Cancer Discov. .

Abstract

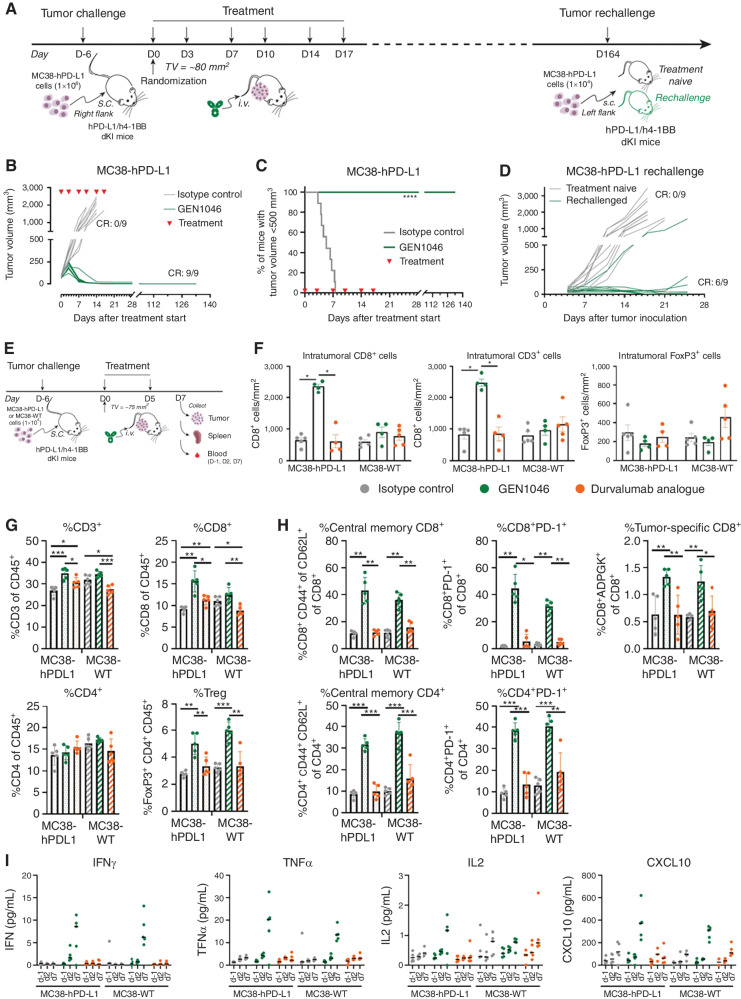
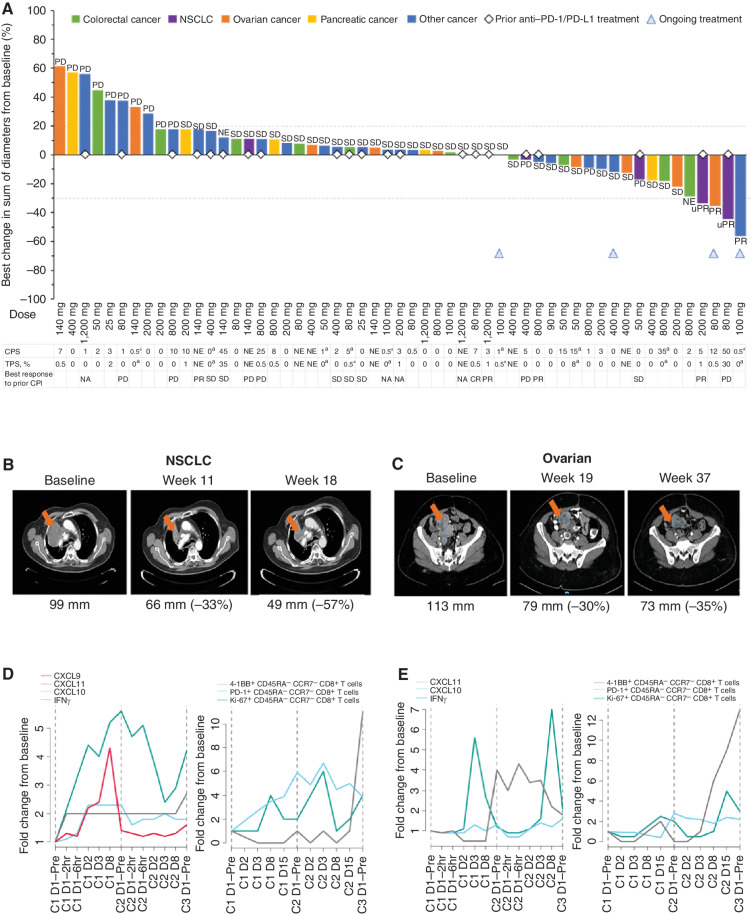
Checkpoint inhibitors (CPI) have revolutionized the treatment paradigm for advanced solid tumors; however, there remains an opportunity to improve response rates and outcomes. In preclinical models, 4-1BB costimulation synergizes with CPIs targeting the programmed cell death protein 1 (PD-1)/programmed cell death ligand 1 (PD-L1) axis by activating cytotoxic T-cell-mediated antitumor immunity. DuoBody-PD-L1×4-1BB (GEN1046) is an investigational, first-in-class bispecific immunotherapy agent designed to act on both pathways by combining simultaneous and complementary PD-L1 blockade and conditional 4-1BB stimulation in one molecule. GEN1046 induced T-cell proliferation, cytokine production, and antigen-specific T-cell-mediated cytotoxicity superior to clinically approved PD-(L)1 antibodies in human T-cell cultures and exerted potent antitumor activity in transplantable mouse tumor models. In dose escalation of the ongoing first-in-human study in heavily pretreated patients with advanced refractory solid tumors (NCT03917381), GEN1046 demonstrated pharmacodynamic immune effects in peripheral blood consistent with its mechanism of action, manageable safety, and early clinical activity [disease control rate: 65.6% (40/61)], including patients resistant to prior PD-(L)1 immunotherapy.

Significance: DuoBody-PD-L1×4-1BB (GEN1046) is a first-in-class bispecific immunotherapy with a manageable safety profile and encouraging preclinical and early clinical activity. With its ability to confer clinical benefit in tumors typically less sensitive to CPIs, GEN1046 may fill a clinical gap in CPI-relapsed or refractory disease or as a combination therapy with CPIs. See related commentary by Li et al., p. 1184. This article is highlighted in the In This Issue feature, p. 1171.


Figures

Figure 1. GEN1046 induces dose-dependent, conditional T-cell proliferation and cytokine production and enhances antigen-specific T-cell–mediated cytotoxicity in vitro. A and B, Activated T cells were cocultured with autologous iDCs in the presence of GEN1046 0.125 µg/mL or control antibodies, and T-cell/iDC clusters were visualized over time by live-cell imaging. Quantification of the number of T cells in contact with a given DC on average (A; ns), or over time (B; left), as well as the duration of these DC/T-cell clusters (B; right) is shown. ****, P < 0.0001; Mann–Whitney U test. C, Induction of 4-1BB signaling by GEN1046 or control antibodies was assessed using a 4-1BB reporter assay. D, Blockade of the PD-1/PD-L1 interaction by GEN1046 or control antibodies was assessed using a PD-1/PD-L1 blockade bioassay. E, CFSE-labeled human PBMCs were stimulated with anti-CD3 0.1 µg/mL and incubated with GEN1046 or control antibodies (0.2 µg/mL) for 4 days. CFSE dilution in CD8+ T cells was analyzed by flow cytometry, and the expansion index was calculated. Data shown are the fold change in expansion index of treatment groups relative to untreated cells, of individual donors, and mean ± standard deviation (n = 11). ****, P < 0.0001; **, P < 0.01; *, P < 0.05, Friedman test with Dunn multiple comparisons test. F, CD8+ T cells were electroporated with RNA encoding a CLDN6-specific TCR and PD-1, labeled with CFSE, and cocultured with autologous DCs electroporated with CLDN6-encoding RNA in the presence of the GEN1046 or control antibodies (0.2 µg/mL) for 4 days. Proliferation was measured by CFSE dilution as described in E. ****, P < 0.0001, Friedman test with Dunn multiple comparisons test. G, IFNγ concentrations in supernatant taken after 48 hours from cultures as described in F. Data shown are mean concentration ± standard deviation of triplicate wells from one representative donor (n = 3). H–K, CD8+ T cells were electroporated with RNA encoding a CLDN6-specific TCR and were preactivated for 24 hours in coculture with CLDN6-expressing MDA-MB-231 cells (MDA-MB-231 hCLDN6) to induce 4-1BB expression. Subsequently, the preactivated CD8+ T cells were transferred to cocultures with previously seeded MDA-MB-231 hCLDN6 tumor cells (hCLDN6+ PD-L1+) in the presence of 0.2 µg/mL GEN1046 or control antibodies. H–I, After 48 hours, expression of cytotoxic mediator GZMB and degranulation marker CD107a by the CD8+ T cells was assessed; pooled data from four experiments (n = 3–12) are depicted. MFIs are expressed as relative values compared with the isotype control condition. J, Cytotoxicity of the CD8+ T cells toward MDA-MB-231 CLDN6 cells was monitored by electrical impedance measurement over 5 days using the xCELLigence real-time cell analysis. Representative data from cocultures derived from one individual donor are shown (n = 12). Data were normalized to the time point of coculture start and expressed relative to tumor-cell cultures without T cells (without T cells set to 100%). K, AUC (total area) analysis of cytotoxicity data (n = 11–12). ****, P < 0.0001; ***, P < 0.001; **, P < 0.01; *, P < 0.05, mixed-effect analysis with Dunnett multiple comparisons test. MFI, median fluorescence intensity; ns, not significant.
Figure 1.
GEN1046 induces dose-dependent, conditional T-cell proliferation and cytokine production and enhances antigen-specific T-cell–mediated cytotoxicity in vitro. A and B, Activated T cells were cocultured with autologous iDCs in the presence of GEN1046 or control antibodies (0.125 µg/mL), and T-cell/iDC clusters were visualized over time by live-cell imaging. Quantification of the number of T cells in contact with a given DC on average (A), or over time (B; left), as well as the duration of these DC/T-cell clusters (B; right) is shown. ****, P < 0.0001; ns, not significant; Mann–Whitney U test. C, Induction of 4-1BB signaling by GEN1046 or control antibodies was assessed using a 4-1BB reporter assay. D, Blockade of the PD-1/PD-L1 interaction by GEN1046 or control antibodies was assessed using a PD-1/PD-L1 blockade bioassay. E, CFSE-labeled human PBMCs were stimulated with anti-CD3 (0.1 µg/mL) and incubated with GEN1046 or control antibodies (0.2 µg/mL) for 4 days. CFSE dilution in CD8+ T cells was analyzed by flow cytometry, and the expansion index was calculated. Data shown are the fold change in expansion index of treatment groups, relative to untreated cells of individual donors, as well as mean ± standard deviation (n = 11). ****, P < 0.0001; **, P < 0.01; *, P < 0.05, Friedman test with Dunn multiple comparisons test. F, CD8+ T cells were electroporated with RNA encoding a CLDN6-specific TCR and PD-1, labeled with CFSE, and cocultured with autologous DCs electroporated with CLDN6-encoding RNA in the presence of GEN1046 or control antibodies (0.2 µg/mL) for 4 days. Proliferation was measured by CFSE dilution as described in E. ****, P < 0.0001, Friedman test with Dunn multiple comparisons test. G, IFNγ concentrations in supernatant taken after 48 hours from cultures as described in F. Data shown are mean concentration ± standard deviation of triplicate wells from one representative donor (n = 3 donors). H–K, CD8+ T cells were electroporated with RNA encoding a CLDN6-specific TCR and were preactivated for 24 hours in coculture with CLDN6-expressing MDA-MB-231 cells (MDA-MB-231 hCLDN6) to induce 4-1BB expression. Subsequently, the preactivated CD8+ T cells were transferred to cocultures with previously seeded MDA-MB-231 hCLDN6 tumor cells (hCLDN6+ PD-L1+) in the presence of GEN1046 or control antibodies (0.2 µg/mL). HI, After 48 hours, expression of cytotoxic mediator GZMB and degranulation marker CD107a by the CD8+ T cells was assessed; pooled data from four experiments (n = 3–12) are depicted. MFIs are expressed as relative values compared with the isotype control condition. J, Cytotoxicity of the CD8+ T cells toward MDA-MB-231 CLDN6 cells was monitored by electrical impedance measurement over 5 days using the xCELLigence real-time cell analysis. Representative data (mean ± standard deviation of triplicate wells) from cocultures derived from one individual donor are shown (n = 12). Data were normalized to the time point of coculture start and expressed relative to tumor-cell cultures without T cells (without T cells set to 100%). K, AUC (total area) analysis of cytotoxicity data (n = 11–12). ****, P < 0.0001; ***, P < 0.001; **, P < 0.01; *, P < 0.05, mixed-effect analysis with Dunnett multiple comparisons test. MFI, median fluorescence intensity; ns, not significant.
Figure 2. GEN1046 therapeutic efficacy and antitumor immune responses in MC38-hPD-L1 tumor–bearing hPD-L1/h4-1BB dKI mice. A, MC38-hPD-L1 cells (1 × 10⁶ tumor cells) were injected s.c. in the right flank of hPD-L1/h4-1BB dKI mice. After tumor establishment (average tumor volume, ∼80 mm3), mice were randomized and treated with GEN1046 or isotype control antibody (each 5 mg/kg intravenous) at the indicated time points (n = 9 per group). B, Tumor growth of individual mice in each group, with CR defined as number of animals with CR. C, Progression-free survival, defined as the percentage of mice with tumor volume smaller than 500 mm3, is shown as a Kaplan–Meier curve. Mantel–Cox analysis was used to compare survival between treatment groups. ****, P < 0.0001. D, Mice with complete tumor regression after treatment with GEN1046 (shown in B) were rechallenged by s.c. injection of 1 × 10⁶ MC38-hPD-L1 tumor cells in the left flank on day 164. As a control group, a second cohort of naïve transgenic animals was inoculated with 1 × 10⁶ MC38-hPD-L1 tumor cells. Tumor growth of individual mice in each group is shown. E–I, MC38-hPD-L1 or MC38-WT cells (1 × 10⁶ tumor cells) were injected s.c. in the right flank of hPD-L1/h4-1BB dKI mice. After tumor establishment (mean tumor volume, ∼75 mm3), mice were randomized and treated with GEN1046, a durvalumab analogue or isotype control antibody (all 5 mg/kg intravenous) at the indicated time points. The mice were sacrificed 2 days after the last treatment (n = 5 per treatment group), and the tumors and spleens were excised. F, Sections of resected tumors (4 µm) were stained using anti-CD3, anti-CD8, or anti-FoxP3 antibodies by IHC. The number of positive cells was quantified per mm2. Mann–Whitney U statistical analysis was performed to compare the number of cellular subsets between treatment groups in MC38-hPD-L1 or MC38-WT-bearing mice. *, P < 0.05. G and H, Flow cytometry analysis of dissociated splenocytes. Data from individual mice are shown as well as group mean ± SEM. *, P < 0.05; **, P < 0.01; ***, P < 0.001, Wilcoxon rank sum test. I, Peripheral blood samples were taken 1 day before treatment (d−1) and 2 days after each treatment. Cytokine analysis was performed by electrochemiluminescence immunoassay analyzer. s.c., subcutaneous.
Figure 2.
GEN1046 therapeutic efficacy and antitumor immune responses in MC38-hPD-L1 tumor–bearing hPD-L1/h4-1BB dKI mice. A, MC38-hPD-L1 cells (1 × 10⁶ tumor cells) were injected s.c. in the right flank of hPD-L1/h4-1BB dKI mice. After tumor establishment (average tumor volume, ∼80 mm3), mice were randomized and treated with GEN1046 or isotype control antibody (each 5 mg/kg intravenous) at the indicated time points (n = 9 per group). B, Tumor growth of individual mice in each group, with CR defined as number of animals with CR. C, Progression-free survival, defined as the percentage of mice with tumor volume smaller than 500 mm3, is shown as a Kaplan–Meier curve. Mantel–Cox analysis was used to compare survival between treatment groups. ****, P < 0.0001. D, Mice with CR after treatment with GEN1046 (shown in B) were rechallenged by s.c. injection of 1 × 10⁶ MC38-hPD-L1 tumor cells in the left flank on day 164. As a control group, a second cohort of naïve dKI animals was inoculated with 1 × 10⁶ MC38-hPD-L1 tumor cells. Tumor growth of individual mice in each group is shown. E–I, MC38-hPD-L1 or MC38-WT cells (1 × 10⁶ tumor cells) were injected s.c. in the right flank of hPD-L1/h4-1BB dKI mice. After tumor establishment (mean tumor volume, ∼75 mm3), mice were randomized and treated with GEN1046, a durvalumab analogue, or isotype control antibody (all 5 mg/kg intravenous) at the indicated time points. The mice were sacrificed 2 days after the last treatment (n = 5 per treatment group), and the tumors and spleens were excised. F, Sections of resected tumors (4 µm) were stained using anti-CD3, anti-CD8, or anti-FoxP3 antibodies by IHC. The number of positive cells was quantified per mm2. Mann–Whitney U statistical analysis was performed to compare the number of cellular subsets between treatment groups in MC38-hPD-L1 or MC38-WT tumor–bearing mice. *, P < 0.05. G and H, Flow cytometry analysis of dissociated splenocytes. Data from individual mice are shown as well as group mean ± SEM. *, P < 0.05; **, P < 0.01; ***, P < 0.001, Wilcoxon rank sum test. I, Peripheral blood samples were taken 1 day before treatment (d−1) and 2 days after each treatment. Cytokine analysis was performed by electrochemiluminescence immunoassay. s.c., subcutaneous; Treg, regulatory T cell.
Figure 3. GEN1046 promotes TIL expansion from patient-derived tumor tissue. Tumor tissues resected from patients with NSCLC were cut into pieces of 1–2 mm3 and cultured in the presence of IL2 (10–50 U/mL) and GEN1046 0.2 µg/mL (or a GEN1046 surrogate comprising the PD-L1–specific Fab arm of GEN1046 and a nonhumanized variant of the 4-1BB—specific Fab arm; in B) or atezolizumab, or with IL2 only for 14–17 days. A, Cell numbers after expansion were determined by flow cytometry, and total TIL, CD8+, CD4+ T cells, and NK cells are shown for three patients. Tumor PD-L1 expression and 4-1BB expression by CD8+ T cells in the specimen at baseline are indicated. B, TCR repertoire analysis was performed by TRB RNA-seq of the expanded TIL and the tumor fragments. Cumulative frequency of shared clonotypes, the 20 most abundant clonotypes in the GEN1046 surrogate–treated cultures, is shown. C, TILs expanded as in A were restimulated with enzymatically digested autologous tumor (TC) in the presence or absence of an MHC I–blocking antibody. Expression of 4-1BB and intracellular expression of IFNγ and CD107a in CD8+ T cells was analyzed by flow cytometry.
Figure 3.
GEN1046 promotes TIL expansion from patient-derived tumor tissue. Tumor tissues resected from patients with NSCLC were cut into pieces of 1 to 2 mm3 and cultured in the presence of IL2 (10–50 U/mL) and GEN1046 (or a GEN1046 surrogate comprising the PD-L1–specific Fab arm of GEN1046 and a nonhumanized variant of the 4-1BB–specific Fab arm or atezolizumab (0.2 µg/mL), or with IL2 only for 14–17 days. A, Cell numbers after expansion were determined by flow cytometry, and total TILs, CD8+ T cells, CD4+ T cells, and NK cells are shown for three patients. Tumor PD-L1 expression and 4-1BB expression by CD8+ T cells in the specimen at baseline are indicated. B, TCR repertoire analysis was performed by TRB RNA sequencing of the expanded TILs and the tumor fragments. Cumulative frequency of shared clonotypes, the 20 most abundant clonotypes in the GEN1046 surrogate–treated cultures, is shown. C, TILs expanded as in A were restimulated with enzymatically digested autologous tumor (TC) in the presence or absence of an MHC I–blocking antibody. Expression of 4-1BB and intracellular expression of IFNγ and CD107a in CD8+ T cells were analyzed by flow cytometry.
Figure 4. Pharmacokinetics and pharmacodynamics of GEN1046 in patients with advanced solid tumors. A, Mean plasma concentration of GEN1046 during the first two dosing cycles with administration Q3W. B and C, Maximal fold change from baseline in pharmacodynamic markers measured in peripheral blood during cycle 1 in patients receiving low (≤200 mg) and high (≥400 mg) doses of GEN1046. P values from the Wilcoxon–Mann–Whitney test.
Figure 4.
Pharmacokinetics and pharmacodynamics of GEN1046 in patients with advanced solid tumors. A, Mean plasma concentration of GEN1046 during the first two dosing cycles with administration Q3W. B and C, Maximal fold change from baseline in pharmacodynamic markers measured in peripheral blood during cycle 1 in patients receiving low (≤200 mg) and high (≥400 mg) doses of GEN1046. P values from the Wilcoxon–Mann–Whitney test. LLOQ, lower limit of quantification.
Figure 5. GEN1046 antitumor efficacy in patients with advanced solid tumors. A, Waterfall plot of best relative percent change from baseline in tumor size. B and C, CT over time and D–E, plots of immunologic changes in the periphery following the first dose of GEN1046 in (B, D) a patient with metastatic NSCLC treated with GEN1046 200 mg and (C, E) a patient with metastatic ovarian cancer treated with GEN1046 80 mg. Numbers (percentages) below CT scans are sum of diameter of target lesion (percent change from baseline). NE, not evaluable. aArchival formalin-fixed paraffin-embedded block of tumor tissue obtained >5 years prior was evaluated; loss of PD-L1 immunoreactivity may have occurred.
Figure 5.
GEN1046 antitumor efficacy in patients with advanced solid tumors. A, Waterfall plot of best relative percent change from baseline in tumor size. BE, CT over time (B and C) and plots of immunologic changes in the periphery (D and E) following the first dose of GEN1046 in a patient with metastatic NSCLC treated with 200 mg GEN1046 (B and D) and a patient with metastatic ovarian cancer treated with 80 mg GEN1046 (C and E). Numbers (percentages) below CT scans are sum of diameter of target lesion (percent change from baseline). NA, not applicable; NE, not evaluable. aArchival formalin-fixed paraffin-embedded block of tumor tissue obtained >5 years prior was evaluated; loss of PD-L1 immunoreactivity may have occurred.

Comment in

References

    1. Nixon NA, Blais N, Ernst S, Kollmannsberger C, Bebb G, Butler M, et al. . Current landscape of immunotherapy in the treatment of solid tumours, with future opportunities and challenges. Curr Oncol 2018;25:e373–e84. - PMC - PubMed
    1. Sharma P, Siddiqui BA, Anandhan S, Yadav SS, Subudhi SK, Gao J, et al. . The next decade of immune checkpoint therapy. Cancer Discov 2021;11:838–57. - PubMed
    1. Jenkins RW, Barbie DA, Flaherty KT. Mechanisms of resistance to immune checkpoint inhibitors. Br J Cancer 2018;118:9–16. - PMC - PubMed
    1. Schadendorf D, Hodi FS, Robert C, Weber JS, Margolin K, Hamid O, et al. . Pooled analysis of long-term survival data from phase II and phase III trials of ipilimumab in unresectable or metastatic melanoma. J Clin Oncol 2015;33:1889–94. - PMC - PubMed
    1. Sun JY, Zhang D, Wu S, Xu M, Zhou X, Lu XJ, et al. . Resistance to PD-1/PD-L1 blockade cancer immunotherapy: mechanisms, predictive factors, and future perspectives. Biomark Res 2020;8:35. - PMC - PubMed

Publication types

Associated data

LinkOut - more resources