Repeat Measures of Lipoprotein(a) Molar Concentration and Cardiovascular Risk
- PMID: 35177190
- PMCID: PMC8863206
- DOI: 10.1016/j.jacc.2021.11.055
Repeat Measures of Lipoprotein(a) Molar Concentration and Cardiovascular Risk
Erratum in
-
Correction.J Am Coll Cardiol. 2022 Aug 9;80(6):651. doi: 10.1016/j.jacc.2022.06.014. J Am Coll Cardiol. 2022. PMID: 35926943 No abstract available.
Abstract
Background: When indicated, guidelines recommend measurement of lipoprotein(a) for cardiovascular risk assessment. However, temporal variability in lipoprotein(a) is not well understood, and it is unclear if repeat testing may help refine risk prediction of coronary artery disease (CAD).
Objectives: The authors examined the stability of repeat lipoprotein(a) measurements and the association between instability in lipoprotein(a) molar concentration with incident CAD.
Methods: The authors assessed the correlation between baseline and first follow-up measurements of lipoprotein(a) in the UK Biobank (n = 16,017 unrelated individuals). The association between change in lipoprotein(a) molar concentration and incident CAD was assessed among 15,432 participants using Cox proportional hazards models.
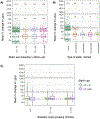
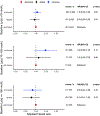
Results: Baseline and follow-up lipoprotein(a) molar concentration were significantly correlated over a median of 4.42 years (IQR: 3.69-4.93 years; Spearman rho = 0.96; P < 0.0001). The correlation between baseline and follow-up lipoprotein(a) molar concentration were stable across time between measurements of <3 (rho = 0.96), 3-4 (rho = 0.97), 4-5 (rho = 0.96), and >5 years (rho = 0.96). Although there were negligible-to-modest associations between statin use and changes in lipoprotein(a) molar concentration, statin usage was associated with a significant increase in lipoprotein(a) among individuals with baseline levels ≥70 nmol/L. Follow-up lipoprotein(a) molar concentration was significantly associated with risk of incident CAD (HR per 120 nmol/L: 1.32 [95% CI: 1.16-1.50]; P = 0.0002). However, the delta between follow-up and baseline lipoprotein(a) molar concentration was not significantly associated with incident CAD independent of follow-up lipoprotein(a) (P = 0.98).
Conclusions: These findings suggest that, in the absence of therapies substantially altering lipoprotein(a), a single accurate measurement of lipoprotein(a) molar concentration is an efficient method to inform CAD risk.
Keywords: Lp(a); coronary artery disease; lipoprotein(a); longitudinal; repeat testing.
Copyright © 2022 American College of Cardiology Foundation. Published by Elsevier Inc. All rights reserved.
Conflict of interest statement
Funding Support and Author Disclosures This work was supported by UK Biobank application 7089. Dr Paruchuri is supported by a grant from the National Institutes of Health National Heart, Lung, and Blood Institute (5-T32HL007208-43). Dr Zekavat is supported by the National Institutes of Health National Heart, Lung, and Blood Institute (1F30HL149180-01) and the National Institutes of Health Medical Scientist Training Program Training Grant (T32GM136651). Dr Natarajan is supported by grants from the National Institutes of Health National Heart, Lung, and Blood Institute (R01HL142711, R01HL148565, and R01HL148050) and Fondation Leducq (TNE-18CVD04), and a Hassenfeld Scholar Award from the Massachusetts General Hospital; has received grant support from Amgen, Apple, AstraZeneca, and Boston Scientific; has received consulting income from Apple, AstraZeneca, Blackstone Life Sciences, Genentech, and Novartis; and has spousal employment at Vertex, all unrelated to the present work. All other authors have reported that they have no relationships relevant to the contents of this paper to disclose.
Figures


Comment in
-
Measurement of Lipoprotein(a): A Once in a Lifetime Opportunity.J Am Coll Cardiol. 2022 Feb 22;79(7):629-631. doi: 10.1016/j.jacc.2021.11.053. J Am Coll Cardiol. 2022. PMID: 35177191 No abstract available.
References
-
- Tsimikas S A Test in context: lipoprotein(a) diagnosis, prognosis, controversies, and emerging therapies. J Am Coll Cardiol 2017;69:692–711. - PubMed
-
- Kamstrup PR, Tybjærg-Hansen A, Steffensen R, Nordestgaard BG. Genetically elevated lipoprotein(a) and increased risk of myocardial infarction. JAMA 2009;301:2331–2339. - PubMed
Publication types
MeSH terms
Substances
Grants and funding
LinkOut - more resources
Full Text Sources
Miscellaneous

