. 2022 Feb 22;119(8):e2110328119.
doi: 10.1073/pnas.2110328119.

Molecular basis of force-pCa relation in MYL2 cardiomyopathy mice: Role of the super-relaxed state of myosin

Affiliations

Molecular basis of force-pCa relation in MYL2 cardiomyopathy mice: Role of the super-relaxed state of myosin

Chen-Ching Yuan et al. Proc Natl Acad Sci U S A. .

Abstract

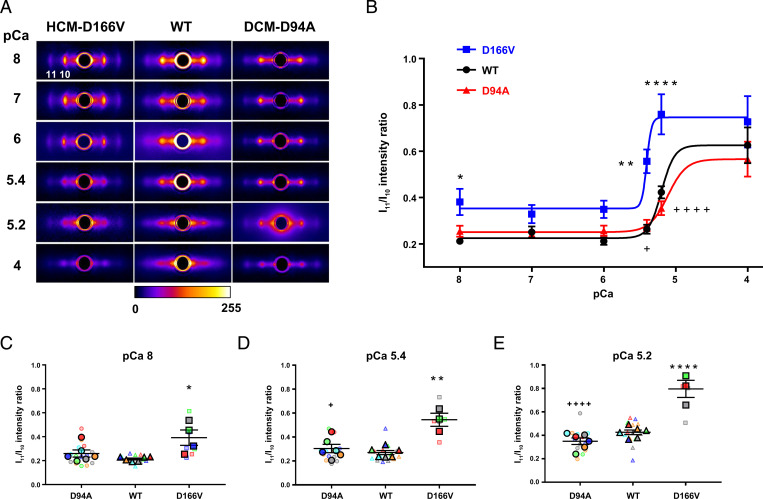
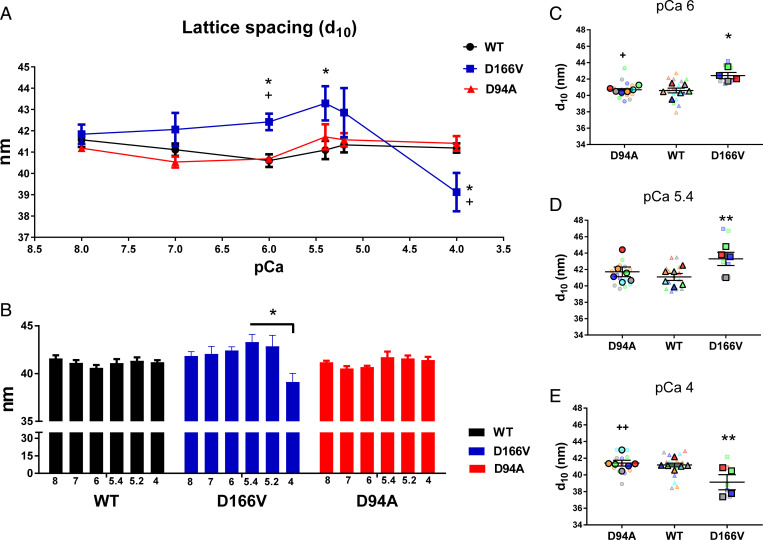
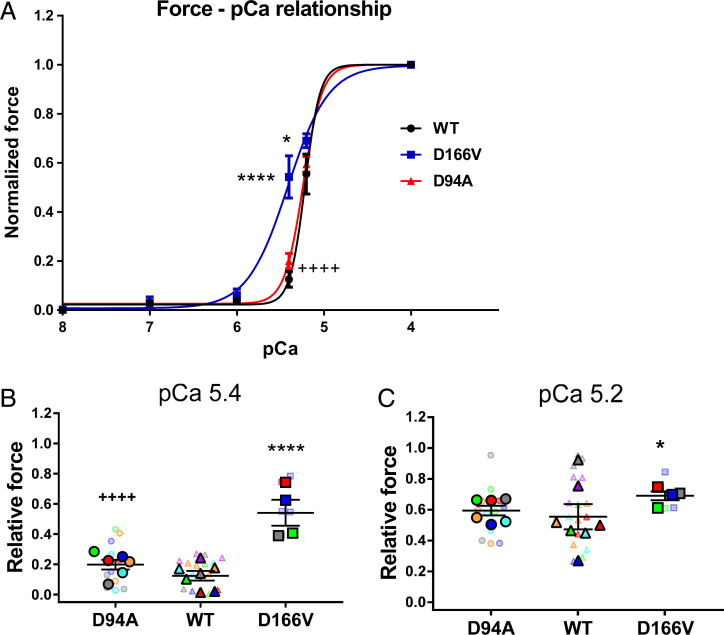
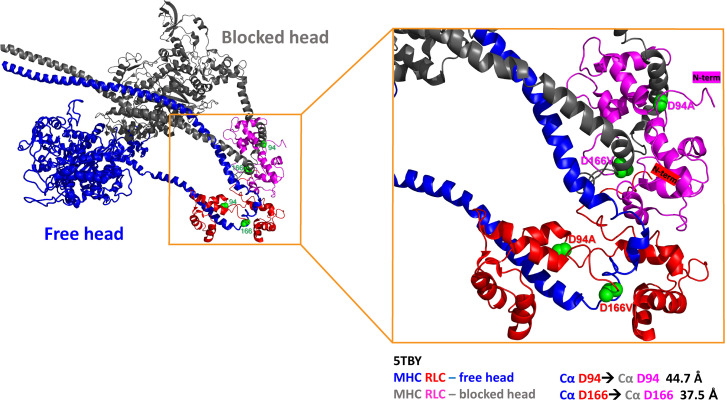
In this study, we investigated the role of the super-relaxed (SRX) state of myosin in the structure-function relationship of sarcomeres in the hearts of mouse models of cardiomyopathy-bearing mutations in the human ventricular regulatory light chain (RLC, MYL2 gene). Skinned papillary muscles from hypertrophic (HCM-D166V) and dilated (DCM-D94A) cardiomyopathy models were subjected to small-angle X-ray diffraction simultaneously with isometric force measurements to obtain the interfilament lattice spacing and equatorial intensity ratios (I11/I10) together with the force-pCa relationship over a full range of [Ca2+] and at a sarcomere length of 2.1 μm. In parallel, we studied the effect of mutations on the ATP-dependent myosin energetic states. Compared with wild-type (WT) and DCM-D94A mice, HCM-D166V significantly increased the Ca2+ sensitivity of force and left shifted the I11/I10-pCa relationship, indicating an apparent movement of HCM-D166V cross-bridges closer to actin-containing thin filaments, thereby allowing for their premature Ca2+ activation. The HCM-D166V model also disrupted the SRX state and promoted an SRX-to-DRX (super-relaxed to disordered relaxed) transition that correlated with an HCM-linked phenotype of hypercontractility. While this dysregulation of SRX ↔ DRX equilibrium was consistent with repositioning of myosin motors closer to the thin filaments and with increased force-pCa dependence for HCM-D166V, the DCM-D94A model favored the energy-conserving SRX state, but the structure/function-pCa data were similar to WT. Our results suggest that the mutation-induced redistribution of myosin energetic states is one of the key mechanisms contributing to the development of complex clinical phenotypes associated with human HCM-D166V and DCM-D94A mutations.

Keywords: equatorial intensity ratio; interfilament lattice spacing; isometric force; super-relaxed state of myosin; transgenic RLC mice.


Conflict of interest statement

The authors declare no competing interest.

Figures

Fig. 1.
Fig. 1.
Assessment of X-ray diffraction patterns in PM fibers from ∼5-mo-old DCM–D94A and HCM–D166V hearts compared with WT mice at serial pCa solutions. (A) Representative fiber diffraction patterns of HCM–D166V (Left), WT controls (Middle), and DCM–D94A (Right) models at increasing calcium concentrations from pCa 8 to 4. The legend shows the mapping of false colors into detector intensity units (ADUs). For clarity, the images had a circular symmetric diffuse background subtracted using the “quadrant fold” routine in the MuscleX software package (https://musclex.readthedocs.io/en/latest/) developed at Biophysics Collaborative Access Team. (B) Equatorial intensity ratios I11/I10 plotted as a function of calcium. The values from several fibers per mouse were averaged and the data presented as mean ± SEM of N= number of mice (3M, 3F of WT; 2M, 2F of HCM–D166V; and 3M, 3F of DCM–D94A) with statistical significance calculated by two-way ANOVA followed by Tukey’s multiple comparison test. ****P < 0.0001 and **P < 0.01 for HCM–D166V versus WT and ++++P < 0.0001 and ++P < 0.01 for DCM–D94A versus HCM–D166V. All three groups of animals passed the Shapiro–Wilk normality test for N = no. animals per group. The pCa50 values of I11/I10–pCa relationship were 5.47 ± 0.15 (D166V), 5.11 ± 0.11 (D94A), and 5.20 ± 0.04 (WT). (C–E) SuperPlots of I11/I10 ratios for DCM-D94A, WT, and HCM-D166V mice at pCa 8 (C), pCa 5.4 (D), and pCa 5.2 (E). The data per animal (N) are pictured by large, color-coded symbols and the respective fiber measurements (n) by color-coded small symbols. Note the significantly increased I11/I10 ratios in HCM–D166V versus WT hearts at pCa 8 (*), pCa 5.4 (**), and pCa 5.2 (****) and between the HCM–D166V and DCM–D94A models at pCa 5.4 (+) and pCa 5.2 (++++).
Fig. 2.
Fig. 2.
Assessment of interfilament lattice spacings (d10) in PM fibers from ∼5-mo-old DCM–D94A and HCM–D166V models compared with WT mice. (A) Interfilament lattice spacings as a function of increasing calcium concentrations. The values of d10 measured for several fibers per mouse were averaged and the data presented as mean ± SEM of N = number of mice (3M, 3F of WT; 2M, 2F of HCM–D166V; and 3M, 3F of DCM–D94A) with statistical significance calculated by two-way ANOVA followed by Tukey’s multiple comparison test. **P < 0.01 and *P < 0.05 for HCM–D166V versus WT and ++P < 0.01 and +P < 0.05 for DCM–D94A versus HCM–D166V. All three groups of animals passed the Shapiro–Wilk normality test for N = no. animals per group. (B) The comparison of d10 values within each genotype. The statistical analysis was performed by one-way ANOVA followed by Tukey multiple comparison test. *P < 0.05 depicting significance in d10 between pCa 5.4 and 5.2 versus pCa 4 in the HCM–D166V model. (C–E) SuperPlots of d10 measured for DCM–D94A, WT, and HCM–D166V mice at pCa 6 (C), pCa 5.4 (D), and pCa 4 (E). The data per animal (N) are indicated by large symbols and the respective fiber measurements (n) by color-coded small symbols. Note the significantly increased d10 for HCM–D166V versus WT hearts at pCa 6 (*) and pCa 5.4 (**) and decreased d10 at pCa 4 (**). Significantly increased d10 was also observed in HCM–D166V versus DCM–D94A at pCa 6 (+) and decreased d10 in HCM–D166V versus DCM–D94A models at pCa 4 (++).
Fig. 3.
Fig. 3.
(A) The force-pCa dependence assessed in PM fibers from WT, HCM–D166V, and DCM–D94A mice. The force-pCa data were fitted to a four-parameter logistic equation yielding the pCa50 and nH (Hill coefficient) values (Table 3). Note that the HCM–D166V model demonstrates significantly increased calcium sensitivity of force (higher pCa50) compared with WT and DCM–D94A mice. All three groups of animals passed the Shapiro–Wilk normality test for N = no. animals/per group. (B and C) SuperPlots of relative force values at pCa 5.4 (B) and pCa 5.2 (C) for DCM–D94A, WT, and HCM–D166V mice. The data per animal (N) are pictured by large symbols and the respective fiber measurements (n) by color-coded small symbols. The values from several fibers per mouse were averaged and the data presented as mean ± SEM of N = number of mice (3M, 4F of WT; 2M, 2F of HCM–D166V; and 3M, 3F of DCM–D94A) with statistical significance calculated by two-way ANOVA followed by Tukey’s multiple comparison test. ****P < 0.0001 and *P < 0.01 for HCM–D166V versus WT and ++++P < 0.0001 for DCM–D94A versus HCM–D166V.
Fig. 4.
Fig. 4.
The summary of nucleotide exchange experiments in skinned PM fibers from DCM–D94A, HCM–D166V, and WT mouse models. (A) The genotype-dependent distribution of the fast (P1) and slow (P2) parameters derived from the two-exponential fit at serial calcium solutions. Open symbols depict F mice, and closed symbols depict M mice. The data are mean ± SEM for N = 5 to 6 animals and n = 15 to 22 fibers per each pCa condition with significance calculated by two-way ANOVA with Tukey’s multiple comparison test: *P < 0.05 for DCM–D94A versus WT, +P < 0.05 and ++P < 0.01 for HCM–D166V versus DCM–D94A. Note the significant differences in P1 and P2 between DCM–D94A and WT mice at pCa 6 and between the two pathogenic RLC mutants at pCa 6, 5, and 4. (B) Comparison of P1 versus P2 in all three genotypes assessed at averaged calcium concentrations. Data points represent values averaged per animal at each pCa solution with one point = one animal at a certain pCa solution. Symbols of similar shapes between the genotypes indicate measurements performed at the same pCa. The data are mean ± SEM for N = no. animals with significance calculated with one-way ANOVA with Tukey’s multiple comparison test: *P < 0.05 and **P < 0.01 for mutant versus WT, +P < 0.05, ++P < 0.01, and ++++P < 0.0001 for DCM–D94A versus HCM–D166V. (C) The percent of myosin heads occupying the DRX versus SRX states was calculated using a correction factor of 0.44 for nonspecific mant-ATP binding (see Materials and Methods).
Fig. 5.
Fig. 5.
The tertiary structure of human β-cardiac heavy meromyosin IHM (Protein Data Bank 5TBY) and PyMOL-derived distances between Cα atoms of D94 and D166 residues positioned on the RLC of the “blocked” head (MHC: gray, RLC: pink) and the “free” head (MHC: dark blue, RLC: red). The side chains of mutations are presented as green spheres, and the N-termini of RLCs are labeled with corresponding colors, pink for the RLC of BH and red for the RLC of FH.

References

    1. Garfinkel A. C., Seidman J. G., Seidman C. E., Genetic pathogenesis of hypertrophic and dilated cardiomyopathy. Heart Fail. Clin. 14, 139–146 (2018). - PMC - PubMed
    1. Sitbon Y. H., Yadav S., Kazmierczak K., Szczesna-Cordary D., Insights into myosin regulatory and essential light chains: A focus on their roles in cardiac and skeletal muscle function, development and disease. J. Muscle Res. Cell Motil. 41, 313–327 (2020). - PMC - PubMed
    1. Yadav S., Sitbon Y. H., Kazmierczak K., Szczesna-Cordary D., Hereditary heart disease: Pathophysiology, clinical presentation, and animal models of HCM, RCM, and DCM associated with mutations in cardiac myosin light chains. Pflugers Arch. 471, 683–699 (2019). - PMC - PubMed
    1. Richard P, et al. Hypertrophic cardiomyopathy: Distribution of disease genes, spectrum of mutations, and implications for a molecular diagnosis strategy. Circulation 107, 2227–2232 (2003), and erratum in Circulation 109, 3258 (2004). - PubMed
    1. Huang W., et al. , Novel familial dilated cardiomyopathy mutation in MYL2 affects the structure and function of myosin regulatory light chain. FEBS J. 282, 2379–2393 (2015). - PMC - PubMed

MeSH terms