. 2022 Feb 22;119(8):e2113512119.
doi: 10.1073/pnas.2113512119.

Affinity maturation for an optimal balance between long-term immune coverage and short-term resource constraints

Affiliations

Affinity maturation for an optimal balance between long-term immune coverage and short-term resource constraints

Victor Chardès et al. Proc Natl Acad Sci U S A. .

Abstract

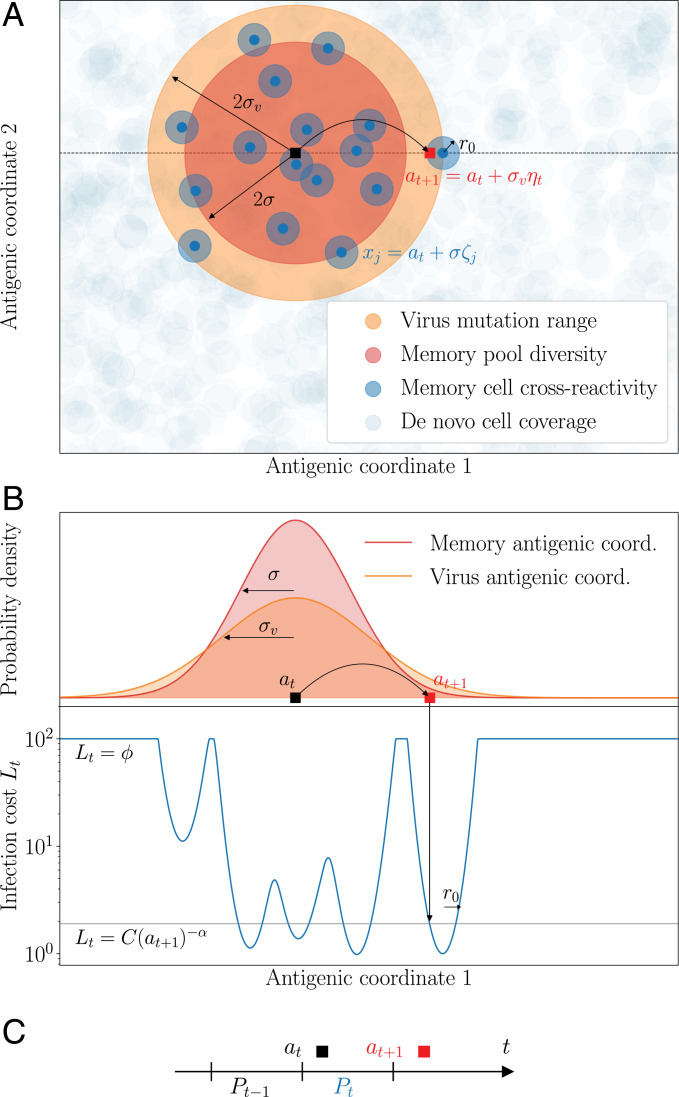
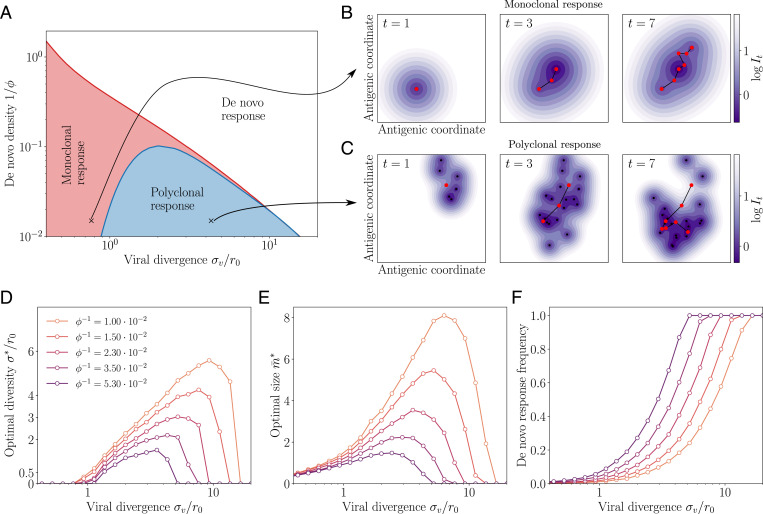
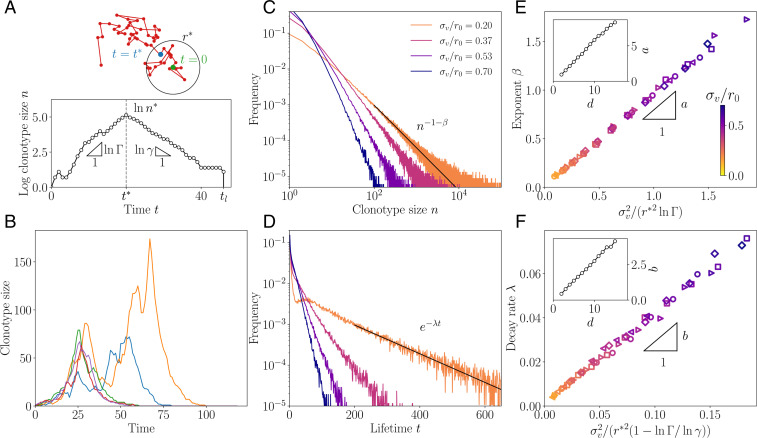
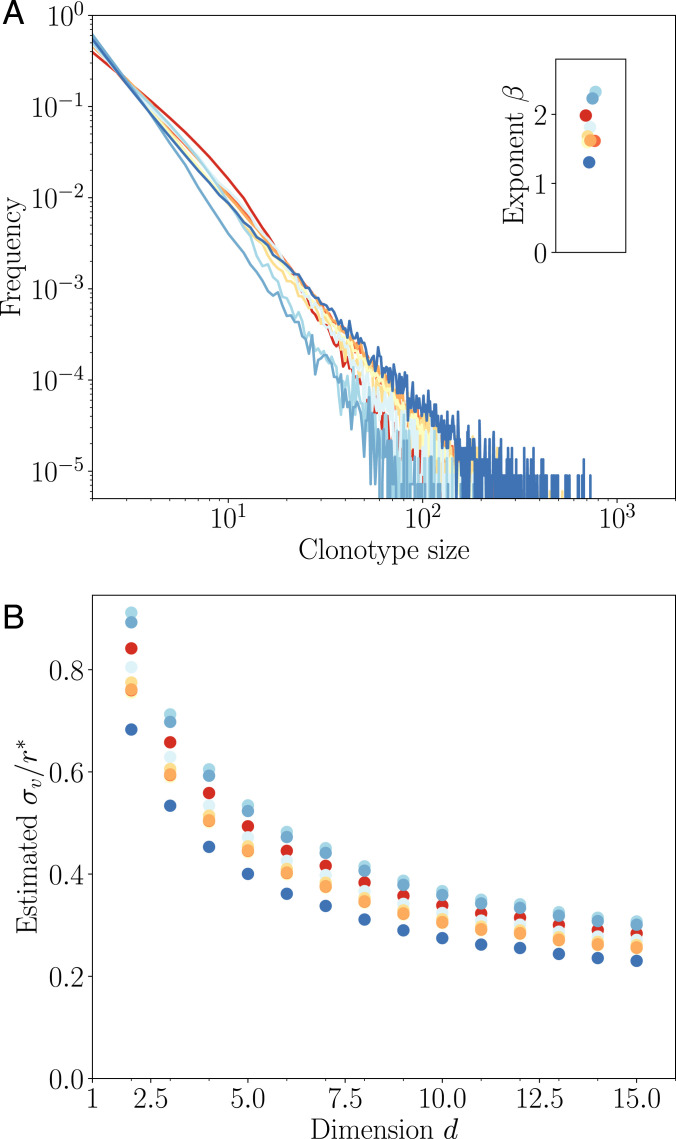
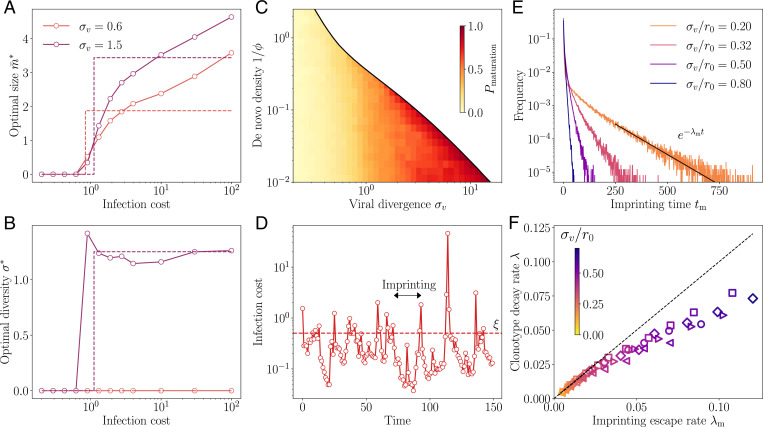
In order to target threatening pathogens, the adaptive immune system performs a continuous reorganization of its lymphocyte repertoire. Following an immune challenge, the B cell repertoire can evolve cells of increased specificity for the encountered strain. This process of affinity maturation generates a memory pool whose diversity and size remain difficult to predict. We assume that the immune system follows a strategy that maximizes the long-term immune coverage and minimizes the short-term metabolic costs associated with affinity maturation. This strategy is defined as an optimal decision process on a finite dimensional phenotypic space, where a preexisting population of cells is sequentially challenged with a neutrally evolving strain. We show that the low specificity and high diversity of memory B cells-a key experimental result-can be explained as a strategy to protect against pathogens that evolve fast enough to escape highly potent but narrow memory. This plasticity of the repertoire drives the emergence of distinct regimes for the size and diversity of the memory pool, depending on the density of de novo responding cells and on the mutation rate of the strain. The model predicts power-law distributions of clonotype sizes observed in data and rationalizes antigenic imprinting as a strategy to minimize metabolic costs while keeping good immune protection against future strains.

Keywords: B cell repertoire; affinity maturation; optimal decision theory; population dynamics.


Conflict of interest statement

The authors declare no competing interest.

Figures

Fig. 1.
Fig. 1.
Model of sequential affinity maturation. (A) An infecting strain is defined by its position an in antigenic space (dark square). In response, the immune system creates m new memory clonotypes xj (blue points) from a Gaussian distribution of width σ centered in at (red area). These new clonotypes create a cost landscape (blue areas) for the next infection, complemented by a uniform background of naive, innate, and T cells (basal coverage, light blue). The next infecting strain (red square) is drawn from a Gaussian distribution of width σv centered in at (orange area). The position of this strain on the infection landscape is shown with the arrow. Antigenic space is shown in two dimensions for illustration purposes but can have more dimensions in the model. (B) Cross-section of the distributions of memories and of the next strain, along with the infection cost landscape Lt (in blue). Memories create valleys in the landscape, on a background of baseline protection ϕ. (C) Sequential immunization. Strain at modifies the memory repertoire into Pt, which is used to fight the next infection at+1. Pt is made of all newly created clonotypes (blue points in A) as well as some previously existing ones (not shown). Clonotype abundances are boosted following each infection as a function of the cross-reactivity, and each individual cell survives from one challenge to the other with a probability γ.
Fig. 2.
Fig. 2.
Regimes of affinity maturation. (A) Phase diagram of the model as a function of the de novo density 1/ϕ and viral divergence σv, in a two-dimensional antigenic map. Three phases emerge: monoclonal memory (red), polyclonal memory (blue), and de novo response (white). Snapshots in antigenic space of the sequential immunization by a viral strain in the (B) monoclonal and (C) polyclonal phases. We show the viral position (red dots), memory clonotypes (black dots), and viral trajectory (black line). The color map shows the log infection cost. Parameters σv and ϕ correspond to the crosses on the phase diagram in A, with their respective optimal σ*,m¯* (see arrows). (D) Diversity σ*, (E) optimal size m¯*, and (F) frequency of de novo response usage to an immunization challenge for different de novo densities 1/ϕ. Parameters values: κ=3.3, α = 1, q = 2, d = 2, γ=0.85, and μ=0.5.
Fig. 3.
Fig. 3.
Clonotype dynamics and distribution. (A) Sketch of a recall response generated by sequential immunization with a drifting strain. Clonotypes first grow with multiplicative rate Γ=γ(1+μ), until they reach the effective cross-reactivity radius r*, culminating at n*, after which they decay with rate γ until extinction at time tl. (B) Sample trajectories of clonotypes generated by sequential immunization with a strain of mutability σv/r0=0.53. (C) Distribution of clonotype size for varying virus mutability σv/r0. (D) Distribution of the lifetime of a clonotype for varying virus mutability σv/r0 . In BD, the proliferation parameters are set to γ=0.85,γ=0.5, i.e., Γ=1.275. (E) Scaling relation of the power law exponent for varying values of the parameters. (Inset) Dependence of the proportionality factor a on dimension. (F) Scaling relation of the decay rate λ for varying σv/r0, with scaling of the proportionality factor b. In both E and F, the different parameters used are (γ=0.82,μ=0.65), i.e., Γ=1.353 (diamonds); (γ=0.8,μ=0.62), i.e., Γ=1.296 (squares); (γ=0.85,μ=0.5), i.e., Γ=1.275 (circles); (γ=0.87,μ=0.4), i.e., Γ=1.21 (triangles pointing to the right); and (γ=0.9,μ=0.35), i.e., Γ=1.21 (triangles pointing to the left). In BF, the strategy was optimized for ϕ=100 and κ=0.5/(1γ). The color code for σv/r0 is consistent across CF. In BF, the other parameters used are α = 1, q = 2, and d = 2.
Fig. 4.
Fig. 4.
Comparison to repertoire data. (A) Clonotype abundance distribution of IgG repertoires of healthy donors from ref. . (B) Estimated mutatibility σv in units of the rescaled cross-reactivity r*, defined as the antigenic distance at which clonotypes stop growing. σv is obtained as a function of d by inverting the linear relationship estimated in Fig. 3E, Inset, assuming q = 2 and Γ=1.4 (estimated from ref. 18).
Fig. 5.
Fig. 5.
Imprinting and backboosting. Optimal regulatory functions for (A) the number m*(I) and (B) the diversity σ*(I) of new memories as a function of the infection cost I, for two values for the viral divergence. These functions show a sharp transition from no memory formation to some memory formation, suggesting that they be replaced by simpler step functions (dashed lines). This step function approximation is used in C–F. (C) Frequency of infections leading to affinity maturation in the optimal strategy. The frequency increases with the virus divergence σv, up to the point of the transitions to the de novo phase where memory is not used at all. (D) Typical trajectory of infection cost in sequential infections at σv/r0=0.5. When the cost goes beyond the threshold ξ, affinity maturation is activated, leading to a drop in infection cost. These periods of suboptimal memory describe an original antigenic sin, whereby the immune system is frozen in the state imprinted by the last maturation event. (E) Distribution of imprinting times, i.e., the number of infections between affinity maturation events, decays exponentially with rate λm. The proliferation parameters in AE are set to γ=0.85 and μ=0.5. (F) Predicted scaling of λm with the clonotype decay rate λ from Fig. 3 D and F. In F, the different parameters used are (γ=0.82,μ=0.65), i.e., Γ=1.353 (diamonds); (γ=0.8,μ=0.62), i.e., Γ=1.296 (squares); (γ=0.85,μ=0.5), i.e., Γ=1.275 (circles); (γ=0.87,μ=0.4), i.e., Γ=1.21 (triangles pointing to the right); and (γ=0.9,μ=0.35), i.e., Γ=1.21 (triangles pointing to the left). The color code for σv/r0 is consistent across E and F. In AF, the strategy was optimized for ϕ=100 and κ=0.5/(1γ). In DF, the other parameters used are α = 1, q = 2, and d = 2.

References

    1. Nieuwenhuis P., Opstelten D., Functional anatomy of germinal centers. Am. J. Anat. 170, 421–435 (1984). - PubMed
    1. Victora G. D., Nussenzweig M. C., Germinal centers. Annu. Rev. Immunol. 30, 429–457 (2012). - PubMed
    1. Eisen H. N., Siskind G. W., Variations in affinities of antibodies during the immune response. Biochemistry 3, 996–1008 (1964). - PubMed
    1. Weisel F., Shlomchik M., Memory B cells of mice and humans. Annu. Rev. Immunol. 35, 255–284 (2017). - PubMed
    1. Weinstein J. A., Jiang N., R. A. White, 3rd, Fisher D. S., Quake S. R., High-throughput sequencing of the zebrafish antibody repertoire. Science 324, 807–810 (2009). - PMC - PubMed

LinkOut - more resources