. 2022 Feb 17;8(1):69.
doi: 10.1038/s41420-022-00867-z.

Mitochondrial homeostasis regulates definitive endoderm differentiation of human pluripotent stem cells

Affiliations

Mitochondrial homeostasis regulates definitive endoderm differentiation of human pluripotent stem cells

Jing Lv et al. Cell Death Discov. .

Abstract

Cellular organelles play fundamental roles in almost all cell behaviors. Mitochondria have been reported to be functionally linked to various biological processes, including reprogramming and pluripotency maintenance. However, very little about the role of mitochondria has been revealed in human early development and lineage specification. Here, we reported the characteristics and function of mitochondria during human definitive endoderm differentiation. Using a well-established differentiation system, we first investigated the change of mitochondrial morphology by comparing undifferentiated pluripotent stem cells, the intermediate mesendoderm cells, and differentiated endoderm cells, and found that mitochondria were gradually elongated and matured along differentiation. We further analyzed the expression pattern of mitochondria-related genes by RNA-seq, indicating that mitochondria became active during differentiation. Supporting this notion, the production of adenosine triphosphate (ATP) and reactive oxygen species (ROS) was increased as well. Functionally, we utilized chemicals and genome editing techniques, which could interfere with mitochondrial homeostasis, to determine the role of mitochondria in human endoderm differentiation. Treatment with mitochondrial inhibitors, or genetic depletion of mitochondrial transcription factor A (TFAM), significantly reduced the differentiation efficiency of definitive endoderm. In addition, the defect in endoderm differentiation due to dysfunctional mitochondria could be restored to some extent by the addition of ATP. Moreover, the clearance of excessive ROS due to dysfunctional mitochondria by N-acetylcysteine (NAC) improved the differentiation as well. We further found that ATP and NAC could partially replace the growth factor activin A for definitive endoderm differentiation. Our study illustrates the essential role of mitochondria during human endoderm differentiation through providing ATP and regulating ROS levels, which may provide new insight for metabolic regulation of cell fate determination.


Conflict of interest statement

The authors declare that the research was conducted in the absence of any commercial or financial relationships that could be construed as a potential conflict of interest.

Figures
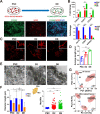
Fig. 1
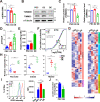
Fig. 1. Mitochondria are more mature during human DE differentiation.
A Scheme of DE differentiation. FOXA2+ (green), SOX17+, and CXCR4+ cells represented differentiated DE cells, and OCT4+, SOX2+ (red), and NANOG+ represented pluripotent cells (nucleus, DAPI, blue). Scale bar = 400 μm. B RNA expression analysis of differentiation markers and pluripotency markers during DE differentiation. Data are normalized to the mRNA level of PSCs (n = 3). C Representative images of MitoTracker staining observed through confocal in DE differentiation of iPSCs. Scale bar = 5 μm. D Quantitative statistics of mitochondrial average length in (C) using the MINA tool. E Representative mitochondrial images of ESCs, D2, DE were observed through a transmission electron microscope. Scale bar = 2 μm. F The ratio of Max/Min axes and diameter length of mitochondria (E) were statistically analyzed from about 20 independent images. G PCA analysis of all genes (top) and mitochondria-related genes (bottom) in pancreatic differentiation (GSE114099, red) and our DE differentiation (blue). All data are shown as mean ± SD. ns, not significant. *P < 0.05, **P < 0.01 and ***P < 0.001.
Fig. 2
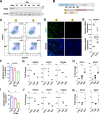
Fig. 2. Mitochondria become more active along with DE differentiation.
A The expression of mtDNA relative to the nuclear gene GAPDH in DE differentiation by RT-PCR (n = 3). B The western blot of TOMM20, TIMM23, and α-tubulin protein during DE differentiation. C Quantitative statistics of the TOMM20 and TIMM23 protein levels (tubulin as the reference protein), corresponding to (B) (n = 3). D, E Total intracellular ATP/ADP (D) (n = 10) and relative ATP content (normalized with DNA content) (E) of cells at three different stages along DE differentiation (n = 3). F Cumulative distribution curves of Log2(TPM) of ETC subunits-related genes (n = 124). The P-value was calculated by a Wilcoxon test. G Heatmap showing the expression levels of each complex related gene of ETC by RNA-seq. H Content of representative TCA metabolites in DE differentiation by untargeted metabolomics (normalized to PSCs) (n = 7). I The intracellular ROS level by FACS (left) and the corresponding mean fluorescence intensity (MFI) (right) in DE differentiation of ESCs (n = 3). Neg, negative control. J The assay of lactate production in PSCs and DE cells (n = 4). All data are shown as mean ± SD. ns, not significant. *P < 0.05, **P < 0.01 and ***P < 0.001.
Fig. 3
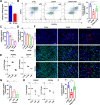
Fig. 3. Interference with mitochondrial homeostasis impairs DE differentiation.
A The western blot of TFAM and β-actin protein along with the removal time of doxycycline. B Schematic illustration of the differentiation protocol for inducible TFAM knockout PSCs. C Flow cytometric analysis to determine the change in differentiation efficiency between induced knockout and wild-type iPSCs. SOX17+ and CXCR4+ cells represented differentiated DE cells. D Immunofluorescence analysis of DE cells marked with SOX17 (green) (nucleus, DAPI, blue). Scale bar = 200 μm. E mRNA expression of endoderm- or pluripotency-marker SOX17, OCT4 in DE cells treated with or without 100 ng/ml doxycycline (n = 3). F Flow cytometric analysis to measure the percentage of cells expressing both differentiation markers (SOX17 and CXCR4) treated with XCT790 (XCT) in DE differentiation (n = 3). G mRNA expression of endoderm transcription factors FOXA2, SOX17, and CXCR4 in DE cells treated with XCT (n = 3). H mRNA expression of pluripotent markers OCT4 and SOX2 in DE cells treated with XCT (n = 12). I Flow cytometric analysis to measure the percentage of cells expressing both DE markers (SOX17 and CXCR4) treated with dynasore (DYNA) (n = 3). J mRNA expression of endoderm transcription factors FOXA2, SOX17, and CXCR4 in DE cells treated with dynasore (n = 3). K mRNA expression of pluripotent markers OCT4 and SOX2 in DE cells treated with dynasore (n = 6). The data of RT-qPCR are normalized to the mRNA level of untreated (control) DE cells. All data are shown as mean ± SD. *P < 0.05, **P < 0.01 and ***P < 0.001.
Fig. 4
Fig. 4. ATP is functionally involved in DE differentiation.
A Total intracellular ATP content of DE cells treated with dynasore (n = 3). B Percentage of CXCR4 and SOX17-positive cells in DE differentiation treated with dynasore and 1 mM ATP measured by flow cytometry (n = 3). C Flow cytometry analysis to measure the percentage of CXCR4 and SOX17-positive cells in DE differentiation treated with oligomycin (oligo) (n = 3). D Flow cytometry analysis to measure the percentage of CXCR4 and SOX17-positive cells in DE differentiation treated with IACS (n = 3). E mRNA expression of endoderm factors FOXA2 and CXCR4 in DE cells treated with IACS (n = 3). F Immunofluorescence microscopy of definitive endoderm cells for FOXA2 (green) and OCT4 (red) treated with 2 μM FCCP or 20 nM IACS. DAPI, blue. Scale bar = 400 μm. G Flow cytometry analysis to measure the percentage of CXCR4 and SOX17-positive cells in DE differentiation treated with FCCP (n = 3). H mRNA expression of endoderm factors FOXA2 and CXCR4 in DE cells treated with FCCP (n = 3). I Flow cytometric analysis of CXCR4- and SOX17-positive cells in DE differentiation treated with 1 μM oligomycin plus 0.5 mM ATP (n = 4). The data of RT-PCR are normalized to the mRNA level of untreated (control) DE cells. All data are shown as mean ± SD. ns, not significant. *P < 0.05, **P < 0.01 and ***P < 0.001.
Fig. 5
Fig. 5. The clearance of ROS can rescue the impaired DE differentiation due to mitochondrial dysfunction.
A Flow cytometric analysis to determine the changes of intracellular ROS level during DE differentiation treated with (DYNA) or without (CTRL) dynasore. The mean fluorescence intensity (MFI) of flow cytometry as shown on the right (n = 3). B Flow cytometry analysis of DE marker with the treatment of dynasore, and dynasore plus 3 mM NAC, respectively (n = 3). C Flow cytometry analysis of markers of DE cells when treated with ATN (n = 3). D The mRNA expression of FOXA2 during DE differentiation treated with 10 μM ATN. Data are normalized to the mRNA level of untreated (control) DE cells (n = 3). E Percentage of CXCR4-positive cells (flow cytometry) in the endoderm differentiation treated with 3 μM dynasore, 1 mM NAC or 0.5 mM ATP (n = 3). F Schematic illustration of mitochondrial regulation to DE differentiation. All data are shown as mean ± SD. *P < 0.05, **P < 0.01 and ***P < 0.001.
Fig. 6
Fig. 6. ATP and NAC can reduce the demand of activin A for DE differentiation.
A Percentage of CXCR4-positive cells (flow cytometry) in DE differentiation with 100 ng/ml or 10 ng/ml Activin A plus different concentrations of ATP (n = 7). B Percentage of CXCR4-positive cells (flow cytometry) in DE differentiation with 100 or 10 ng/ml Activin A plus 2 mM NAC (n = 7). C Immunofluorescence analysis of DE cells marked with FOXA2 (green) (nucleus, DAPI, blue; pluripotency, SOX2, red). Quantitative statistics were shown on the right (n = 5). Scale bar = 100 μm. D Immunofluorescence analysis of pancreatic progenitors marked with PDX1 (green) (nucleus, DAPI, blue). Quantitative statistics were shown on the bottom (n = 5). Scale bar = 100 μm. E The mRNA expression of representative genes of pancreatic progenitors including PDX1, NKX6.1, PTF1A, and HNF4A. Data are normalized to the mRNA level of the 100 ng/ml activin A group (n = 3). All data are shown as mean ± SD. ns, not significant. *P < 0.05, **P < 0.01 and ***P < 0.001.

Similar articles

Cited by

References

    1. Khacho M, Harris R, Slack RS. Mitochondria as central regulators of neural stem cell fate and cognitive function. Nat Rev Neurosci. 2019;20:34–48. - PubMed
    1. Sun X, St John JC. The role of the mtDNA set point in differentiation, development and tumorigenesis. Biochem J. 2016;473:2955–71. - PubMed
    1. Diebold LP, Gil HJ, Gao P, Martinez CA, Weinberg SE, Chandel NS. Mitochondrial complex III is necessary for endothelial cell proliferation during angiogenesis. Nat Metab. 2019;1:158–71. - PMC - PubMed
    1. Gaspar JA, Doss MX, Hengstler JG, Cadenas C, Hescheler J, Sachinidis A. Unique metabolic features of stem cells, cardiomyocytes, and their progenitors. Circ Res. 2014;114:1346–60. - PubMed
    1. Favaro G, Romanello V, Varanita T, Andrea Desbats M, Morbidoni V, Tezze C, et al. DRP1-mediated mitochondrial shape controls calcium homeostasis and muscle mass. Nat Commun. 2019;10:2576. - PMC - PubMed