. 2022 Feb 17;13(1):910.
doi: 10.1038/s41467-022-28605-0.

A cattle graph genome incorporating global breed diversity

Affiliations

A cattle graph genome incorporating global breed diversity

A Talenti et al. Nat Commun. .

Erratum in

  • Author Correction: A cattle graph genome incorporating global breed diversity.
    Talenti A, Powell J, Hemmink JD, Cook EAJ, Wragg D, Jayaraman S, Paxton E, Ezeasor C, Obishakin ET, Agusi ER, Tijjani A, Amanyire W, Muhanguzi D, Marshall K, Fisch A, Ferreira BR, Qasim A, Chaudhry U, Wiener P, Toye P, Morrison LJ, Connelley T, Prendergast JGD. Talenti A, et al. Nat Commun. 2022 May 23;13(1):2983. doi: 10.1038/s41467-022-30372-x. Nat Commun. 2022. PMID: 35606359 Free PMC article. No abstract available.

Abstract

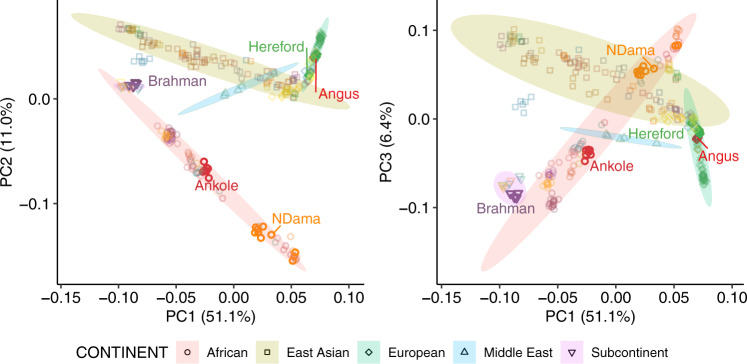
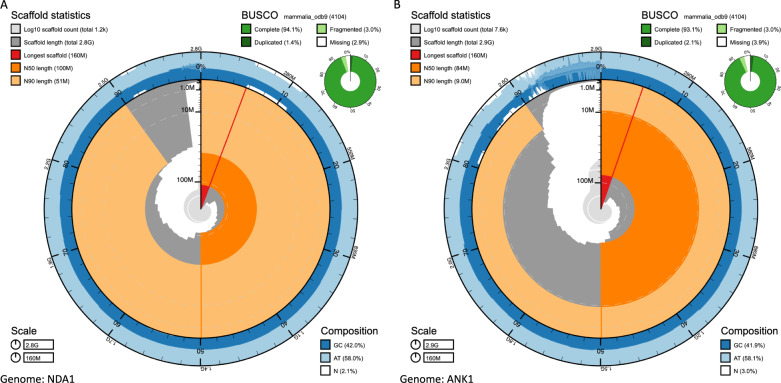
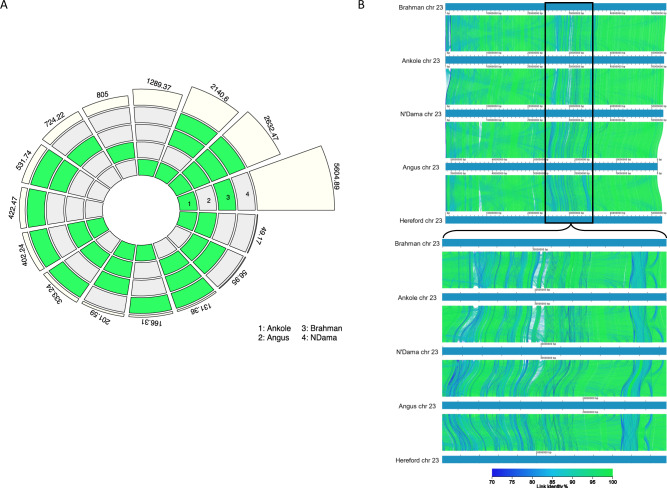
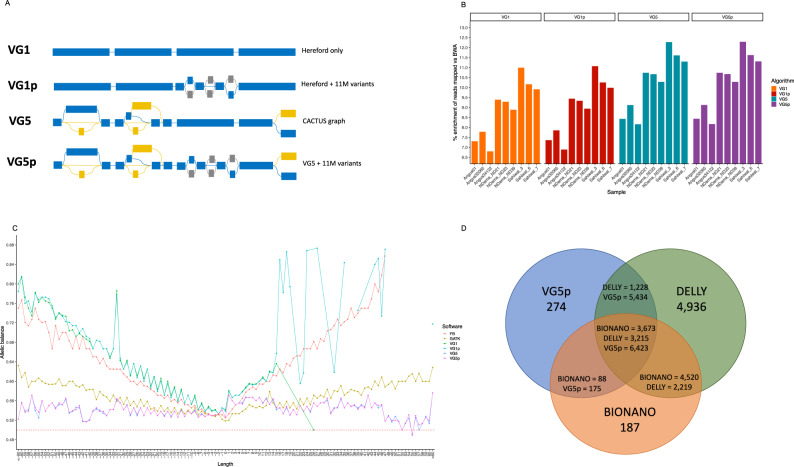
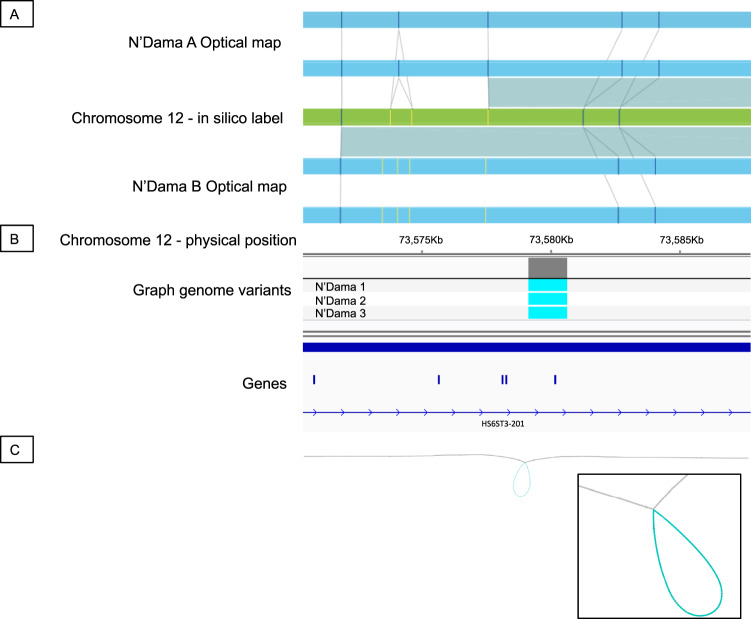
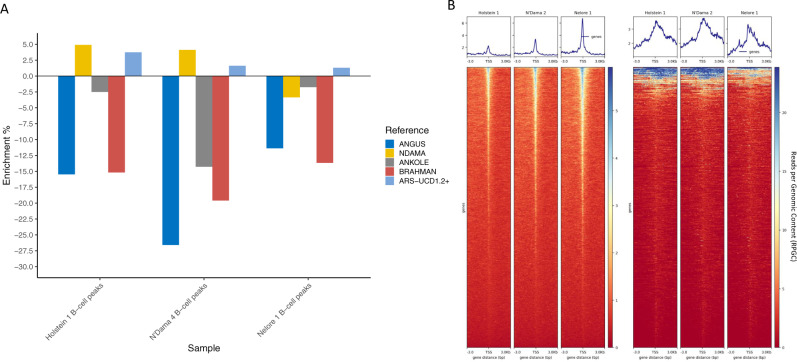
Despite only 8% of cattle being found in Europe, European breeds dominate current genetic resources. This adversely impacts cattle research in other important global cattle breeds, especially those from Africa for which genomic resources are particularly limited, despite their disproportionate importance to the continent's economies. To mitigate this issue, we have generated assemblies of African breeds, which have been integrated with genomic data for 294 diverse cattle into a graph genome that incorporates global cattle diversity. We illustrate how this more representative reference assembly contains an extra 116.1 Mb (4.2%) of sequence absent from the current Hereford sequence and consequently inaccessible to current studies. We further demonstrate how using this graph genome increases read mapping rates, reduces allelic biases and improves the agreement of structural variant calling with independent optical mapping data. Consequently, we present an improved, more representative, reference assembly that will improve global cattle research.


Conflict of interest statement

The authors declare no competing interests.

Figures

Fig. 1
Fig. 1. Principal component analysis of the 294 cattle.
The positions of the populations of origin of the five assemblies considered in this study are shown. The source data are provided with the paper.
Fig. 2
Fig. 2. Snail plots of the N’Dama (NDA1) and Ankole (ANK1) genome assemblies.
Key metrics are shown for the (A) N’Dama and (B) Ankole genomes such as the longest scaffold (red vertical line), N50 (orange track), N90 (light orange track), GC content (external blue track) and BUSCO scores (outer circular pie chart in green). The region of elevated N content in the N’Dama assembly corresponds to a 5 Mb gap in one of the contigs matching a region of generalised low identity in all of the five assemblies (Supplementary Fig. 4). Even though this region contained an unfilled gap we observe that the regions flanking the gap align to directly contiguous portions of the genome in other assemblies, and therefore that the gap in this region is potentially smaller than represented here.
Fig. 3
Fig. 3. Comparison of genomic content across the genomes.
A High-quality (NOVEL) sequence specific to, or shared among, each non-reference genome. Numbers represent the kilobases of non-Hereford sequence associated with the set of genomes defined by the group(s) highlighted in green. Each genome is indicated by a number (1 = Ankole, 2 = Angus, 3 = Brahman and 4 = N’Dama); B Multiple genome alignments of the MHC region on chromosome 23 generated with AliTV (v1.0.6). The plot represents the shared sequences among the different genomes; blue to green segments are representative of higher to lower similarity (100 to 70% respectively); the enlarged region is the MHC region, which shows a large amount of variation between the assemblies.
Fig. 4
Fig. 4. Graph genome descriptions and their performances.
A A cartoon representation of the four types of graph genomes considered (the linear VG1, VG1 expanded with 11 M short variants (VG1p), the CACTUS VG5 graph and the CACTUS graph expanded with the 11 M short variants (VG5p)). Regions indicated in blue are regions coming from the backbone sequence, those in grey are the short variants from Dutta et al. (2020), and in yellow the variants derived from the CACTUS graph; B the percent enrichment of reads mapped by vg (primary axis) using the different graphs over the bwa mem linear mapper; and C the allelic balance for the linear callers FreeBayes and GATK HaplotypeCaller compared with vg call, showing how the latter reduces the allelic bias for large variants. For other versions of this plot looking at different sets of known and novel variants see Supplementary Note 3; and D the intersection of structural variants longer than 500 bp called using the VG5p graph (blue), Delly V2 (green) and the Bionano optical mapping (orange), showing how most variants called with vg are also confirmed using one of the other methods. Note an SV called by one method may overlap more than one SV called by a different method. The source data for panels (B), (C) and (D) are provided with the paper.
Fig. 5
Fig. 5. Example of an insertion in the N’Dama relative to the Hereford reference.
The insertion was detected A in both Kenyan N’Dama OM samples as represented by an increase in the distance between labels (vertical lines) on each bionano haplotype (blue rectangles) over that expected given the labels’ in silico locations in the Hereford reference (green rectangle). B This SV was identified as homozygous in all three Nigerian N’Dama resequenced genomes when called against the graph genome. C A Bandage representation of the graph genome in this region showing the large structural variant (blue loop) in the Hereford genome (grey line).
Fig. 6
Fig. 6. ATAC-seq analyses results.
A Enrichment or depletion of the number of ATAC-seq peaks called in the different assemblies with respect to the number called in ARS-UCD1.2, showing more peaks were called using the expanded ARS-UCD1.2+ genome in all samples; and B showing the enrichment around the TSS of both the ARS-UCD1.2 annotated genes (left three heatmaps) and of the 923 features predicted by Augustus in the novel contigs (right). The source data for panel (A) are provided with the paper.

References

    1. De Boer H. Cattle genetic resources. Livest. Prod. Sci. 1991;29:256–258. doi: 10.1016/0301-6226(91)90072-X. - DOI
    1. Felius M, et al. On the breeds of cattle-Historic and current classifications. Diversity. 2011;3:660–692. doi: 10.3390/d3040660. - DOI
    1. Ajmone-Marsan P, Lenstra JA, Fernando Garcia J, The Globaldiv Consortium. On the origin of cattle: how aurochs became domestic and colonized the world Attenuation of the inflammatory phenomena in the transition period of dairy cows View project Climate Genomics for Farm Animal Adaptation View project. Evol. Anthropol. 2010;19:148–157. doi: 10.1002/evan.20267. - DOI
    1. Rosen BD, et al. De novo assembly of the cattle reference genome with single-molecule sequencing. GigaScience. 2020;9:1–9. doi: 10.1093/gigascience/giaa021. - DOI - PMC - PubMed
    1. Sanchez M-P, et al. Within-breed and multi-breed GWAS on imputed whole-genome sequence variants reveal candidate mutations affecting milk protein composition in dairy cattle. Genet. Sel. Evol. 2017;49:68. doi: 10.1186/s12711-017-0344-z. - DOI - PMC - PubMed

Publication types