Observational Study
. 2022 Feb 17;13(1):945.
doi: 10.1038/s41467-022-28593-1.

Stroke induces disease-specific myeloid cells in the brain parenchyma and pia

Affiliations
Observational Study

Stroke induces disease-specific myeloid cells in the brain parenchyma and pia

Carolin Beuker et al. Nat Commun. .

Abstract

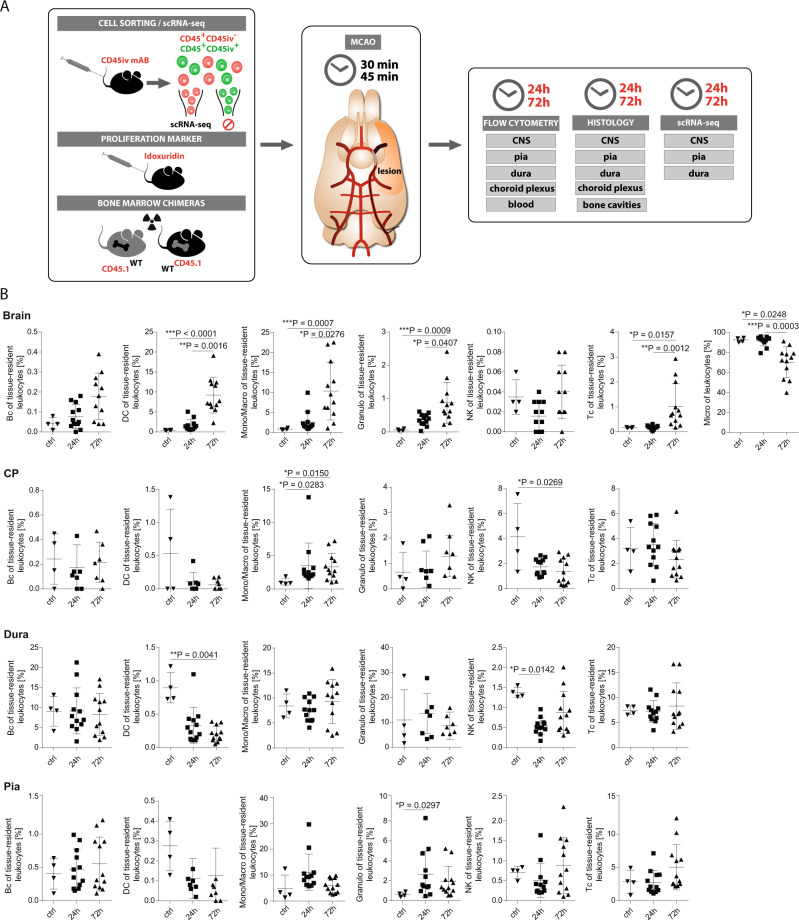
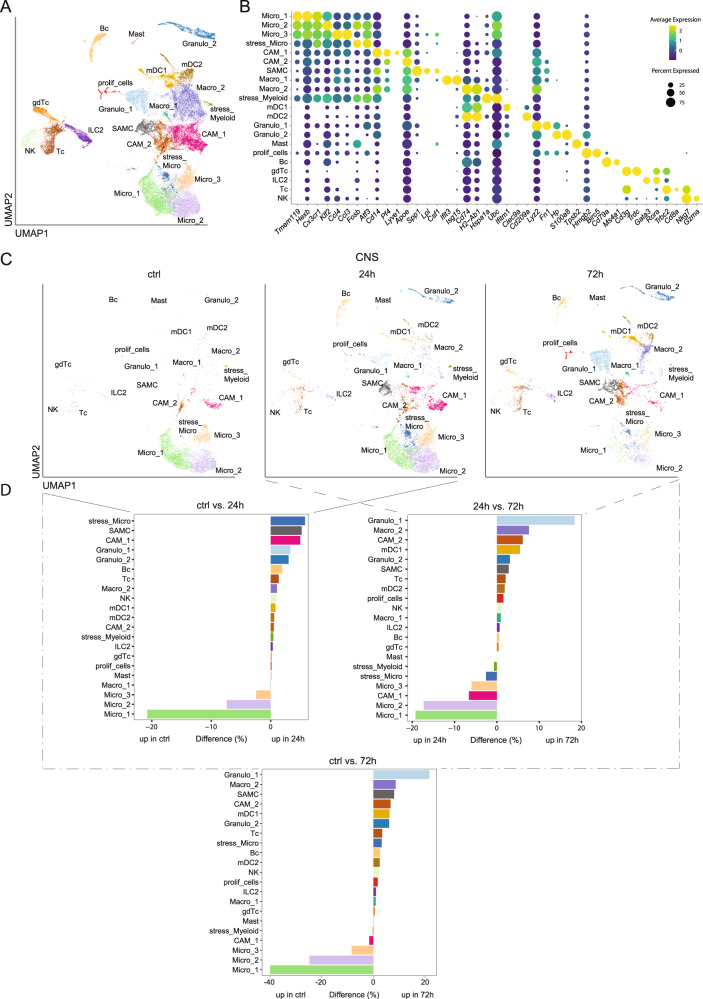
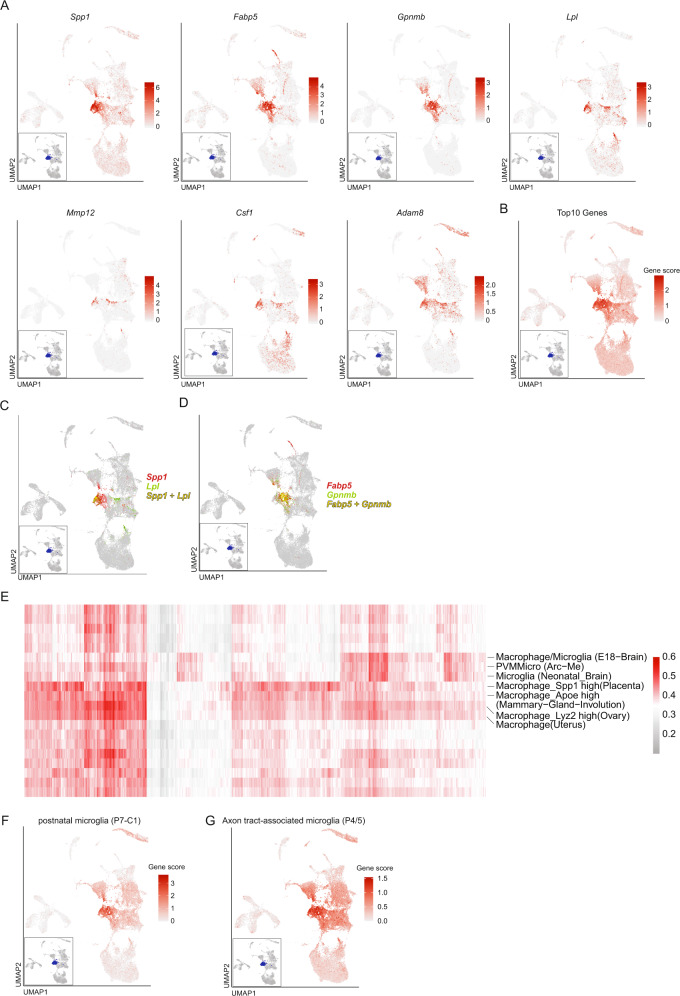
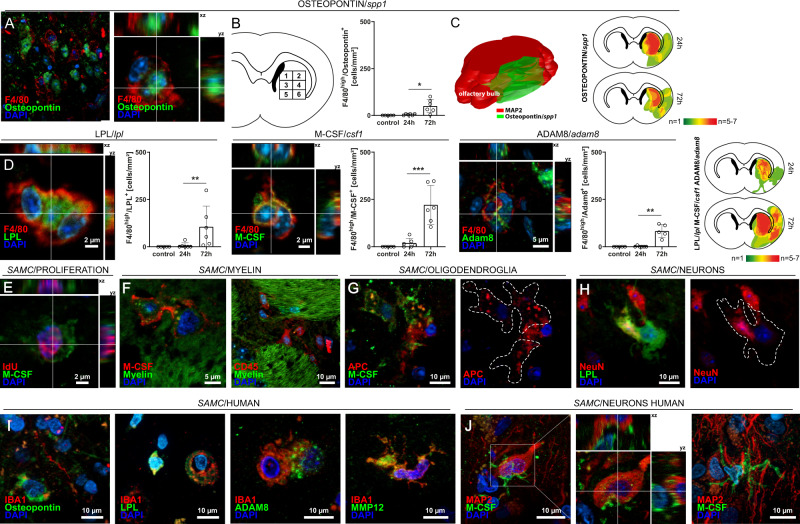
Inflammation triggers secondary brain damage after stroke. The meninges and other CNS border compartments serve as invasion sites for leukocyte influx into the brain thus promoting tissue damage after stroke. However, the post-ischemic immune response of border compartments compared to brain parenchyma remains poorly characterized. Here, we deeply characterize tissue-resident leukocytes in meninges and brain parenchyma and discover that leukocytes respond differently to stroke depending on their site of residence. We thereby discover a unique phenotype of myeloid cells exclusive to the brain after stroke. These stroke-associated myeloid cells partially resemble neurodegenerative disease-associated microglia. They are mainly of resident microglial origin, partially conserved in humans and exhibit a lipid-phagocytosing phenotype. Blocking markers specific for these cells partially ameliorates stroke outcome thus providing a potential therapeutic target. The injury-response of myeloid cells in the CNS is thus compartmentalized, adjusted to the type of injury and may represent a therapeutic target.


Conflict of interest statement

The authors declare no competing interests.

Figures

Fig. 1
Fig. 1. Stroke affects leukocytes in a compartment-specific fashion.
A Scheme of the experimental approach. Middle cerebral artery occlusion (MCAO) (or sham-operated, as controls) was induced in wild-type (WT) mice for 30 or 45 min and mice were sacrificed 24 h or 72 h later (post ischemia). Prior to stroke induction, fluorophore-labeled CD45 antibody (mAb) was injected intravenously (iv). After 5 min, mice were intracardially perfused and CD45+-leukocytes negative for the CD45iv antibody (CD45+CD45iv) then defined as tissue-resident leukocytes were flow-sorted from central nervous system (CNS) parenchyma, pia, dura, choroid plexus (CP) and blood, and analyzed by flow cytometry and single-cell RNA-sequencing (scRNA-seq). Tissue sections were analyzed by immunohistochemistry. B Frequencies of Bc (B cells), DC (dendritic cells), Mono/Macro (Monocytes/Macrophages), Granulo (Granulocytes), NK (Natural killer cells), Tc (T cells) and Micro (Microglia) of tissue-resident leukocytes isolated out of the Brain, CP, Dura and Pia from sham-operated mice without stroke (ctrl), from mice 24 h post ischemia (24 h) and from mice 72 h post ischemia (72 h) analyzed by Flow Cytometry. n = 4 for ctrl, n = 12 for 24 h and 72 h. Data are presented as mean values ± SD. Statistical significance was tested using Kruskal–Wallis test with Dunn’s post test. Not significant = not shown, *P ≤ 0.05, **P ≤ 0.01, ***P ≤ 0.001. Source data for B are provided as a Source Data file.
Fig. 2
Fig. 2. Single-cell RNA-sequencing identifies a unique stroke-associated myeloid cell (SAMC) population.
A Merged Uniform Manifold Approximation and Projection (UMAP) plot representing 21 color-coded cell clusters identified in the combined single-cell transcriptomes obtained from brain, dura and pia of sham (ctrl) and MCAO mice (24 h and 72 h post stroke). Cluster names were manually assigned. B Dot plot of selected marker genes characterizing the clusters shown in A. C UMAP plots of single-cell transcriptomes obtained from brain of sham (ctrl) and MCAO mice, 24 h (24 h) and 72 h (72 h) post stroke. D Bi-directional histograms depicting differences in relative cluster abundance between MCAO (24 h and 72 h post ischemia) and sham (ctrl) samples as shown in C. Differences are calculated as: percentage of all cells in the respective stroke sample minus percentage of all cells in the control sample. Cluster annotations and cluster coloring are consistent between all panels. Abbreviation key: Bc B cell, CAM central nervous system-associated macrophages, CNS central nervous system, gdTc γδ T cells, granulo granulocytes, ILC2 innate lymphoid cells type 2; Macro macrophage, Mast mast cells, mDC myeloid dendritic cell, Micro microglia, NK natural killer cells, proli_cells proliferating cells, SAMC stroke-associated myeloid cells, stress_Micro stressed Microglia; stress_Myeloid, stressed Myeloid cells; Tc, T cells. Source data for D are provided as a Source Data file.
Fig. 3
Fig. 3. The stroke-associated myeloid cell (SAMC) phenotype partially resembles early embryonic microglia and upregulates genes of lipid metabolism.
A Feature Plots of selected marker genes specifically enriched (Methods) in the SAMC cluster; termed stroke-associated myeloid cells in the text. B Gene score feature plot of the top 10 genes specifically expressed in the SAMC cluster at 24 h post-ischemia. C Dual color feature plot of Spp1 and Lpl. D Dual color feature plot of Fabp5 and Gpnmb. E All cells assigned to the SAMC cluster were submitted to the mouse cell atlas (MCA) and compared with public single-cell datasets. Each column represents one cell, each row represents one MCA reference cell type. Colors indicate Pearson correlation coefficient between the top MCA cell types and the submitted cells. Labeled are reference datasets with a high Pearson correlation across multiple cells. F Gene score feature plot using the Top25 marker genes of postnatal day 7 microglia cells (P7-C1) from. G Gene score feature plot using the Top30 marker genes of axon tract-associated microglia cells (P4/5) from.
Fig. 4
Fig. 4. Top markers of stroke-associated myeloid cells (SAMCs) are confirmed within infarcted brain parenchyma in rodents and human stroke patients.
A Middle cerebral artery occlusion (MCAO) was induced in C57BL/6 mice for 45 min. Coronal (approx. bregma 0–1 mm) and transversal cryosections were prepared of 24 and 72 hours post-MCAO brains and were co-stained for F4/80 and Osteopontin (Spp1). Overview images of the lesioned striatum (str) and the corpus callosum (cc) and corresponding z-stacks are shown. B The density of Osteopontin+-cells was quantified in eight defined regions 1–6 (covering most of the middle cerebral artery flow area at bregma, see numbered rectangles) generated from brains post 24 h (n = 6) and post 72 h (n = 5). Data are presented as mean values ± SEM (two-sided t-test, *p = 0.0106). C Heatmaps were generated from brains post 24 h (n = 6) and post 72 h (n = 5) (two-sided t-test, *p < 0.05). 3D heatmap of Osteopontin expression was constructed by combining nine consecutive transversal sections of 72 h post-MCAO brains (n = 3) using Free-D software. Neuronal-marker MAP2 was used to define lesion borders. D Sections of 24 h and 72 h post-MCAO brains as in A were co-stained for F4/80 together with LPL, M-CSF, and ADAM8. Representative Z-stacks are shown. The density of positive cells was quantified within the defined sections 1–6 of 24 h (n = 6) and 72 h (n = 4) post-MCAO brains. Plots in B and D are representative of n = 4 stainings (sham), n = 6 stainings (24 h post MCAO) and n = 4 stainings (72 h) (two-sided t-test, **p < 0,01, ***p < 0.001; LPL/F4/80: p = 0.0087; M-CSF/F4/80: p = 0.0008; ADAM8/F4/80: p = 0.0043). Data are presented as mean values ± SEM. E Mice (n = 3) were injected with idoxuridine (IdU) twice 48 h and 24 h prior to induction of MCAO and IdU was co-stained with M-CSF. F Sections as in A were co-stained with FluoroMylein and SAMC-marker M-CSF, showing potential myelin phagocyting by CD45- and M-CSF-expressing cells. G M-CSF-expressing cells potentially phagocyting APC+-oligodendroglia. H LPL+-cell enclosing a NeuN+-neuron within the lesioned striatum. I Representative immunofluorescence images and corresponding z-stacks of SAMC-marker Osteopontin, LPL, M-CSF, Adam8, and MMP12 co-stained with microglial/monocyte marker IBA1 within the infarcted tissue of stroke patients (representative images of n = 5 patients). J Human stroke sections stained for SAMC-marker M-CSF and neuronal-marker MAP2 showing potential neuronal phagocyting by M-CSF+ cells. Source data for B and D are provided as a Source Data file.
Fig. 5
Fig. 5. Specific SAMC blocking treatment influences stroke outcome and immune cell response.
A, E Schematic illustration of A M-CSF antibody (CD115) and E MMP-12 inhibitor (MMP408) application over time. Middle cerebral artery occlusion (MCAO) (or sham-operated, as controls) was induced in mice for 45 min. Mice were either injected with anti-CSF-1R mAb (CD115, M-CSF antibody) intraperitoneally at doses of 400 μg/mouse in 100 μl PBS or perorally administered with MMP408 (MMP-12 inhibitor) at doses of 750 μg/mouse in 100 μl PBS 3, 24, and 48 h after induction of MCAO. Functional outcome was assessed with foot fault performances 24, 48, and 72 h after MCAO. Seventy-two hours post-ischemia mice were intracardially perfused and tissue sections were analyzed by immunohistochemistry. B, F Mean infarct volumes were calculated from coronal cryosections (15–20) of mice treated with M-CSF antibody or MMP-12 inhibitor in comparison to vehicle-treated animals collected at 300 µm intervals and stained with toluidine blue using ImageJ software at 72 h after MCAO (two-sided t-test, *p < 0.05, n = 8 per group; M-CSF antibody: p = 0.0360; MMP-12 inhibitor: p = 0.3131). Median infarct volumes were presented as box plots. The lines inside the boxes denote the medians. The whiskers of box plots: 10–90%. The behavioral performances of the mice in each group were measured with the foot fault test at 24, 48, and 72 h post ischemia (p < 0.05, two-sided t-test, n = 9 per group). Data are presented as mean values ± SEM. C, G Quantification of LPL+/F4/80+,M-CSF+/F4/80+ and ADAM8 + /F4/80+ cells at 72 h post stroke induction after blocking therapy with SAMC-specific markers M-CSF and MMP12 in comparison to vehicle-treated animals (*p < 0.05, **p < 0.01, two-sided t-test, n = 9 per group). M-CSF antibody: LPL + /F4/80 + : p = 0.0134; M-CSF + /F4/80 + : p = 0.051;ADAM8 + /F4/80 + p = 0.0253. Median cell counts were presented as box plots. The lines inside the boxes denote the medians. The whiskers of box plots: 10–90%. D, H The density of Perilipin-2 and BODIPY positive cells was quantified on cryosections at bregma 0–1 mm 72 h post-MCAO (*p < 0.05, two-sided t-test, n = 9 per group). Cells were quantified within the region of interest (ROI: striatum of the ischemic hemisphere, measuring 0.256 mm2) on coronal sections at 20x magnification, and heatmaps were generated from brains post 72 h (n = 8) (two-sided t-test, *p < 0.05). Median cell counts were presented as box plots. The lines inside the boxes denote the medians. The whiskers of box plots: 10–90%. Source data for B, C, D, F, G, and H are provided as a Source Data file.

References

    1. Engelhardt B, Vajkoczy P, Weller RO. The movers and shapers in immune privilege of the CNS. Nat. Immunol. 2017;18:123–131. doi: 10.1038/ni.3666. - DOI - PubMed
    1. Aspelund A, et al. A dural lymphatic vascular system that drains brain interstitial fluid and macromolecules. J. Exp. Med. 2015;212:991–999. doi: 10.1084/jem.20142290. - DOI - PMC - PubMed
    1. Louveau A, et al. Structural and functional features of central nervous system lymphatic vessels. Nature. 2015;523:337–341. doi: 10.1038/nature14432. - DOI - PMC - PubMed
    1. Van Hove H, et al. A single-cell atlas of mouse brain macrophages reveals unique transcriptional identities shaped by ontogeny and tissue environment. Nat. Neurosci. 2019;22:1021–1035. doi: 10.1038/s41593-019-0393-4. - DOI - PubMed
    1. Jordão, M. J. C. et al. Single-cell profiling identifies myeloid cell subsets with distinct fates during neuroinflammation. Science363, eaat7554 (2019). - PubMed

Publication types

MeSH terms