Observational Study
. 2022 Feb 17;13(1):925.
doi: 10.1038/s41467-022-28523-1.

T-cell dysfunction in the glioblastoma microenvironment is mediated by myeloid cells releasing interleukin-10

Affiliations
Observational Study

T-cell dysfunction in the glioblastoma microenvironment is mediated by myeloid cells releasing interleukin-10

Vidhya M Ravi et al. Nat Commun. .

Abstract

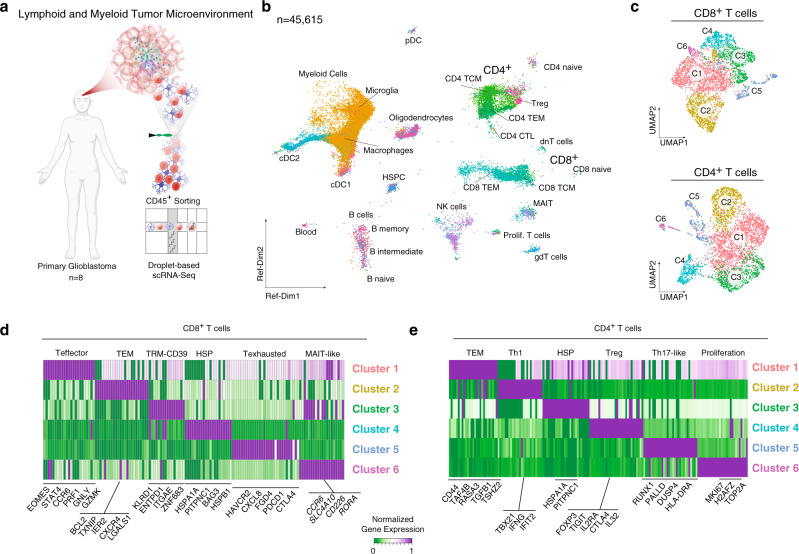
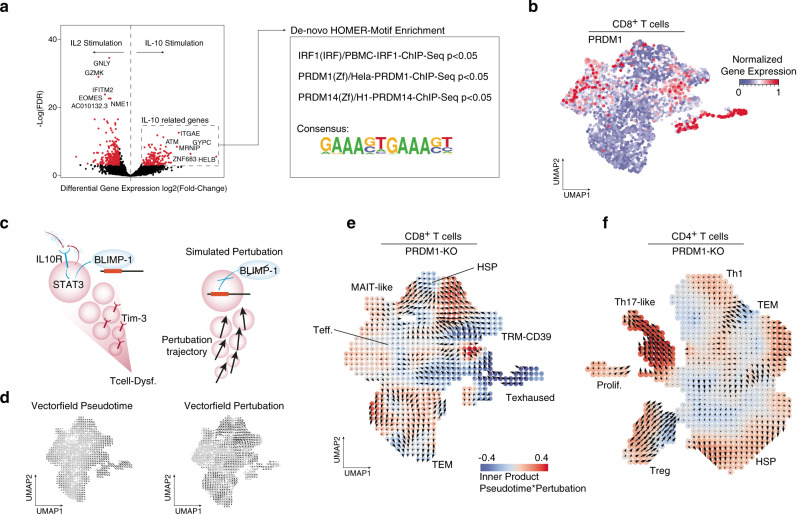
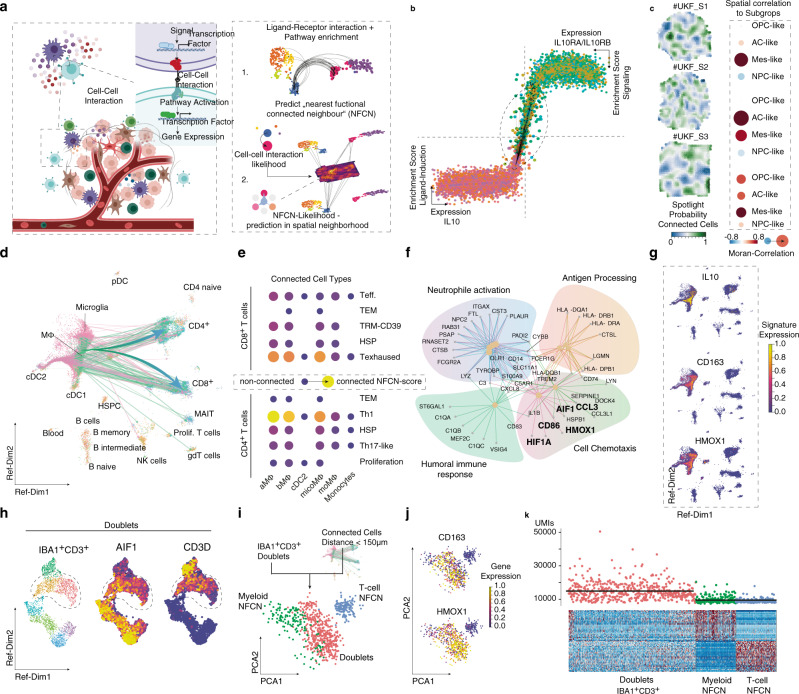
Despite recent advances in cancer immunotherapy, certain tumor types, such as Glioblastomas, are highly resistant due to their tumor microenvironment disabling the anti-tumor immune response. Here we show, by applying an in-silico multidimensional model integrating spatially resolved and single-cell gene expression data of 45,615 immune cells from 12 tumor samples, that a subset of Interleukin-10-releasing HMOX1+ myeloid cells, spatially localizing to mesenchymal-like tumor regions, drive T-cell exhaustion and thus contribute to the immunosuppressive tumor microenvironment. These findings are validated using a human ex-vivo neocortical glioblastoma model inoculated with patient derived peripheral T-cells to simulate the immune compartment. This model recapitulates the dysfunctional transformation of tumor infiltrating T-cells. Inhibition of the JAK/STAT pathway rescues T-cell functionality both in our model and in-vivo, providing further evidence of IL-10 release being an important driving force of tumor immune escape. Our results thus show that integrative modelling of single cell and spatial transcriptomics data is a valuable tool to interrogate the tumor immune microenvironment and might contribute to the development of successful immunotherapies.


Conflict of interest statement

D.H.H. received reimbursement of travel expenses from 10X and the MILO laboratory is part of the 10X VEP program. The authors declare no competing interests.

Figures

Fig. 1
Fig. 1. Cluster and cell type analysis of lymphoid cells in glioblastomas.
a Illustration of the workflow: tissue specimens for scRNA-sequencing were obtained from eight donors diagnosed with primary glioblastoma. b Weighted mutual neighbor (WNN) data integration and dimensional reduction using reference UMAP, was used to determine the cell types. c Isolated and clustered CD8+ (upper UMAP) and CD4+ (bottom UMAP) cells are indicated by colors. d, e Heatmaps of marker genes (top 30) across clusters from CD8+ cells (right panel) and CD4+ cells (left panel). T effector T effector cells, TEM T effector memory, TRM tissue-resident memory cells, TCL T cell lymphoma, TCM central memory, gdT gamma-delta T cells, MAIT mucosa-associated T cells, dnT double-negative T cells, Treg regulatory T cells, pDC progenitor dendritic cells, cDC conventional dendritic cell, NK natural killer cells, Th1 T helper cells, HSP heat shock protein cell type, CTL cytotoxic T-cells, HSPC hematopoietic stem and progenitor cell.
Fig. 2
Fig. 2. Pseudotemporal analysis of T cell differentiation.
a, b UMAP dimensional reduction for CD8+ (left) and CD4+ T cells. Colors indicate the enrichment of T cell exhaustion. Cluster-wise enrichment analysis is illustrated by points, which are sized and colored according to their enrichment score for T cell exhaustion. c For CD8+ T cells: The two identified terminal states (indicated by colors, names S1-S2) are presented using a two-dimensional subway plot. Terminally exhausted T cells fall under state 1 (S1). d For CD8+ T cells: Line plots with pseudotime (from S0 to S1 state) at the x-axis and enrichment scores of different T cell states on the y-axis (upper plot). At the bottom, the RNA-velocity from S0 to S1 state is illustrated (dashed line) with increasing velocity-pseudotime on the y-axis. Additionally, IL-10 and TGFb response is shown (red and blue lines). e Similar visualization (c) from CD4+ T cells. These cells reveal a more complex architecture mainly spanning the three major cell states from regulatory T cells (branch S2), TEM/Stress (Branch S1), and Th17 (Branch S3/S4). f Similar representation (d) for CD4+ T cells with enrichment for T cell states (upper plot) and velocity and IL-10/TGFb response (bottom plot).
Fig. 3
Fig. 3. Perturbation simulation of IL-10 response in T cells.
a Volcano plot the differential gene expression of IL-2 and IL-10 stimulated T cells. Significantly expressed genes (IL-10 related genes) are analyzed by HOMER (Software for motif discovery and next-generation sequencing analysis) for de novo motif enrichments. The top three candidates are shown in the right box. b UMAP representation of CD8+ T cells expressing the PRDM1 gene. c Illustration of the hypothesis of PRDM1 perturbation. d Vector field projection of the development trajectories (RNA-velocity) (left) and the perturbation trajectories (right) in CD8+ T cells. e CD8+ T cells: Vector field projection of the inferred perturbation (PRDM1), colors indicate the inner product from both development and perturbation trajectories. f Similar presentation as (e) from CD4+ T cells.
Fig. 4
Fig. 4. Spatial analysis of T cell distribution in glioblastomas.
a Illustration of the workflow using spatially resolved transcriptomics (stRNA-seq). b Histological images (H&E), upper plot, and surface plots of the gene set enrichment of the mesenchymal-like signature (n = 3 patients) c, d Spatial correlation analysis with Moran statistics (R2-values) between the GBM subtypes and CD8+ T cell clusters (c) and CD4+ T cells (d). Point size and color indicate spatial correlation. e, f Line plots illustrate the distance between the CD8+ clusters (TRM-CD39 (e) and T exhausted (f)) and tumor subtypes. The x-axis represents the cell type probability computed by gene set enrichment analysis of defined gene sets based on subtype. The y-axis represents the spatial distance to defined T cell clusters based on ranked SPOTlight probabilities. g Surface plot of the IFN-gamma and CCL2 response in the S3 tumor sample. h Imaging mass cytometry (IMC) data from a GBM sample with annotated cell types. i Spatial distance between tumor subtypes and exhausted CD8+ cells from IMC data.
Fig. 5
Fig. 5. Neighborhood analysis of myeloid–lymphoid interactions.
a Workflow exploring cell–cell interactions using two approaches: (1) Predict functional neighbors based on defined ligand-receptor interaction. (2) Validation in spatial transcriptomic datasets. b Scatter-cell–cell interaction plot from the “Nearest Functionally Connected Neighbor” algorithm (NFCN) as explained in supplementary results. c Spatial alignment of highly connected cell pairs from the NFCN analysis, right side. Spatial correlation analysis is illustrated at the left side. The juxtaposition of connected cells and the GBM subtypes was quantified using Moran statistics. Cells are colored accordingly to the myeloid/T cell cluster of origin. d 2D UMAP presentation of the connected cells. Arrows indicate the most likely cell connection between the myeloid and T cell compartment. e Dot plot of cluster-wise connectivity of myeloid (on the bottom) and T cell clusters (right side). Color and size indicate the NFCN-score. f Gene set enrichment analysis of top five enriched pathways in highly connected myeloid cells. g 2D UMAP representation with gene expression. h Doublet analysis of mixed CD3+/IBA1+ positive doublets. The dimensional reduction illustrates the identified doublets. The highlighted doublet population demonstrated the CD3+/IBA1+ positive doublets. i Fusion of the connected myeloid and lymphoid cells illustrated the gene expression similarity compared to the CD3+/IBA1+ positive doublets. j Gene expression of the cells/doublets presented in i. k Heatmap of the doublets (left) and single cells (right). The UMIs confirmed the status as single cell or doublet. Signature gene expression of either myeloid or lymphoid cell was both expressed in the doublets.
Fig. 6
Fig. 6. Functional modeling of T cell response in human brain slices.
a, b Illustration of the workflow using neocortical slice cultures. c Density plots to quantify the spatial distance between HMOX+ and HMOX IBA1+ myeloid cells and tumor (upper plot) and T cells (bottom). P values are determined by non-paired t-test statistics after proving the normal distribution. d Immunostainings of IBA1 (Macrophages and Microglia) in magenta and HMOX1 in cyan, tumor cells are depicted in gray. In the upper panel, the control set with no myeloid cell depletion (M+) is shown, the bottom panel contains the myeloid cell-depleted sections. The experiments and stainings were repeated at least six times for each condition. e Two examples of the reconstruction of cellular relationships. Each point represents a cell as indicated by the legend at the bottom. Lines in orange represent a myeloid-T cell connection (with a distance lower than 100 µm). Tumor-myeloid relationships are illustrated in purple (with a distance lower than 100 µm). The dots of the connected myeloid cells show the expression of HMOX1 by the inner color filling. f ELISA measurements of IL-10 and IL-2. P values are determined by one-way ANOVA (c, e, f, j) adjusted by Benjamini–Hochberg (c, e, f, j) for multiple testing. Data were given as mean ± standard deviation. g Scatterplot of GZMB (y-axis) versus TIM3 protein level (x-axis). Each dot represents a segmented T cell from different experimental conditions as indicated by the legend at the right. Right part: A quantification of the data. P values are determined by one-way ANOVA. h Immunostainings of T cells (CSFE-Tagged, in red) and GZMB, a marker of T cell activation (green). The experiments and stainings were repeated at least six times for each condition.
Fig. 7
Fig. 7. JAK-STAT inhibition and T cell response in glioblastoma.
a Timeline of the treatment of our JAK-inhibition GBM case report. b, c Immunohistochemistry of immune marker and its quantification (c), white: pre-therapy, gray: post-therapy, P values are determined by one-way ANOVA. d Reference UMAP of all T cells (gray) and the JAK-treated patient. A doughnut plot of CD8+/CD4+ positive cells is illustrated on the right side. e, f Mapping of CD8+ (e) and CD4+ (f) from the JAK-treated patients to the T cell landscape (left UMAP plot). A quantification is illustrated on the right side. Typical marker gene expression of T effector (GZMB) and exhausted cells (PDCD1) are illustrated at the bottom. g Clinical follow-up of the patient with T1-weighted contrast-enhanced MR-images. n.s “not significant”.

References

    1. Darmanis S, et al. Single-cell RNA-seq analysis of infiltrating neoplastic cells at the migrating front of human glioblastoma. Cell Rep. 2017;21:1399–1410. - PMC - PubMed
    1. Woroniecka K, et al. T-cell exhaustion signatures vary with tumor type and are severe in glioblastoma. Clin. Cancer Res. 2018;24:4175–4186. - PMC - PubMed
    1. Chen Z, Hambardzumyan D. Immune microenvironment in glioblastoma subtypes. Front. Immunol. 2018;9:1004. - PMC - PubMed
    1. Sankowski R, et al. Mapping microglia states in the human brain through the integration of high-dimensional techniques. Nat. Neurosci. 2019;22:2098–2110. - PubMed
    1. Hara T, et al. Interactions between cancer cells and immune cells drive transitions to mesenchymal-like states in glioblastoma. Cancer Cell. 2021;39:779–792.e11. - PMC - PubMed

Publication types

MeSH terms