. 2022 Feb 17;13(1):946.
doi: 10.1038/s41467-022-28639-4.

Prognostic tools and candidate drugs based on plasma proteomics of patients with severe COVID-19 complications

Affiliations

Prognostic tools and candidate drugs based on plasma proteomics of patients with severe COVID-19 complications

Maryam A Y Al-Nesf et al. Nat Commun. .

Abstract

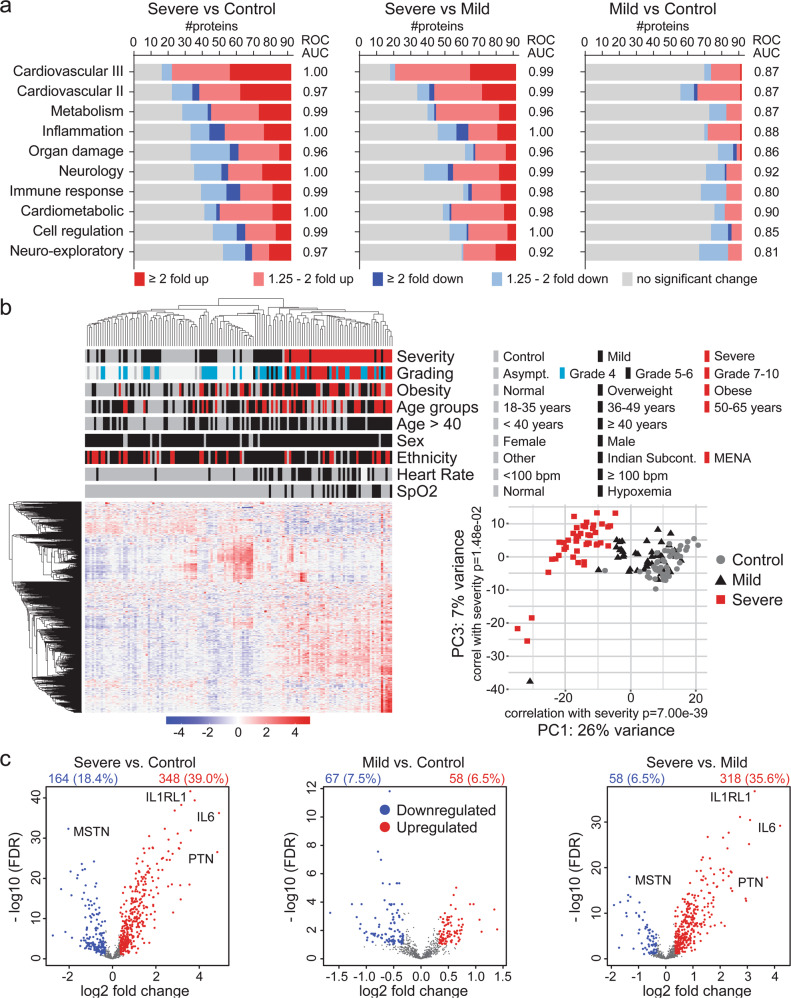
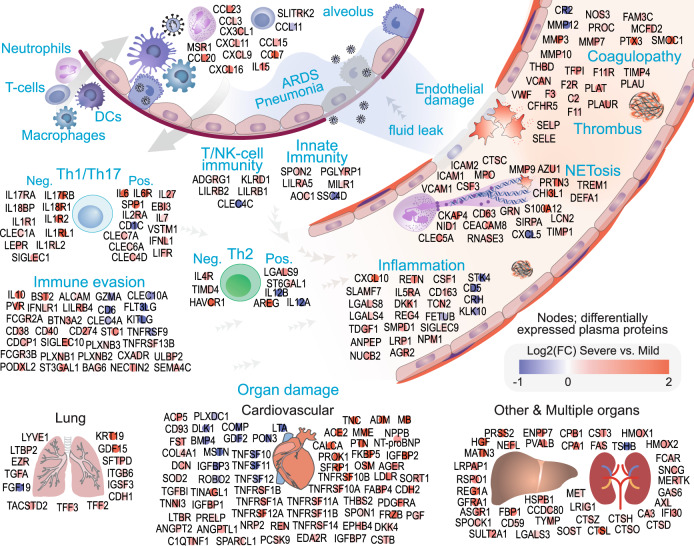
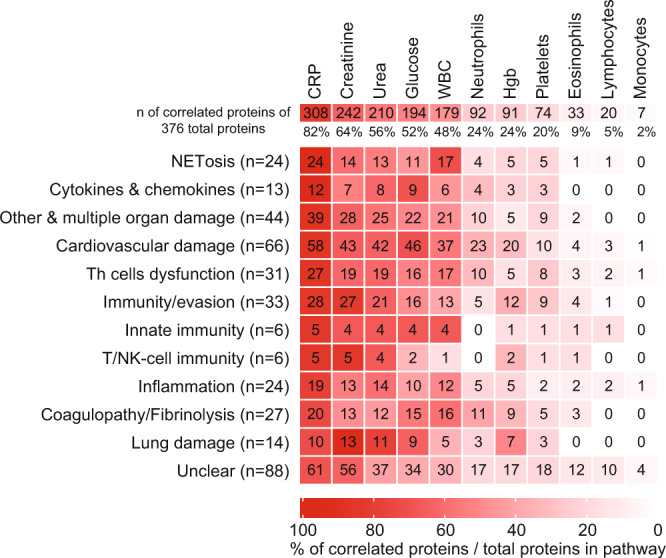
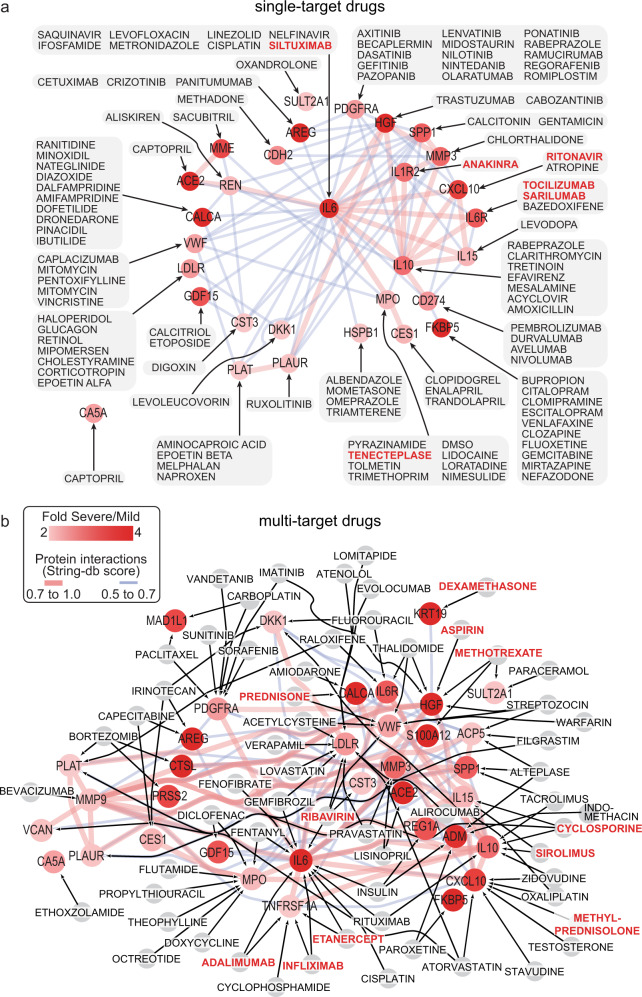
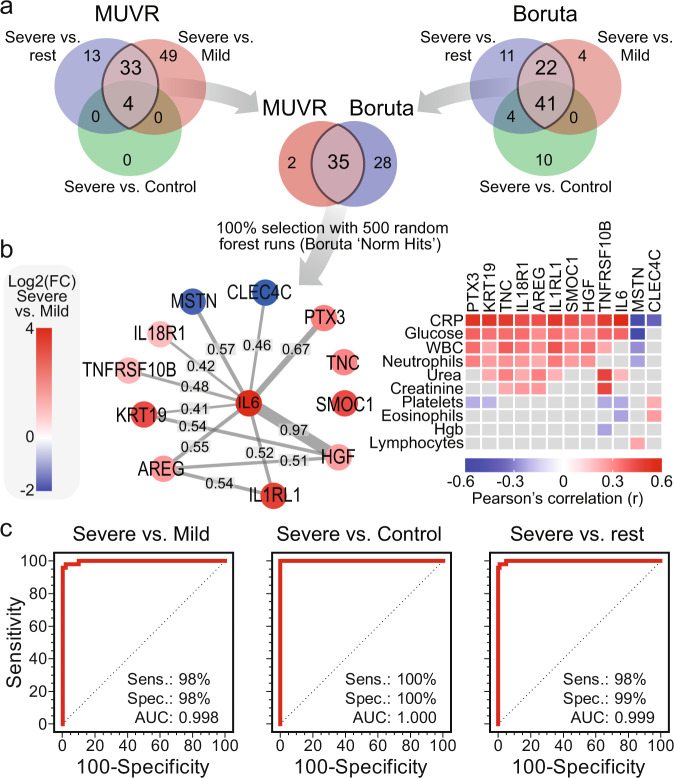
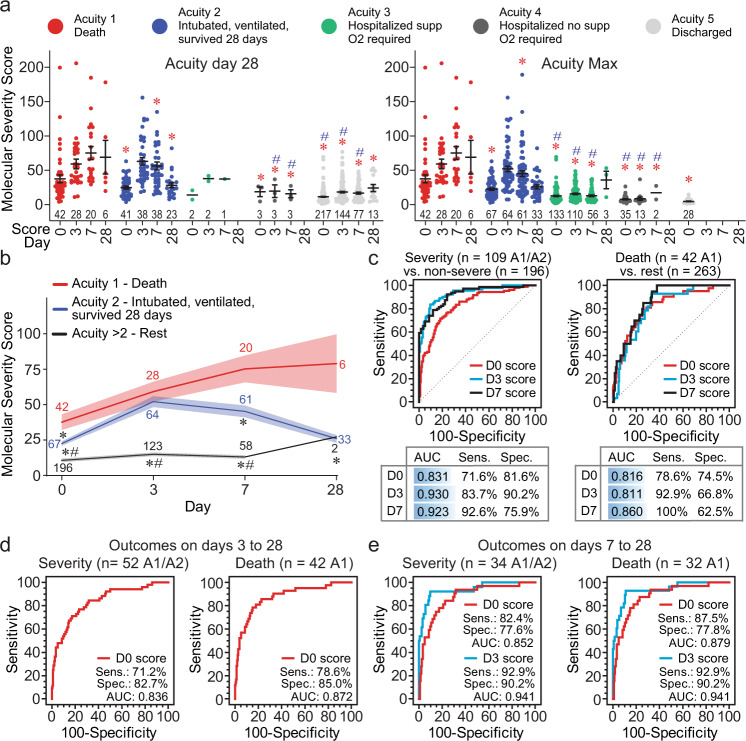
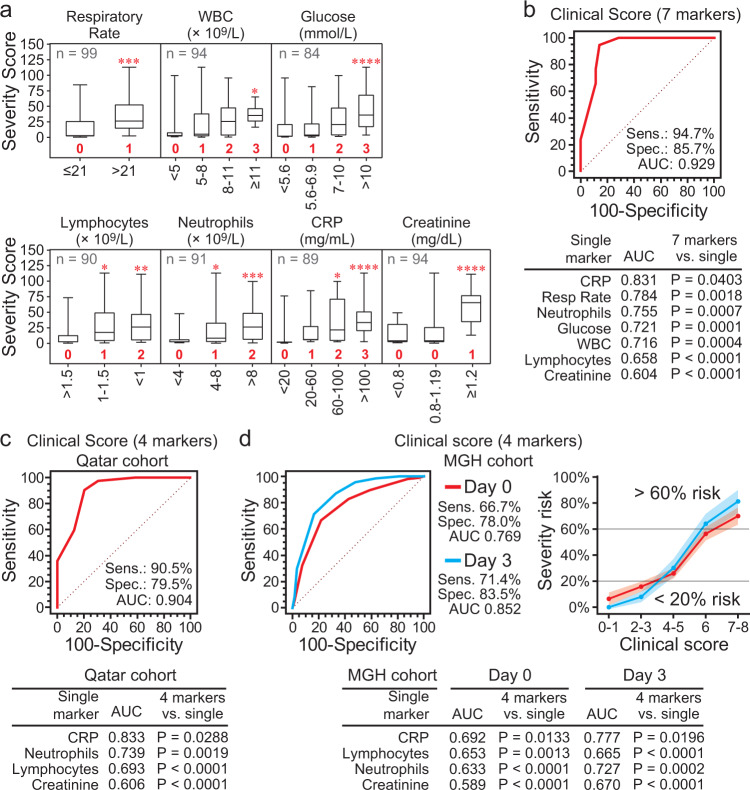
COVID-19 complications still present a huge burden on healthcare systems and warrant predictive risk models to triage patients and inform early intervention. Here, we profile 893 plasma proteins from 50 severe and 50 mild-moderate COVID-19 patients, and 50 healthy controls, and show that 375 proteins are differentially expressed in the plasma of severe COVID-19 patients. These differentially expressed plasma proteins are implicated in the pathogenesis of COVID-19 and present targets for candidate drugs to prevent or treat severe complications. Based on the plasma proteomics and clinical lab tests, we also report a 12-plasma protein signature and a model of seven routine clinical tests that validate in an independent cohort as early risk predictors of COVID-19 severity and patient survival. The risk predictors and candidate drugs described in our study can be used and developed for personalized management of SARS-CoV-2 infected patients.


Conflict of interest statement

The authors declare no competing interests.

Figures

Fig. 1
Fig. 1. Differential protein expression in plasma from patients with active SARS-CoV-2 infection.
The limma package was used to identify differentially expressed proteins (DEPs) from the single Olink panels and the combined dataset (893 unique proteins), which was defined as protein with more than 1.25-fold change with a P-value < 0.05 and FDR < 0.1. a Summary of the number of DEPs in each of the ten Olink panels used in the study. DEPs were used to calculate a score for each panel (refer to “Methods”), which was used for ROC curve analysis and the AUC under the ROC curves is stated for each panel. All ROC curves AUC had a P-value < 0.01. DeLong et al. method. b Unsupervised hierarchical clustering based on all proteins (a total of 893 unique proteins) assayed using the ten Olink panels showed a separation between patients with severe complications compared to mild cases and controls. The heatmap shows z-scores and clustering was done using correlation and average linkage. Principal component analysis (PCA) confirmed the separation of the severe cases based on the expression profiles of all proteins. c Volcano plots summarizing the DEPs across the patient groups. Differential expression analysis addressed severity as the main effect and included all factors, from obesity to SpO2 (except for disease grading), to correct for the interaction of these factors with severity. The time between admission to blood collection was also considered for interaction with disease severity in the comparison between severe and mild cases (right volcano plot in c). The number and percentage of the DEPs relevant to all proteins assayed are stated in each panel. Similar analyses were carried out for each panel and shown in Supplementary Fig. 1.
Fig. 2
Fig. 2. Functional analysis of deregulated plasma proteins in severe versus mild COVID-19 disease.
Differentially expressed proteins (DEPs) in patients with severe complications compared to mild-moderate disease were subjected to network analysis using the STRING-db (Supplementary Fig. 3) and annotation for their function as circulating proteins (Supplementary Data 3 and Supplementary Notes). Of the 375 DEPs (1.25-fold change in severe vs. mild cases), 288 (77%) DEPs shown in the Figure could be allocated to 11 functional groups considering their potential function as circulating proteins; chemotaxis, coagulopathy/fibrinolysis, immune evasion, innate immunity, T- or NK-cell immunity, T-/Th-cells dysfunction, inflammation, neutrophils/neutrophil extracellular traps (NETosis), and organ damage (lung, cardiovascular or other and multiple organs). The remaining 87 DEPs were either known to exist in circulation with unclear function or with known function but with no literature supporting their secretion or release into the blood (see Supplementary Data 3 and Supplementary Notes). The color intensities (red: upregulated, blue: downregulated; legend) depict the log2 fold-change between severe and mild-moderate cases. DEPs are classified as agonists (pos.) or antagonist (neg.) for the Th1/Th17 and Th2 immune responses. Network interactions between the 278 DEPs and their correlation with clinical blood test are shown in Supplementary Fig. 3.
Fig. 3
Fig. 3. Correlation between the clinical blood markers and the differentially expressed plasma proteins.
The correlation between the expression of the 375 differentially expressed plasma proteins and the available blood markers and blood cell counts in our cohort was evaluated. The overall number (and the percentage) of the DEPs which correlated (significance of p < 0.05, two-tailed, using Pearson’s correlation, GraphPad Prism) with each clinical measurement are shown in the top row. The heatmap shows the number of DEPs (and the percentage depicted by the heatmap colors), which correlated with each clinical parameter stratified by the functional annotations shown in Fig. 2. CRP showed the highest number of overall and function-specific correlations with the DEPs.
Fig. 4
Fig. 4. Drug–protein interactions of upregulated plasma proteins in severe COVID-19 patients.
Proteins with more than 2-fold upregulation in severe versus mild-moderate cases were subjected to protein-drug interaction analysis (PDI, using Drug-Gene Interaction database DGIdb, v4.2.0). Target proteins are colored red according to the fold change of expression in severe versus mild cases, whereas drugs are shown in gray boxes or nodes. Drugs that target 1.5- to 2-fold upregulated proteins in severe versus mild cases are shown in Supplementary Fig. 4. Interactions between proteins are depicted by red or blue lines for STRING-db confidence score of 0.7 to 1.0 or 0.5 to 0.7, respectively. a Drugs which target single proteins with 2-fold or more upregulation in severe COVID-19 patients versus mild-moderate cases. b Drugs which target with two or more upregulated proteins in severe COVID-19 patients. Those multi-target drugs affect proteins shown in (b) and/or proteins with 1.5- to 2-fold upregulation in severe versus mild cases (Supplementary Fig. 4).
Fig. 5
Fig. 5. A signature of 12 plasma proteins can differentiate COVID-19 cases with severe complications versus mild symptoms.
a Two variable (feature) selection algorithms were used to select the most robust proteins to differentiate severe cases from mild cases and controls; MUVR (multivariate modeling with minimally biased variable selection in R) and Boruta (a wrapper algorithm for all relevant feature selection and feature importance with random selection runs). Proteins that were shared in the differentiation between patients with severe COVID-19 from the rest of the cohort, and specifically from mild-moderate cases, using MUVR and Boruta were overlapped to select 35 proteins, of which 12 proteins were selected at 100% from 500 random forest runs (Boruta ‘Norm Hits’). b Network analysis for the 12 selected proteins showing the STRING-db confidence score. The heatmap summarizes the significant Pearson’s correlation coefficients between the 12 selected proteins and clinical blood markers and blood cell counts. c ROC curves based on the 12 DEPs, which were used to calculate the COVID-19 molecular severity score to evaluate the sensitivity, specificity, and the area under the ROC curves (AUC) for differentiating severe COVID-19 cases from mild cases, controls, or both. All ROC curve analyses were significant (p < 0.0001 from AUC of 0.5, DeLong et al. method).
Fig. 6
Fig. 6. Validation of the COVID-19 molecular severity score in the Massachusetts General Hospital (MGH) cohort.
a The molecular severity scores were calculated based on the expression of the 12 proteins measured using the Olink platform in the MGH cohort (Supplementary Data 5). The calculated scores (±SEM) are shown in the scatter plots over time according to the WHO ordinal scale for COVID-19 severity, acuity groups 1–5, on day 28 after recruitment (left panel) or the maximum acuity over the 28-day study period (right panel). The number of patients in each group is shown in the bar graph. b Time curve of the molecular severity scores (mean ± SEM, number of patients stated for each time point in each group) for the severe COVID-19 groups, A1 group (death) and A2 group (intubated, ventilated but survived 28 days), compared to the remaining groups (A3–A5). * and # in a, b denote statistical differences (p < 0.01, refer to Supplementary Data 6 for exact p-values) between the A1 group to the other and the A2 group to the other groups, respectively (two-way ANOVA with Tukey’s multiple testing correction). c Summary of ROC curve analyses to evaluate the performance of the molecular severity scores on days 0, 3, and 7 in the MGH cohort to predict the maximum COVID-19 severity throughout the 28-day-study. d, e Summary of ROC curve analyses to evaluate the performance of the molecular severity scores on day 0 or day 3 to predict COVID-19 severity or death between days 3 to 28 or days 7 to 28, respectively. The AUC, sensitivity (sens.), specificity (spec.), and the number of severe events in each ROC curve are stated. All ROC curves were statistically significant (p < 0.0001 from AUC of 0.5, DeLong et al. method).
Fig. 7
Fig. 7. A clinical risk score for COVID-19 complications based on the 12-protein molecular severity score.
a The clinical parameters available in the cohort were evaluated for their association with the 12-protein molecular severity score to identify significantly associated parameters and allow scoring (weighting) for the different groups in each clinical measurement. The box plots (median as center line, box marks the 25th and 75th percentiles, and whiskers define minimum and maximum) show the molecular severity score across the groups in the most associated clinical parameters; the number of patients (total of 100, 50 severe, and 50 non-severe) with data available for each parameter is stated in each panel. One-way ANOVA with Dunnett’s multiple testing correction was used for clinical parameters with more than two groups, and unpaired two-tailed t-test was used for parameters with two groups. Refer to Supplementary Data 6 for more details of the statistical comparisons and exact p-value. The groups in each of the seven selected clinical parameter (markers) were given a numeric, integer value from 0 to 3 (shown in red bold font) according to the 12-protein severity score. These values were then used to calculate the Clinical Risk Score by adding the values across the 7 markers for each patient. Refer to Supplementary Fig. 6 for details of variable selection. b ROC curve analysis confirmed the significant predictive value of the Clinical Risk Score, which combined the 7 clinical markers. c, d Of the 7 markers in (a), 4 (CRP and creatinine levels and lymphocyte and neutrophil cell counts) were available in the MGH cohort, thus, were used for independent validation (Supplementary Data 5). c, d Show the ROC curve of the Clinical Risk Score based on the 4 markers in our cohort from Qatar and the MGH cohort (from day 0 and day 3 data) from the US, respectively. D Also shows the risk of COVID-19 severity (% risk with 95% confidence interval) in the MGH cohort according to the 4-marker Clinical Risk Score. For bd the Clinical Risk Scores outperformed each of the single clinical parameters in pairwise comparisons (p < 0.0001, DeLong et al. method).

References

    1. ISARIC Clinical Characterisation Group, et al. ISARIC Clinical Data Report issued: 14 July 2021. medRxiv, 2020.2007.2017.20155218. Preprint at 10.1101/2020.07.17.20155218 (2021).
    1. Uhlen M, et al. Proteomics. Tissue-based map of the human proteome. Science. 2015;347:1260419. - PubMed
    1. Filbin MR, et al. Longitudinal proteomic analysis of severe COVID-19 reveals survival-associated signatures, tissue-specific cell death, and cell-cell interactions. Cell Rep. Med. 2021;2:100287. - PMC - PubMed
    1. Lu L, Zhang H, Dauphars DJ, He YW. A potential role of interleukin 10 in COVID-19 pathogenesis. Trends Immunol. 2021;42:3–5. - PMC - PubMed
    1. Rose-John S. IL-6 trans-signaling via the soluble IL-6 receptor: importance for the pro-inflammatory activities of IL-6. Int. J. Biol. Sci. 2012;8:1237–1247. - PMC - PubMed

Publication types