. 2022 Feb 17;13(1):954.
doi: 10.1038/s41467-022-28618-9.

Hypoxia-induced macropinocytosis represents a metabolic route for liver cancer

Affiliations

Hypoxia-induced macropinocytosis represents a metabolic route for liver cancer

Misty Shuo Zhang et al. Nat Commun. .

Abstract

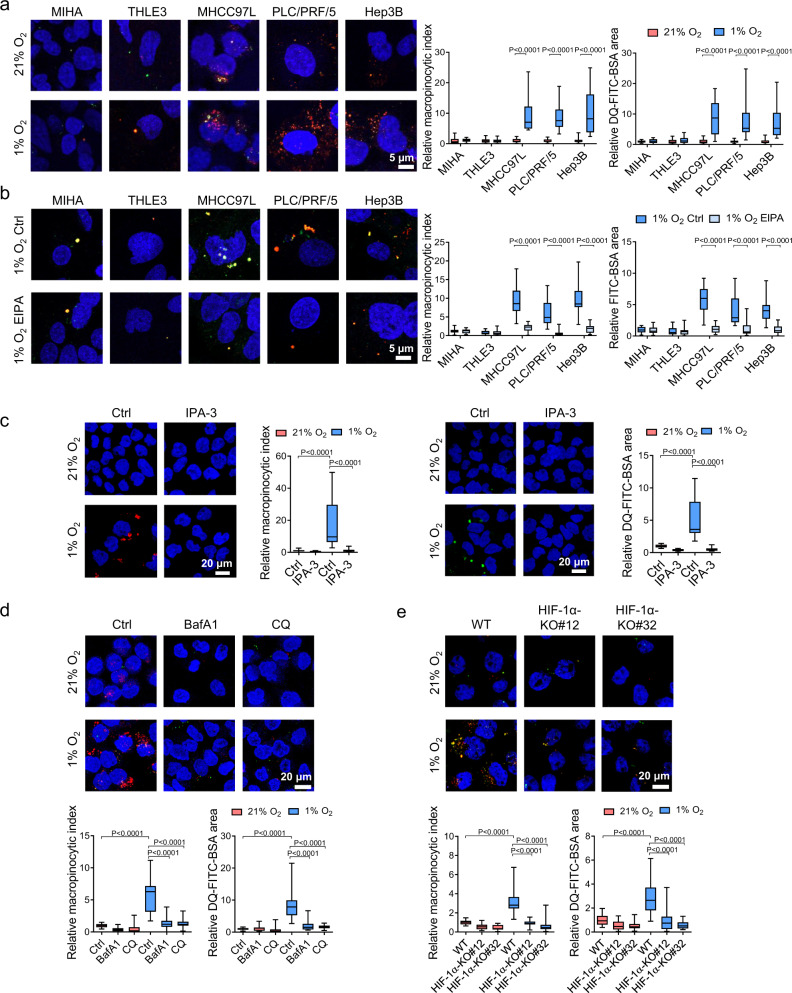
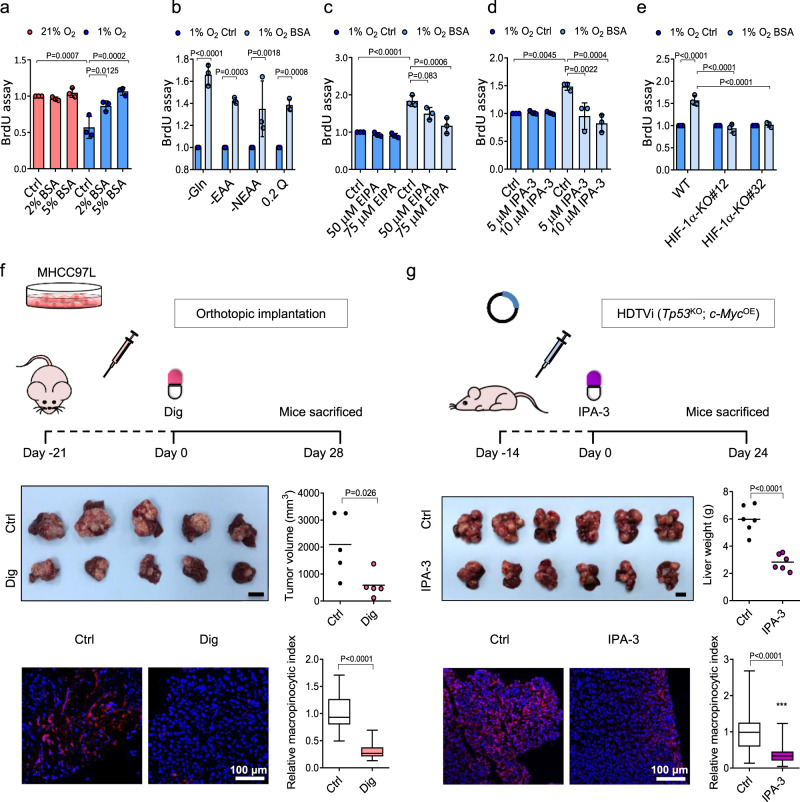
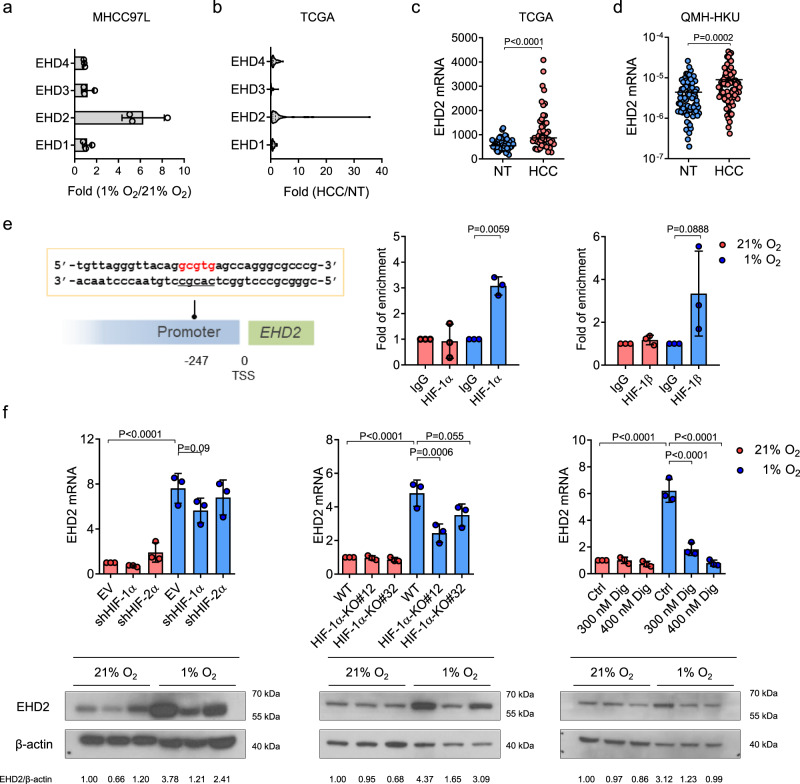
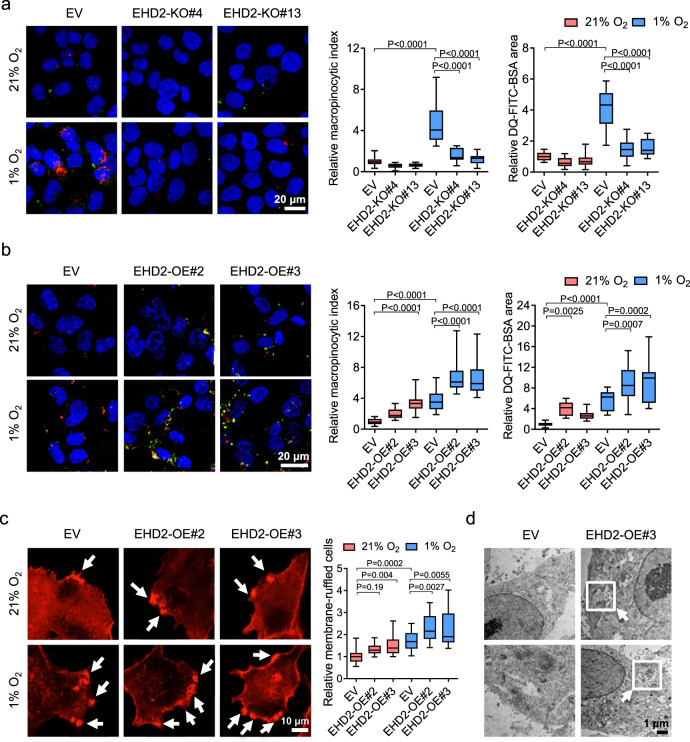
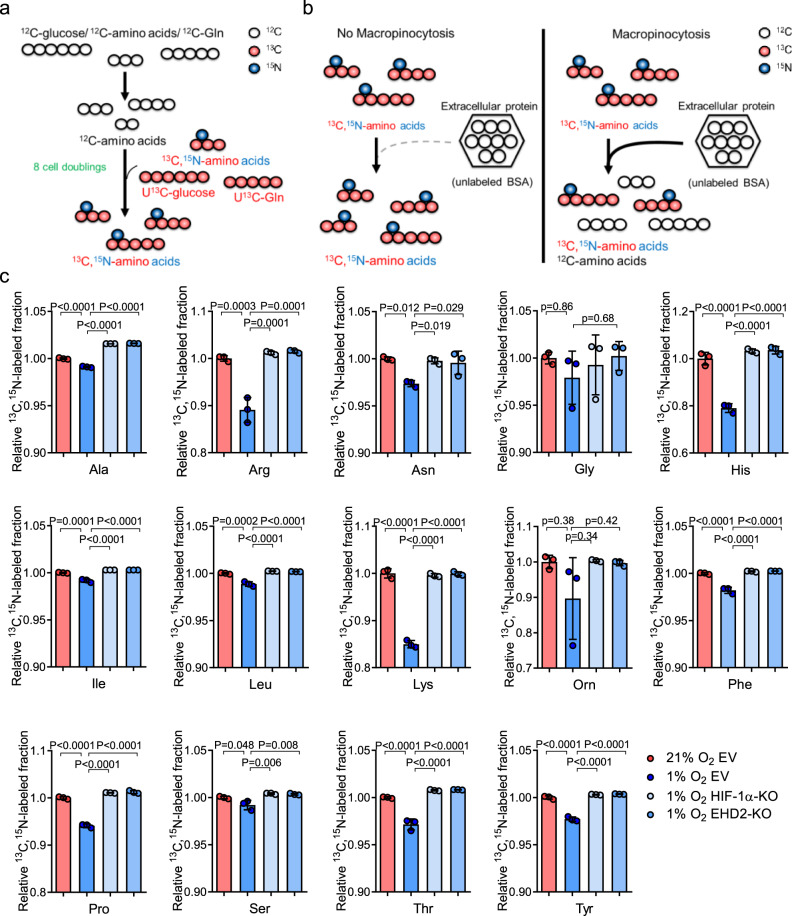
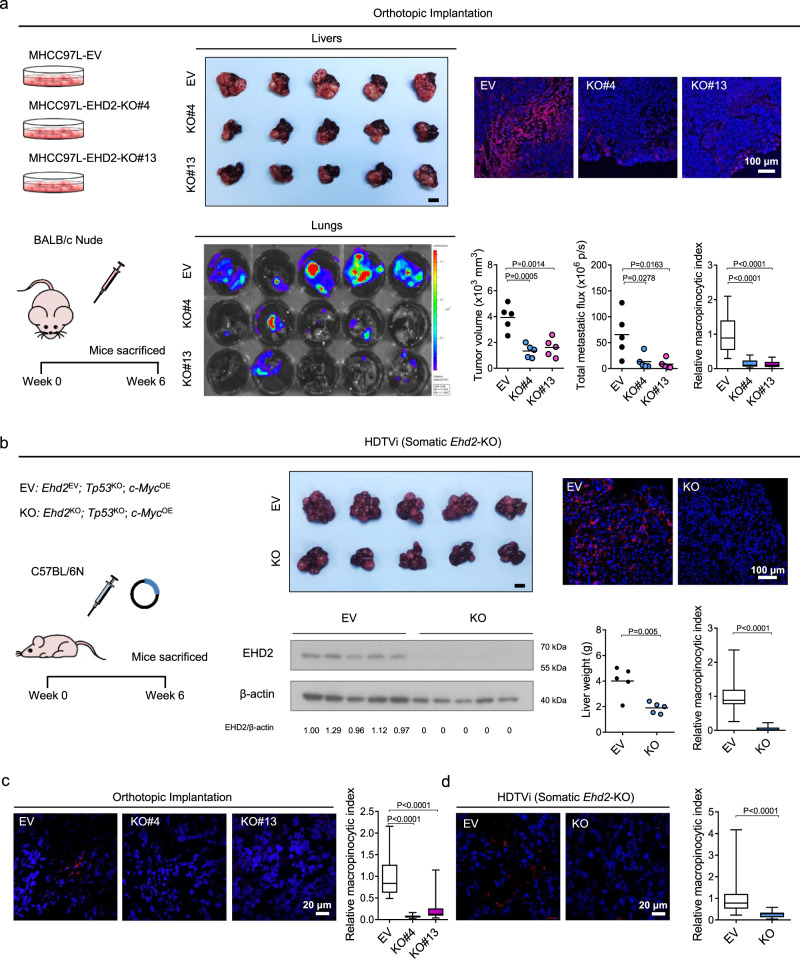
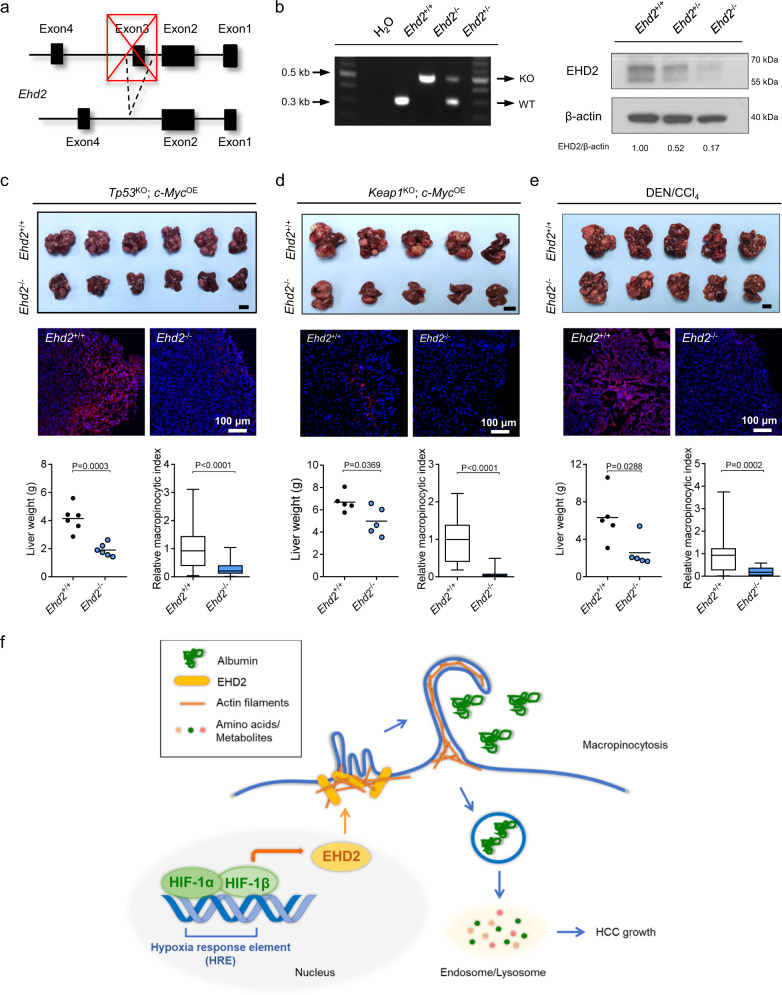
Hepatocellular carcinoma (HCC) invariably exhibits inadequate O2 (hypoxia) and nutrient supply. Hypoxia-inducible factor (HIF) mediates cascades of molecular events that enable cancer cells to adapt and propagate. Macropinocytosis is an endocytic process initiated by membrane ruffling, causing the engulfment of extracellular fluids (proteins), protein digestion and subsequent incorporation into the biomass. We show that macropinocytosis occurs universally in HCC under hypoxia. HIF-1 activates the transcription of a membrane ruffling protein, EH domain-containing protein 2 (EHD2), to initiate macropinocytosis. Knockout of HIF-1 or EHD2 represses hypoxia-induced macropinocytosis and prevents hypoxic HCC cells from scavenging protein that support cell growth. Germline or somatic deletion of Ehd2 suppresses macropinocytosis and HCC development in mice. Intriguingly, EHD2 is overexpressed in HCC. Consistently, HIF-1 or macropinocytosis inhibitor suppresses macropinocytosis and HCC development. Thus, we show that hypoxia induces macropinocytosis through the HIF/EHD2 pathway in HCC cells, harnessing extracellular protein as a nutrient to survive.


Conflict of interest statement

The authors declare no competing interests.

Figures

Fig. 1
Fig. 1. Hypoxia induces macropinocytosis in HCC cells.
a Immortalized liver cells MIHA, THLE3, and HCC cells MHCC97L, PLC/PRF/5, and Hep3B exposed to 21 and 1% O2 were incubated with 70 kDa tetramethylrhodamine dextran (TMR dextran) and dye-quenched FITC-conjugated BSA (DQ-FITC-BSA) for macropinosome labeling and measurement of protein degradation, respectively. Confocal images show dextran uptake/macropinosomes (red), degraded FITC-BSA (green), and nuclei (DAPI, blue). Macropinocytic indexes were calculated based on the intensities of red signals, DQ-FITC-BSA particle areas were calculated from green signals, respectively. Values were normalized to 21% O2. b MIHA, THLE3, MHCC97L, PLC/PRF/5, and Hep3B exposed to 1% O2 were treated with 50 µM EIPA or vehicle control (Ctrl). Confocal images demonstrate the macropinosome (dextran, red) and constitutively fluorescent BSA (green) within the cells. Macropinocytic indexes were calculated based on the intensities of red signals, constitutively fluorescent BSA particle areas were calculated from green signals. Values were normalized to 21% O2 Ctrl. c Left: MHCC97L cells were treated with 10 µM IPA-3 or vehicle control (Ctrl, DMSO). Confocal images show dextran uptake/macropinosomes (red) and nuclei (DAPI, blue) of MHCC97L cells exposed to 21 and 1% O2. Right: Confocal images show degraded FITC-BSA (green) and nuclei (DAPI, blue) of MHCC97L cells exposed to 21 and 1% O2. Macropinocytic indexes and DQ-FITC-BSA particle areas were normalized to 21% O2 Ctrl. d MHCC97L cells exposed to 21 and 1% O2 were treated with 200 nM lysosomal inhibitors bafilomycin A1 (BafA1), 20 μM chloroquine (CQ), or vehicle control (Ctrl, DMSO). Confocal images show dextran uptake/macropinosomes (red), degraded FITC-BSA (green), and nuclei (DAPI, blue). Macropinocytic indexes and DQ-FITC-BSA particle areas were normalized to 21% O2 Ctrl. e Confocal images demonstrate dextran uptake/macropinosomes (red), degraded DQ-FITC-BSA (green), and nuclei (DAPI, blue) of MHCC97L wild type (WT), -HIF-1α-KO#12, and -HIF-1α-KO#32 exposed to 21 and 1% O2. Macropinocytic indexes and DQ-FITC-BSA particle areas were normalized to values of 21% O2 WT. ae Results were from 3 independent experiments. Box-and-whisker: center line, median; box limits, 25th to 75th percentiles; whiskers, min to max. Two-way ANOVA with Bonferroni correction. Source data are provided as a Source Data file.
Fig. 2
Fig. 2. Protein scavenging promotes hypoxic HCC cell growth.
a Cell proliferation of MHCC97L cells cultured in 0.2 mM glutamine (0.2 Q) supplemented with increasing doses of BSA or vehicle control (Ctrl) in 21 and 1% O2. Values were normalized to 21% O2 Ctrl. b Cell proliferation of MHCC97L cells cultured in glutamine-depleted (-Gln), essential amino acid-depleted (-EAA), nonessential amino acid-depleted (-NEAA), or 0.2 Q DMEM media in 1% O2 treated with 5% BSA or vehicle control (Ctrl). c Cell proliferation of MHCC97L cells cultured in 10% AA-DMEM containing 5% BSA. Cells were treated with EIPA or vehicle control (Ctrl). d Cell proliferation of MHCC97L cells cultured in 10% AA-DMEM treated with IPA-3 or vehicle control (Ctrl). Cells were supplemented with 5% BSA or vehicle control (Ctrl). e Cell proliferation of MHCC97L wild type (WT), -HIF-1α-KO#12, and -HIF-1α-KO#32 cultured in 10% AA-DMEM treated with 5% BSA or vehicle control (Ctrl, PBS) under 1% O2 condition. f Top: 6–8 week-old male BALB/cAnN-nude mice were orthotopically implanted with luciferase-labeled MHCC97L cells into the livers and received digoxin (dig) or vehicle-control (Ctrl) treatment for 28 days. Middle: Image of orthotopic HCC xenografts and tumor volumes of mice. Bottom: Confocal images show dextran uptake/macropinosomes (red) and nuclei (DAPI, blue) in HCC tissues. n = 5 biologically independent samples. g Top: Hydrodynamic tail-vein injection (HDTVi) of genome-editing systems was performed in 8–10-week-old male C57BL/6 N mice to induce Tp53KO; c-MycOE mouse HCC. Mice received IPA-3 or vehicle control (Ctrl) treatment for 24 days. Middle: Image of HCC and liver weights of mice. Bottom: Confocal images show dextran uptake/macropinosomes (red) and nuclei (DAPI, blue) of HCC tissues. n = 6 biologically independent samples. ae Results were from 3 independent experiments. be Values were normalized to 1% O2 Ctrl. f, g Scale bars, 1 cm. Macropinocytic indexes were normalized to Ctrl. Error bars indicate mean ± SD. Scatter plot: center line, mean. Box-and-whisker: center line, median; box limits, 25th to 75th percentiles; whiskers, min–max. ae Two-way ANOVA with Bonferroni correction. f, g Two-tailed Student’s t-test. Source data are provided as a Source Data file.
Fig. 3
Fig. 3. EHD2 is a HIF transcriptional target overexpressed in HCC.
a RT-qPCR data showed mRNA expressions of EHD-family members (EHD1–EHD4) in MHCC97L cells exposed to 21 and 1% O2. Values were normalized to 21% O2. mRNA expressions were normalized to 18S. The results were from 3 independent experiments. b Transcriptome sequencing data from the TCGA show the mRNA expressions of EHD1–EHD4 in 49 pairs of human HCC tissues and nontumorous liver tissues (NT). n = 49 biologically independent samples. c EHD2 mRNA expressions in HCC and corresponding NT tissues from the TCGA. d EHD2 mRNA expressions in HCC and corresponding NT tissues from patients admitted to Queen Mary Hospital, the University of Hong Kong (QMH-HKU). e Left: A putative hypoxia-response element (HRE) in EHD2. Transcription start site (TSS) is defined as 0. Right: ChIP assay was performed in MHCC97L cells exposed to 21 and 1% O2 using IgG, HIF-1α, or HIF-1β antibodies. The fold of enrichment was referenced to IgG. f EHD2 mRNA and protein expressions in MHCC97L empty vector (EV), -shHIF-1α, -shHIF-2α cells (left), MHCC97L-wild type (WT), -HIF-1α-KO#12, and -HIF-1α-KO#32 cells (middle), and MHCC97L treated with 300 nM digoxin (Dig), 400 nM Dig, or vehicle ctrl (Ctrl) (right) exposed to 21 and 1% O2. mRNA expressions were normalized to 18S. Band intensities were normalized to 21% MHCC97L EV, -WT, or -Ctrl. ef (upper panel): Results were from 3 independent experiments. f (lower panel): Results were representative for 3 independent experiments with similar results from different repeats. Error bars indicate mean ± SD. Two-way ANOVA with Bonferroni correction. Source data are provided as a Source Data file.
Fig. 4
Fig. 4. EHD2 promotes macropinocytosis through actin remodeling.
a. Confocal images show dextran uptake/macropinosomes (red) and FITC-BSA degradation (green) of MHCC97L-EV, -EHD2-KO#4, and -EHD2-KO#13 exposed to 21 and 1% O2. b Confocal images reveal dextran uptake/macropinosomes (red) and FITC-BSA degradation (green) of MHCC97L-EV, -EHD2-OE#2, and -EHD2-OE#3 cells exposed to 21 and 1% O2. c Super high-resolution images show actin filaments (phalloidin, red) in MHCC97L-EV, -EHD2-OE#2, and -EHD2-OE#3 cells exposed to 21 and 1% O2. Arrows indicate the membrane ruffles. Percentage of cells with membrane ruffles was normalized to 21% O2 EV. d Images acquired by transmission electronic microscope (TEM) in MHCC97L-EV and -EHD2-OE#3 cells exposed to 21% O2. Arrows point to the macropinosomes in MHCC97L-EHD2-OE cells. a, b Macropinocytic indexes and DQ-FITC-BSA particle areas were normalized to 21% O2 EV. ac Results were from 3 independent experiments. d Results were representative from n = 5 imaging analysis. Scatter plot: center line, mean. Box-and-whisker: center line, median; box limits, 25th to 75th percentiles; whiskers, min to max. Two-way ANOVA with Bonferroni correction. Source data are provided as a Source Data file.
Fig. 5
Fig. 5. Integration of scavenged extracellular protein into the intracellular amino acid pool through hypoxia-induced macropinocytosis.
a, b The workflow of stable isotope exchange and isotope-tracing experiment. a HCC cells were cultured in 13C,15N-DMEM containing U13C-glucose, U13C-glutamine (U13C-Gln), and 13C,15N-amino acids for 8 cell doublings. The unlabeled amino acids were replaced with isotope-labeled amino acids. b Isotope-labeled HCC cells were cultured in 13C,15N-DMEM with unlabeled BSA (12C-BSA). Without macropinocytosis, intracellular amino acids should remain to be isotope-labeled. With macropinocytosis, scavenged 12C-BSA becomes a source of amino acids and therefore decreases the ratio of isotope-labeled amino acids. c The 13C,15N-labeled fraction of amino acids in MHCC97L-EV, -HIF-1α-KO, and -EHD2-KO cells supplemented with 12C-BSA and exposed to 21 and 1% O2. Values were normalized to 21% O2 EV. Results were from 3 independent mass-spectrometry analysis. Error bars indicate mean ± SD. Two-way ANOVA with Bonferroni correction. Ala alanine, Arg arginine, Asn asparagine, Gly glycine, His histidine, Ile isoleukine, Leu leukine, Lys lysine, Orn ornithine, Phe phenylalanine, Pro proline, Ser serine, Thr threonine, Tyr tyrosine. Source data are provided as a Source Data file.
Fig. 6
Fig. 6. EHD2 promotes HCC growth and macropinocytosis in vivo.
a Left: 6–8-week-old male nude mice were orthotopically implanted with luciferase-labeled MHCC97L-EV, -EHD2-KO#4, and -EHD2-KO#13 cells into the livers. HCCs were harvested 6 weeks after implantation. Middle: Livers (HCCs) harvested from the tumor-bearing mice (top) and bioluminescent imaging of lung metastases (bottom). Right: Confocal images demonstrate ex vivo dextran uptake/macropinosomes (red) and nuclei (DAPI, blue) in HCCs (top). Tumor volumes, bioluminescence of lung metastases, and macropinocytic indexes of HCC tissues were quantified (bottom). n = 5 biologically independent samples. b Left: HDTVi was performed in 8–10-week-old male wild-type C57BL/6 N mice to induce Ehd2EV; Tp53KO; c-MycOE (EV) and Ehd2KO; Tp53KO; c-MycOE (KO) HCCs. Middle: Image of livers (HCCs) was shown (top). Western blots demonstrate EHD2 protein expressions in EV and KO HCC tissues (bottom). Right: Confocal images show ex vivo dextran uptake/macropinosomes (red) and nuclei (DAPI, blue) in HCCs (top). Liver weights and macropinocytic indexes of HCCs (bottom). n = 5 biologically independent samples. c Confocal images show dextran uptake/macropinosomes (red) and nuclei (DAPI, blue) in orthotopic HCC tissues in nude mice. In vivo dextran labeling was performed by IV injection. n = 5 biologically independent samples. d Confocal images show dextran uptake/macropinosomes (red) and nuclei (DAPI, blue) in HCC tissues in HDTVi model by in vivo labeling of dextran through IV injection. Macropinocytic indexes were normalized to EV. n = 5 biologically independent samples. a, b Scale bars, 1 cm. The number of mice was represented by the number of dots. Scatter plot: center line, mean. Box-and-whisker: center line, median; box limits, 25th to 75th percentiles; whiskers, min to max. a, c One-way ANOVA with Bonferroni correction. b, d Two-tailed Student’s t-test. Source data are provided as a Source Data file.
Fig. 7
Fig. 7. HIF-1/EHD2 induces macropinocytosis to support HCC growth in hypoxic conditions.
a Transgenic strategy for generation of C57BL/6 N EHD2 germline KO (Ehd2−/−) mouse. Exon3 of mouse Ehd2 was spliced in Ehd2−/− mice. b Left: Gel picture shows PCR products from WT (Ehd2+/+) and KO (Ehd2−/−) alleles in Ehd2+/+, Ehd2−/−, and Ehd2+/− mice. Right: Western blots demonstrate EHD2 expression in liver tissues from 8-week-old Ehd2+/+, Ehd2+/−, and Ehd2−/− male mice. Results were representative for three independent experiments with similar results. c Top: Image of livers (Tp53KO; c-MycOE HCCs) from Ehd2+/+ and Ehd2−/− mice. Middle: Confocal images show ex vivo dextran uptake/macropinosomes (red) and nuclei (DAPI, blue) in Ehd2+/+ and Ehd2−/− HCC tissues. Bottom: Liver weights and macropinocytic indexes from Ehd2+/+ and Ehd2−/− mice. n = 6 biologically independent samples. d Top: Image of livers (Keap1KO; c-MycOE HCCs) from Ehd2+/+ and Ehd2−/− mice. Middle: Confocal images show ex vivo dextran uptake/macropinosomes (red) and nuclei (DAPI, blue). Bottom: Liver weights and macropinocytic indexes from Ehd2+/+ and Ehd2−/− mice. n = 5 biologically independent samples. e Top: Image of livers (DEN/CCl4 HCCs) was shown. Middle: Confocal images demonstrate ex vivo dextran uptake/macropinosomes (red) and nuclei (DAPI, blue) in HCC tissues from Ehd2+/+ and Ehd2−/− mice. Bottom: Liver weights and macropinocytic indexes from Ehd2+/+ and Ehd2−/− mice. n = 5 biologically independent samples. f Research summary. Hypoxia stabilizes HIF-1 that transcriptionally activates EHD2. EHD2 interacts with actin filaments to promote membrane ruffling that initiates macropinocytosis in hypoxic HCC cells. Hypoxia-induced macropinocytosis promotes the engulfment of extracellular proteins (e.g., albumin). Degraded extracellular proteins are integrated into the intracellular amino acid pool to support HCC cell growth under hypoxic conditions. ce Macropinocytic indexes were normalized to Ehd2+/+. Scale bars, 1 cm. The number of mice was represented by the number of dots. Scatter plot: center line, mean. Box-and-whisker: center line, median; box limits, 25th to 75th percentiles; whiskers, min to max. Two-tailed Student’s t-test. Source data are provided as a Source Data file.

References

    1. Ikeda M, et al. Safety and pharmacokinetics of lenvatinib in patients with advanced hepatocellular carcinoma. Clin. Cancer Res. 2016;22:1385–1394. - PubMed
    1. Llovet JM, et al. Sorafenib in advanced hepatocellular carcinoma. N. Engl. J. Med. 2008;359:378–390. - PubMed
    1. Bruix, J. Regorafenib shows significant survival gains in refractory liver cancer. European Society for Medical Oncology (EMSO) Congress, World Congress on Gastrointestical Cancer (EMSO, 2016).
    1. El-Khoueiry, A. B. et al. Nivolumab in patients with advanced hepatocellular carcinoma (CheckMate 040): an open-label, non-comparative, phase 1/2 dose escalation and expansion trial. Lancet, 10.1016/S0140-6736(17)31046-2 (2017). - PMC - PubMed
    1. Finn RS, et al. Atezolizumab plus Bevacizumab in unresectable hepatocellular carcinoma. N. Engl. J. Med. 2020;382:1894–1905. - PubMed

Publication types

MeSH terms

Substances