Comparative Study
. 2022 Feb 17;12(1):2659.
doi: 10.1038/s41598-022-06625-6.

Detecting SARS-CoV-2 lineages and mutational load in municipal wastewater and a use-case in the metropolitan area of Thessaloniki, Greece

Affiliations
Comparative Study

Detecting SARS-CoV-2 lineages and mutational load in municipal wastewater and a use-case in the metropolitan area of Thessaloniki, Greece

Nikolaos Pechlivanis et al. Sci Rep. .

Abstract

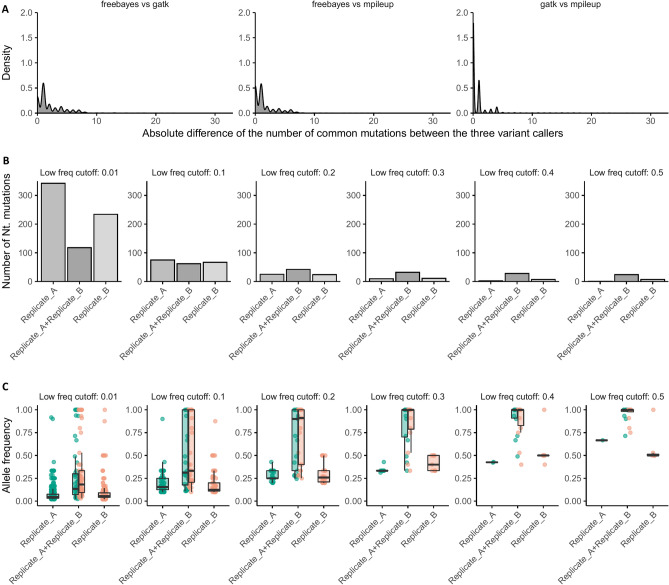
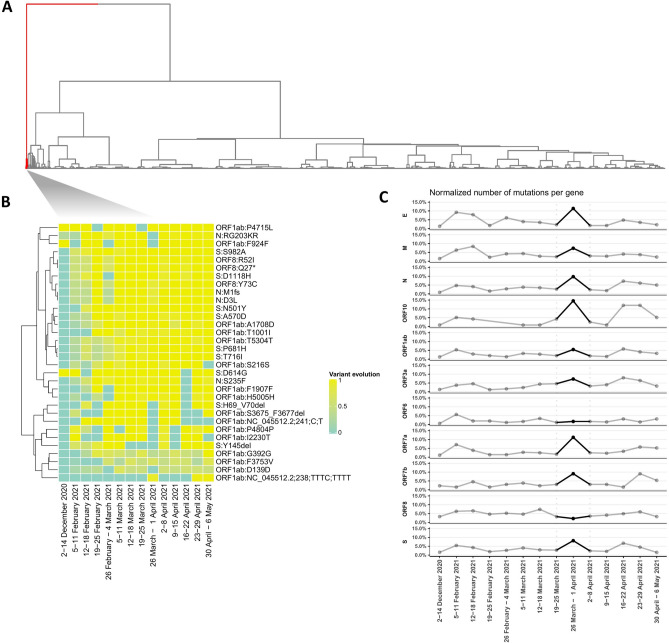
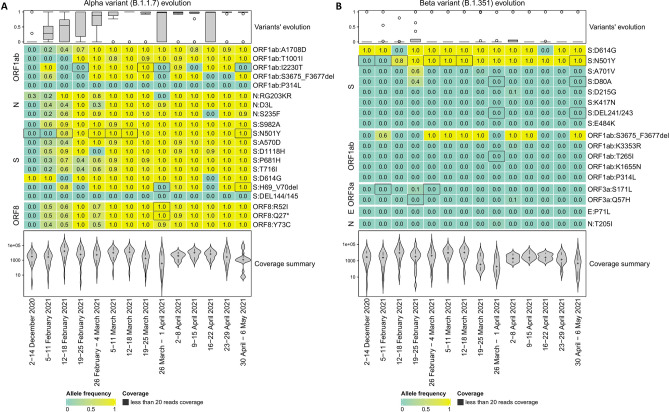
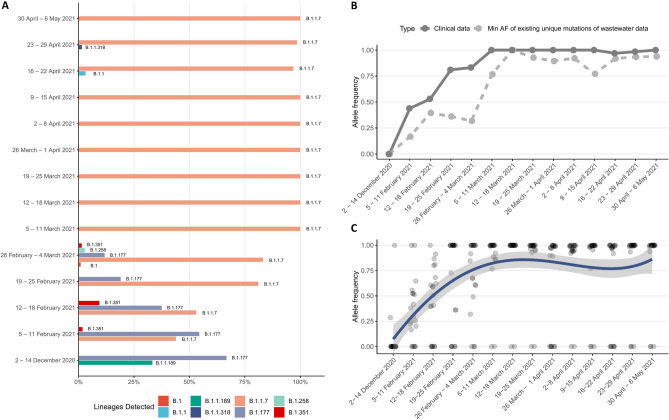
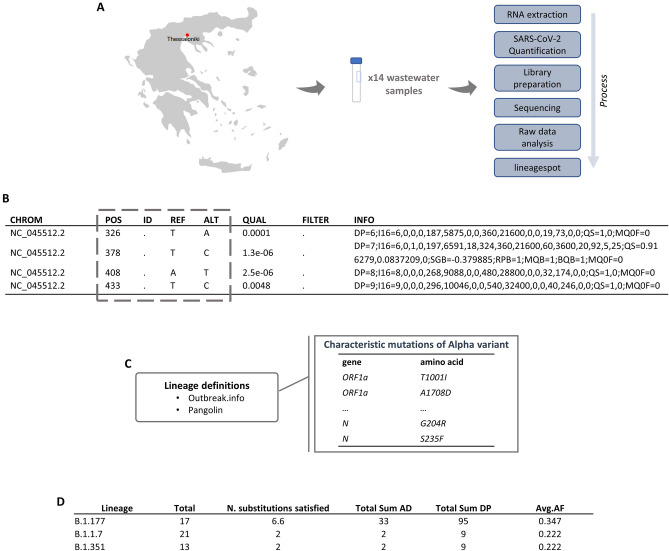
The COVID-19 pandemic represents an unprecedented global crisis necessitating novel approaches for, amongst others, early detection of emerging variants relating to the evolution and spread of the virus. Recently, the detection of SARS-CoV-2 RNA in wastewater has emerged as a useful tool to monitor the prevalence of the virus in the community. Here, we propose a novel methodology, called lineagespot, for the monitoring of mutations and the detection of SARS-CoV-2 lineages in wastewater samples using next-generation sequencing (NGS). Our proposed method was tested and evaluated using NGS data produced by the sequencing of 14 wastewater samples from the municipality of Thessaloniki, Greece, covering a 6-month period. The results showed the presence of SARS-CoV-2 variants in wastewater data. lineagespot was able to record the evolution and rapid domination of the Alpha variant (B.1.1.7) in the community, and allowed the correlation between the mutations evident through our approach and the mutations observed in patients from the same area and time periods. lineagespot is an open-source tool, implemented in R, and is freely available on GitHub and registered on bio.tools.


Conflict of interest statement

The authors declare no competing interests.

Figures

Figure 1
Figure 1
Evolution of mutations across different low frequency parameters. (A) Density plot of the absolute Nt difference values between the number of common mutations of the three variant calling tools used (pairwise comparisons). (B) Number of reads for each replicate and for the common mutations. (C) The corresponding allele frequency for each replicate and for the common mutations.
Figure 2
Figure 2
Unsupervised mutation clustering was performed on a table containing all amino acid substitutions (A) Hierarchical clustering shows the clustered collapsed amino acid substitution using the Euclidean distance as a distance metric and ward.D as a clustering method. (B) Hierarchical clustering based on the cluster 1 of the (A). The heatmap shows the mutation evolution across the different periods. (C) Number of mutations per gene across the different periods. The values of the plot were normalized based on the length of each gene.
Figure 3
Figure 3
Clustering amino acid substitutions for the Alpha (B.1.1.7) and the Beta (B.1.351) variants. Heatmap displays the corresponding allele frequency (AF) of each period per amino acid substitution. (A) Evolution of B.1.1.7-detected mutations. (B) Evolution of B.1.351-detected mutations. Positions with low coverage (less than 20 reads) are depicted with dark gray color.
Figure 4
Figure 4
Comparison between wastewater samples and clinical data. (A) SARS-CoV-2 lineages detected on clinical samples over all time periods. (B) The percentage of presence of the Alpha (B.1.1.7) variant of concern (VoC) in the clinical samples and the estimated minimum level of presence of the same VoC in the wastewater data. (C) Average percentage of the presence of each characteristic mutation of the B.1.1.7 variant of concern. The line corresponds to the average value per time period. Mutations that are not found in a particular time point are detected in the neighbouring ones, thus leading to the variations in the average.
Figure 5
Figure 5
Snapshots of the intermediate steps. (A) A summary plot showing the overall process from the sampling to lineagespot. (B) A VCF file produced by the chosen variant caller (C) SARS-CoV-2 characteristic substitutions retrieved either from a public source (such as Pangolin or outbreak.info), or be user-provided. (D). A tab-delimited file as produced by lineagespot.

References

    1. Nemudryi, A. et al. Temporal Detection and Phylogenetic Assessment of SARS-CoV-2 in Municipal Wastewater. 10.1101/2020.04.15.20066746 (2020). - PMC - PubMed
    1. Jahn, K. et al. Detection of SARS-CoV-2 Variants in Switzerland by Genomic Analysis of Wastewater Samples. 10.1101/2021.01.08.21249379 (2021).
    1. Petala M, et al. A physicochemical model for rationalizing SARS-CoV-2 concentration in sewage. Case study: The city of Thessaloniki in Greece. Sci. Total Environ. 2021;755:142855. doi: 10.1016/j.scitotenv.2020.142855. - DOI - PMC - PubMed
    1. Westhaus S, et al. Detection of SARS-CoV-2 in raw and treated wastewater in Germany—Suitability for COVID-19 surveillance and potential transmission risks. Sci. Total Environ. 2021;751:141750. doi: 10.1016/j.scitotenv.2020.141750. - DOI - PMC - PubMed
    1. Wu F, et al. Wastewater surveillance of SARS-CoV-2 across 40 U.S. states from February to June 2020. Water Res. 2021;202:117400. doi: 10.1016/j.watres.2021.117400. - DOI - PMC - PubMed

Publication types

Supplementary concepts