. 2022 Apr;6(4):469-481.
doi: 10.1038/s41559-022-01661-x. Epub 2022 Feb 17.

Supergene origin and maintenance in Atlantic cod

Affiliations

Supergene origin and maintenance in Atlantic cod

Michael Matschiner et al. Nat Ecol Evol. 2022 Apr.

Abstract

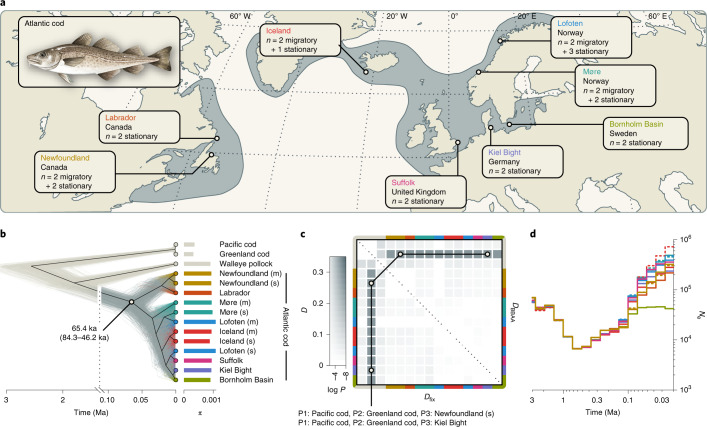
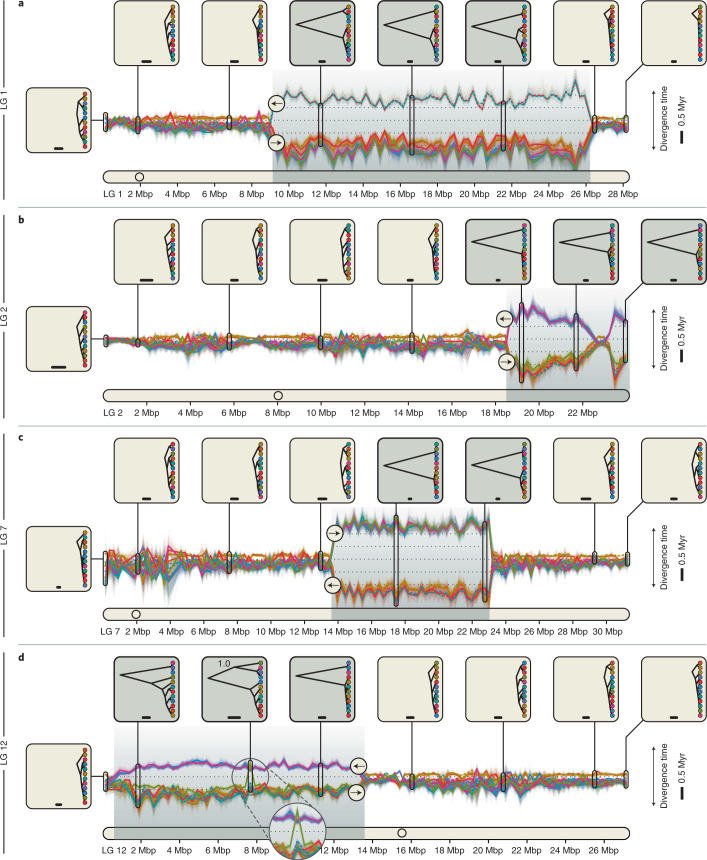
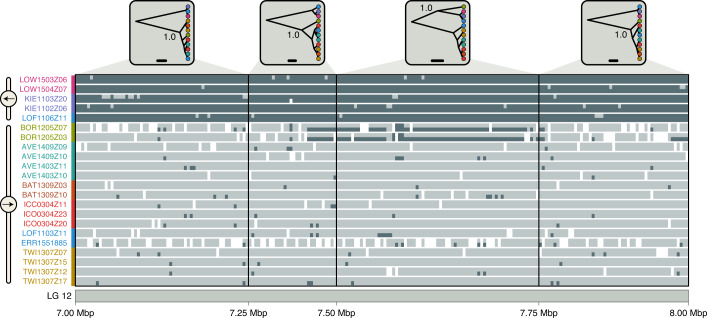
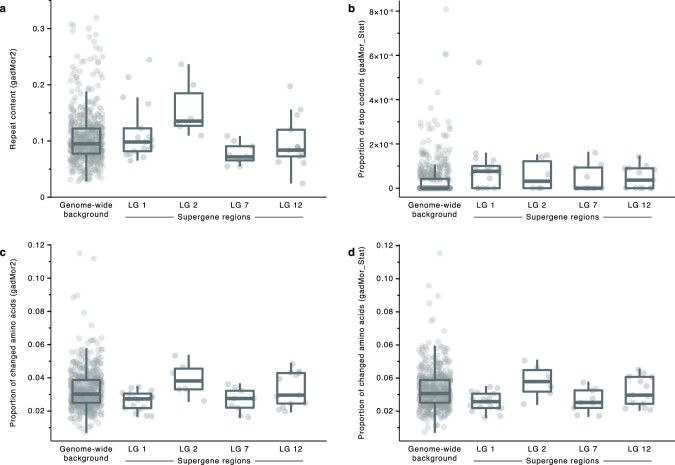
Supergenes are sets of genes that are inherited as a single marker and encode complex phenotypes through their joint action. They are identified in an increasing number of organisms, yet their origins and evolution remain enigmatic. In Atlantic cod, four megabase-scale supergenes have been identified and linked to migratory lifestyle and environmental adaptations. Here we investigate the origin and maintenance of these four supergenes through analysis of whole-genome-sequencing data, including a new long-read-based genome assembly for a non-migratory Atlantic cod individual. We corroborate the finding that chromosomal inversions underlie all four supergenes, and we show that they originated at different times between 0.40 and 1.66 million years ago. We reveal gene flux between supergene haplotypes where migratory and stationary Atlantic cod co-occur and conclude that this gene flux is driven by gene conversion, on the basis of an increase in GC content in exchanged sites. Additionally, we find evidence for double crossover between supergene haplotypes, leading to the exchange of an ~275 kilobase fragment with genes potentially involved in adaptation to low salinity in the Baltic Sea. Our results suggest that supergenes can be maintained over long timescales in the same way as hybridizing species, through the selective purging of introduced genetic variation.


Conflict of interest statement

The authors declare no competing interests.

Figures

Fig. 1
Fig. 1. Four supergenes associated with megabase-scale chromosomal inversions in Atlantic cod.
a, Migratory and stationary Atlantic cod seasonally co-occur along the coast of northern Norway and differ in total length and otolith measurements,. The distribution of stationary Atlantic cod is shaded in grey, whereas the seasonal movements of migratory Atlantic cod are indicated with dark-grey arrows. b, Pairwise sequence divergence between the gadMor2 and gadMor_Stat assemblies, relative to the sequence divergence of the haddock genome assembly (melAeg) in a three-way whole-genome alignment. The alignment coordinates are according to the gadMor2 assembly. LGs 1, 2, 7 and 12 are shown as rounded horizontal bars, on which circles indicate the approximate centromere positions. Supergene regions are shaded in grey, and the beginning and end of each of these regions are shown in more detail in the insets below each LG. Each of these insets focuses on a section of 100 kbp around a supergene’s beginning or end. Shown in black above the bar representing that section is a per-SNP measure of LD, calculated as the sum of the distances between SNPs in high linkage (R2 > 0.8). On the basis of this measure, the grey shading on the bar illustrates the beginning or the end of high LD. Drawn below the scale bar are contigs of the gadMor_Stat and melAeg assemblies, in light grey and dark grey, respectively, that align well to the shown sections. The arrows indicate the alignment orientations of the contigs (forward or reverse complement), and the contigs are labelled with numbers as in Supplementary Table 3. In the first insets for LGs 1 and 7, the vertical bars indicate inferred inversion breakpoints, which are found up to 45 kbp (Table 1) after the onset of high LD. M, million. Fish drawings by Alexandra Viertler; otolith images by Côme Denechaud. Source data
Fig. 2
Fig. 2. Divergence times, demography and gene flow among Atlantic cod populations.
a, Geographic distribution and sampling locations of Atlantic cod in the North Atlantic. b, Tree of Atlantic cod populations and three outgroups (in beige; Pacific cod, Greenland cod and walleye pollock), inferred under the multispecies coalescent model from 1,000 SNPs sampled across the genome (excluding inversion regions). The thin grey and beige lines show individual trees sampled from the posterior distribution; the black line indicates the maximum-clade-credibility (MCC) summary tree. Estimates of π per population are indicated by bars to the right of the tips of the tree. c, Pairwise gene flow among Atlantic cod populations and introgression with outgroup species. Two versions of the D-statistic, DBBAA and Dfix, are shown above and below the diagonal, respectively. The colour codes on the axes indicate populations. The two trios (P1–P3) with the strongest signals are indicated, supporting introgression between Greenland cod and both the Kiel Bight and the stationary Newfoundland Atlantic cod populations with DBBAA = Dfix = 0.250. d, Population sizes (Ne) over time in Atlantic cod populations, estimated with Relate. For the Newfoundland, Møre, Iceland and Lofoten populations, migratory (m) and stationary (s) individuals were analysed separately; dashed lines are used for migratory populations. Source data
Fig. 3
Fig. 3. Divergence times, demography and gene flux within supergene regions.
a,d,g,j, Trees of Atlantic cod populations and three outgroups (in beige; Pacific cod, Greenland cod and walleye pollock) inferred under the multispecies coalescent model from 1,000 SNPs sampled from the supergene regions on LGs 1 (a), 2 (d), 7 (g) and 12 (j). The thin grey and beige lines show individual trees sampled from the posterior distribution; the black line indicates the MCC summary tree. Within Atlantic cod, derived and ancestral arrangements are marked with forward and reverse arrows, respectively. Estimates of π per population within supergene regions are indicated by bars to the right of the tips of the tree. b,e,h,k, Pairwise signals of past gene flow among Atlantic cod populations and introgression with outgroup species within the supergene regions on LGs 1 (b), 2 (e), 7 (h) and 12 (k). Two versions of the D-statistic, DBBAA and Dfix, are shown above and below the diagonal, respectively. The colour codes on the axes indicate populations, ordered as in a,d,g,j, and the heatmap colours indicate D-statistics as in Fig. 2c. The trios (P1–P3) with the strongest signals of gene flux or introgression are indicated. c,f,i,l, Population sizes (Ne) over time in Atlantic cod populations for the supergene regions on LGs 1 (c), 2 (f), 7 (i) and 12 (l). For the Newfoundland, Møre, Iceland and Lofoten populations, migratory (m) and stationary (s) individuals were analysed separately; dashed lines are used for migratory populations. The grey regions indicate the confidence intervals for the inferred age of the split between the two haplotypes (from a,d,g,j). Source data
Fig. 4
Fig. 4. Divergence-time profiles for LGs with supergenes.
ad, Between-population divergence times along LGs 1 (a), 2 (b), 7 (c) and 12 (d), estimated from SNPs in sliding windows. Supergene regions are indicated by grey backgrounds. Along the vertical axis, the distance between two adjacent lines shows the time by which the corresponding populations have been separated on the ladderized population tree for a given window; both the scale bar and the dotted lines indicate a duration of 0.5 Myr. Examples of the population tree are shown in insets for eight selected windows. The scale bars in these insets indicate a branch length equivalent to 50,000 years. The node label in one inset in d indicates the support for the grouping of the Bornholm Basin population with three populations representing the derived arrangement (BPP, 1.0). Source data
Fig. 5
Fig. 5. Ancestry painting for part of the supergene on LG 12.
The ancestry painting, shows genotypes at 219 haplotype-informative sites between positions 7 and 8 Mbp on LG 12, within the supergene on that LG. For each of 22 Atlantic cod individuals, homozygous genotypes are shown in dark or light grey, while heterozygous genotypes are illustrated with a light-grey top half and a dark-grey bottom half; white indicates missing genotypes. We selected as haplotype-informative sites those that have less than 10% missing data and strongly contrasting allele frequencies (≥0.9 in one group and ≤0.1 in the other) between the group carrying the derived arrangement (individuals from Suffolk, Kiel Bight and stationary Lofoten) and the group carrying the ancestral arrangement (individuals from the Møre, Labrador, Iceland, migratory Lofoten and Newfoundland populations). The four insets at the top show population trees inferred from SNPs; the node labels in these insets indicate Bayesian support for the grouping of the Bornholm Basin population with either the derived or the ancestral arrangement. Source data
Extended Data Fig. 1
Extended Data Fig. 1. Repeat content and mutation load in Atlantic cod.
Repeat content and mutation load were quantified in sliding windows along the gadMor2 assembly. Windows had a length or 1 Mbp and were grouped into supergene regions and the remainder of the genome (n = 544, 17, 6, 9 and 13 for the genome-wide background and the four supergene regions, respectively). a Repeat content per window was quantified using the repeat annotation generated by Tørresen et al. for the gadMor2 assembly. b–d Mutation load was calculated based on the three-way genome alignment. As a first measure of mutation load, we quantified, per window, the proportion of stop codons among all codons in the gadMor_Stat sequences of the three-way alignment (b), according to gene annotation produced by Tørresen et al. for the gadMor2 assembly. As a second measure of mutation load, we calculated the proportions of amino acids that were changed, compared to the melAeg assembly, in the gadMor2 (c) and gadMor_Stat assemblies (d), according to the three-way alignment. Per supergene region, we tested for increased repeat content or mutation load compared to the genome-wide background; however, no measures were significantly increased at false discovery rate (FDR) 0.05 (one-sided t-test with measurements taken from distinct samples; p > 0.46; see Supplementary Table 21 for details). Box plots show the median as center line, box sizes indicate the first and third quartiles, and whiskers extend to the most extreme values or 1.5 × the interquartile range from the box limits. Source data
Extended Data Fig. 2
Extended Data Fig. 2. Divergence times and introgression among Gadinae.
a Distribution ranges of species in the genera Gadus, Arctogadus and Boreogadus. Partially overlapping distribution ranges are shown in dark grey, with outline shades indicating the species (all distributions are shown separately in Supplementary Figure 7). b Species tree of the six species and three outgroups (P. virens, M. aeglefinus and M. merlangus; outgroups shown in beige), estimated under the isolation-with-migration model from 109 alignments with a total length 383,727 bp. The Bayesian analysis assigned 99.7% of the posterior probability to two tree topologies that differ in the position of Arctic cod and were supported with Bayesian posterior probabilities (BPP) of 0.763 and 0.234, respectively. Rates of introgression estimated in the Bayesian analysis are marked with arrows. Thin grey and beige lines show individual trees sampled from the posterior distribution; the black line indicates the maximum-clade-credibility summary tree, separately calculated for each of the two topologies. Of Atlantic cod, both migratory and stationary individuals were included. c Pairwise introgression among species of the genera Gadus, Arctogadus and Boreogadus. Introgression was quantified with the D-statistic. The heatmap shows two versions of the D-statistic, DBBAA and Dfix, above and below the diagonal, respectively. d Introgression across the genome. The fdM-statistic is shown for sliding windows in comparisons of three species. The top and bottom rows show support for introgression between polar cod and Arctic cod and between Atlantic cod and Greenland cod, respectively. Results are shown separately for the stationary and migratory Atlantic cod genomes. The mean D-statistic across the genome is marked with a thin solid line. See Supplementary Notes 3 and 4 for details and a discussion of these results. Fish drawings by Alexandra Viertler. Source data
Extended Data Fig. 3
Extended Data Fig. 3. Measures of differentiation and divergence for linkage groups with supergenes.
As a complement to the patterns of temporal divergence shown in Figure 4, differentiation and divergence across linkage groups with supergenes were also quantified as Fst (a-h) and dxy (i-p). As in Figure 4, the two measures were calculated in sliding windows with a length of 250 kbp, for predefined groups of populations that separated those with the ancestral and derived supergene orientations. Both measures are plotted across linkage groups of the gadMor2 assembly (a-d, i-l) and chromosomes of the newer gadMor3 (e-h, m-p) assembly. Note that gadMor3 chromosome 2 is inverted relative to gadMor2 LG 2 (see Supplementary Figure 1). Comparable results were obtained by Barth et al. for gadMor2 LGs 2, 7 and 12, using a different dataset and shorter window sizes of 50 and 100 kbp. Source data

Comment in

  • Evolution of cod supergenes.
    Tigano A. Tigano A. Nat Ecol Evol. 2022 Apr;6(4):355-356. doi: 10.1038/s41559-022-01662-w. Nat Ecol Evol. 2022. PMID: 35177801 No abstract available.

References

    1. Joron M, et al. Chromosomal rearrangements maintain a polymorphic supergene controlling butterfly mimicry. Nature. 2011;477:203–206. - PMC - PubMed
    1. Yan Z, et al. Evolution of a supergene that regulates a trans-species social polymorphism. Nat. Ecol. Evol. 2020;4:210–249. - PubMed
    1. Lamichhaney S, et al. Structural genomic changes underlie alternative reproductive strategies in the ruff (Philomachus pugnax) Nat. Genet. 2016;48:84–88. - PubMed
    1. Tuttle EM, et al. Divergence and functional degradation of a sex chromosome-like supergene. Curr. Biol. 2016;26:344–350. - PMC - PubMed
    1. Li J, et al. Genetic architecture and evolution of the S locus supergene in Primula vulgaris. Nat. Plants. 2016;2:16188. - PubMed

Publication types