. 2022 Mar;24(3):373-383.
doi: 10.1038/s41556-022-00848-5. Epub 2022 Feb 17.

YAP/TAZ drives cell proliferation and tumour growth via a polyamine-eIF5A hypusination-LSD1 axis

Affiliations

YAP/TAZ drives cell proliferation and tumour growth via a polyamine-eIF5A hypusination-LSD1 axis

Hongde Li et al. Nat Cell Biol. 2022 Mar.

Abstract

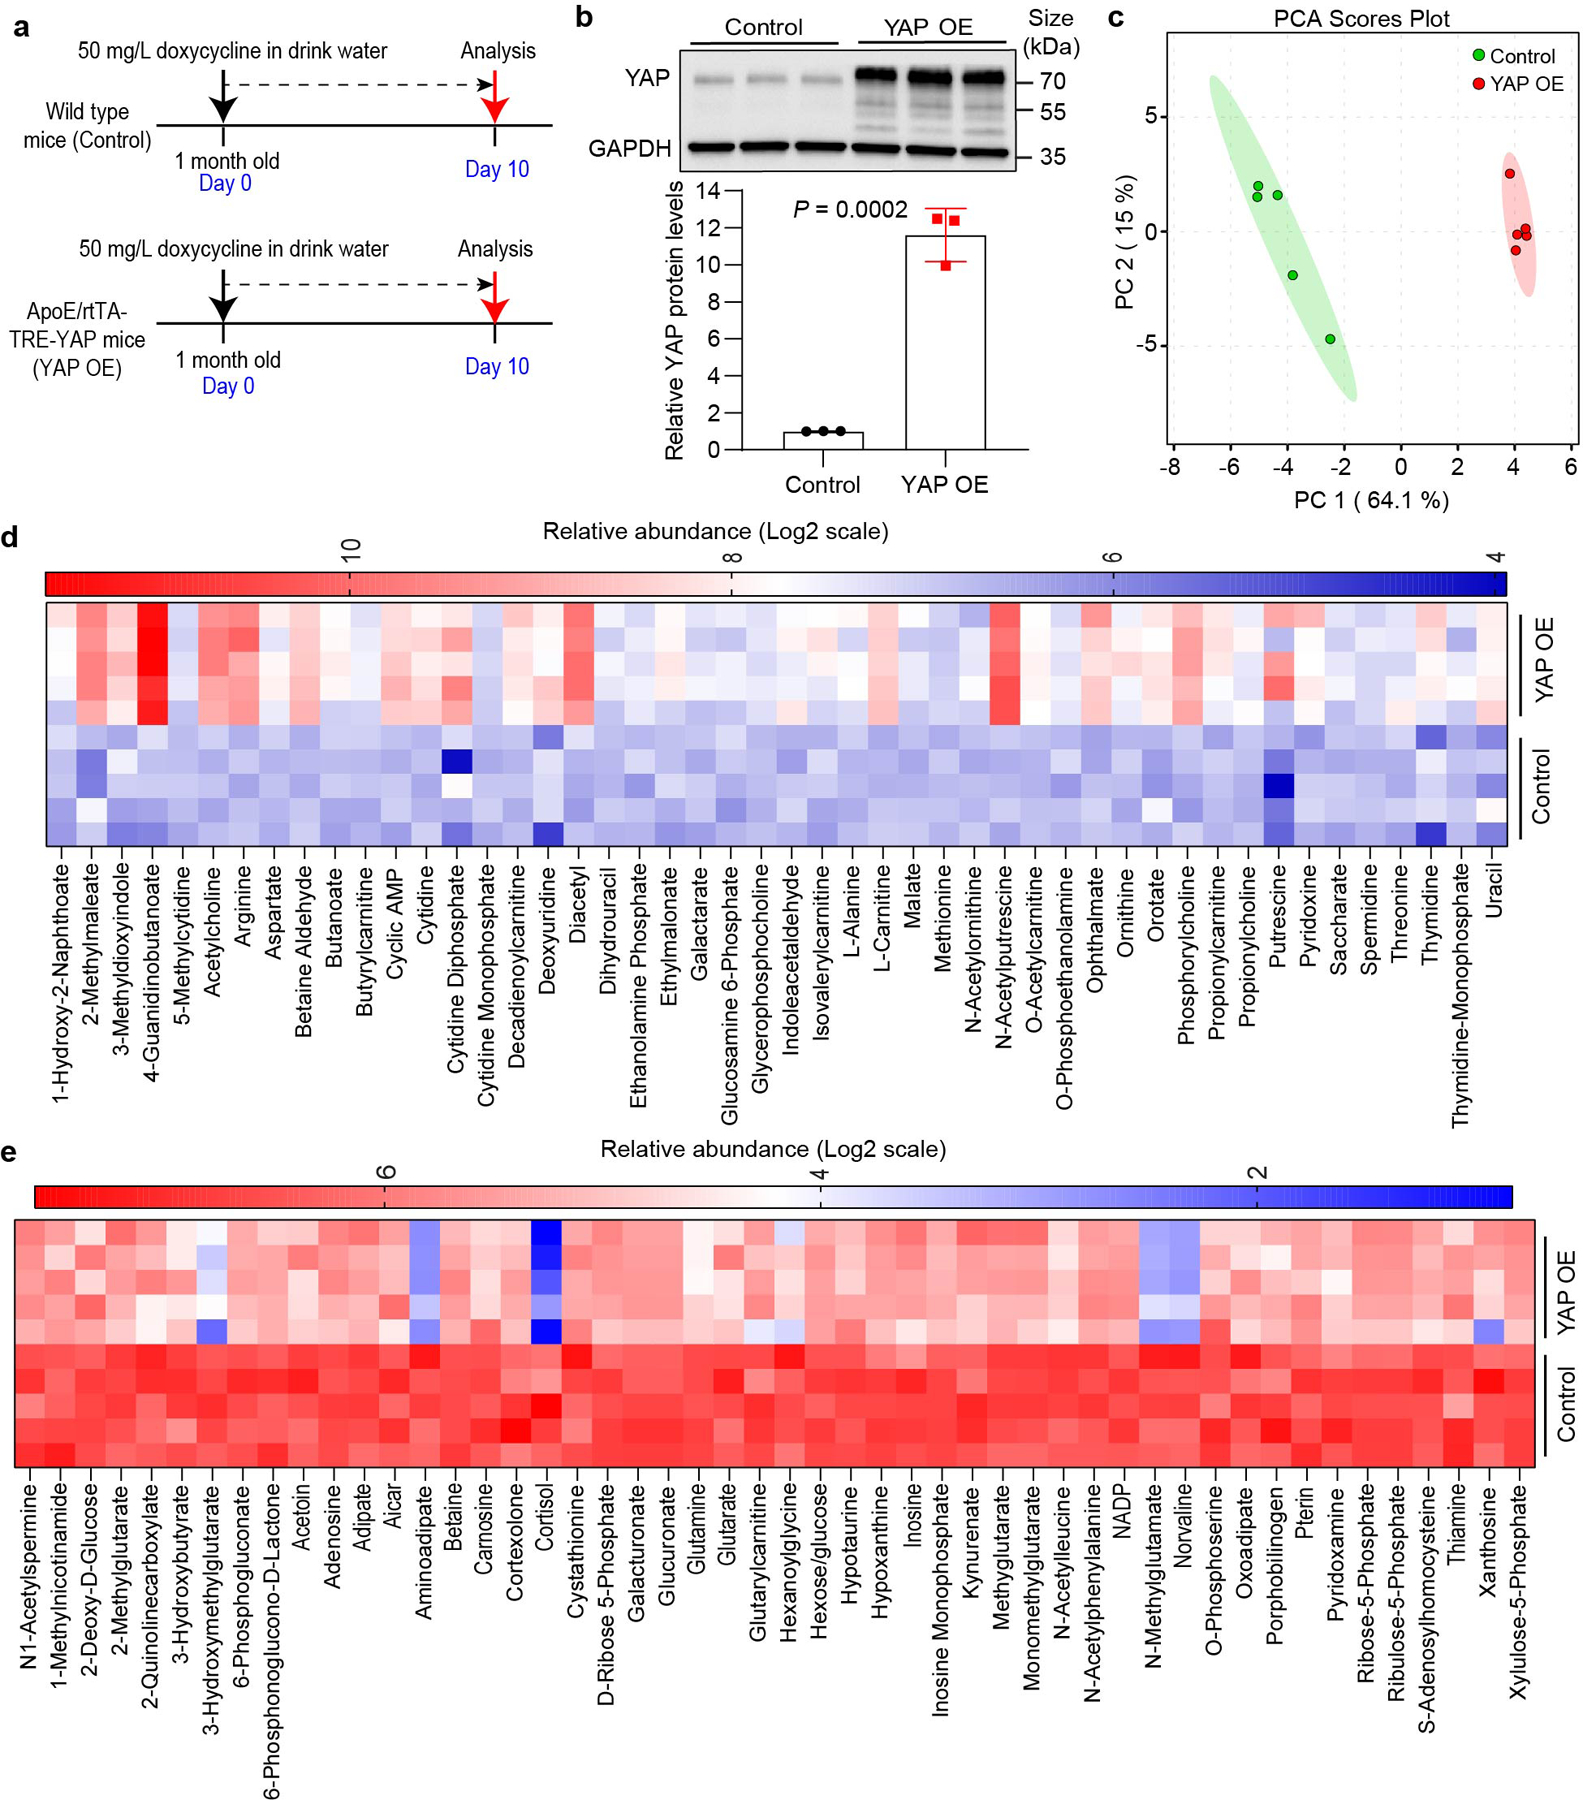
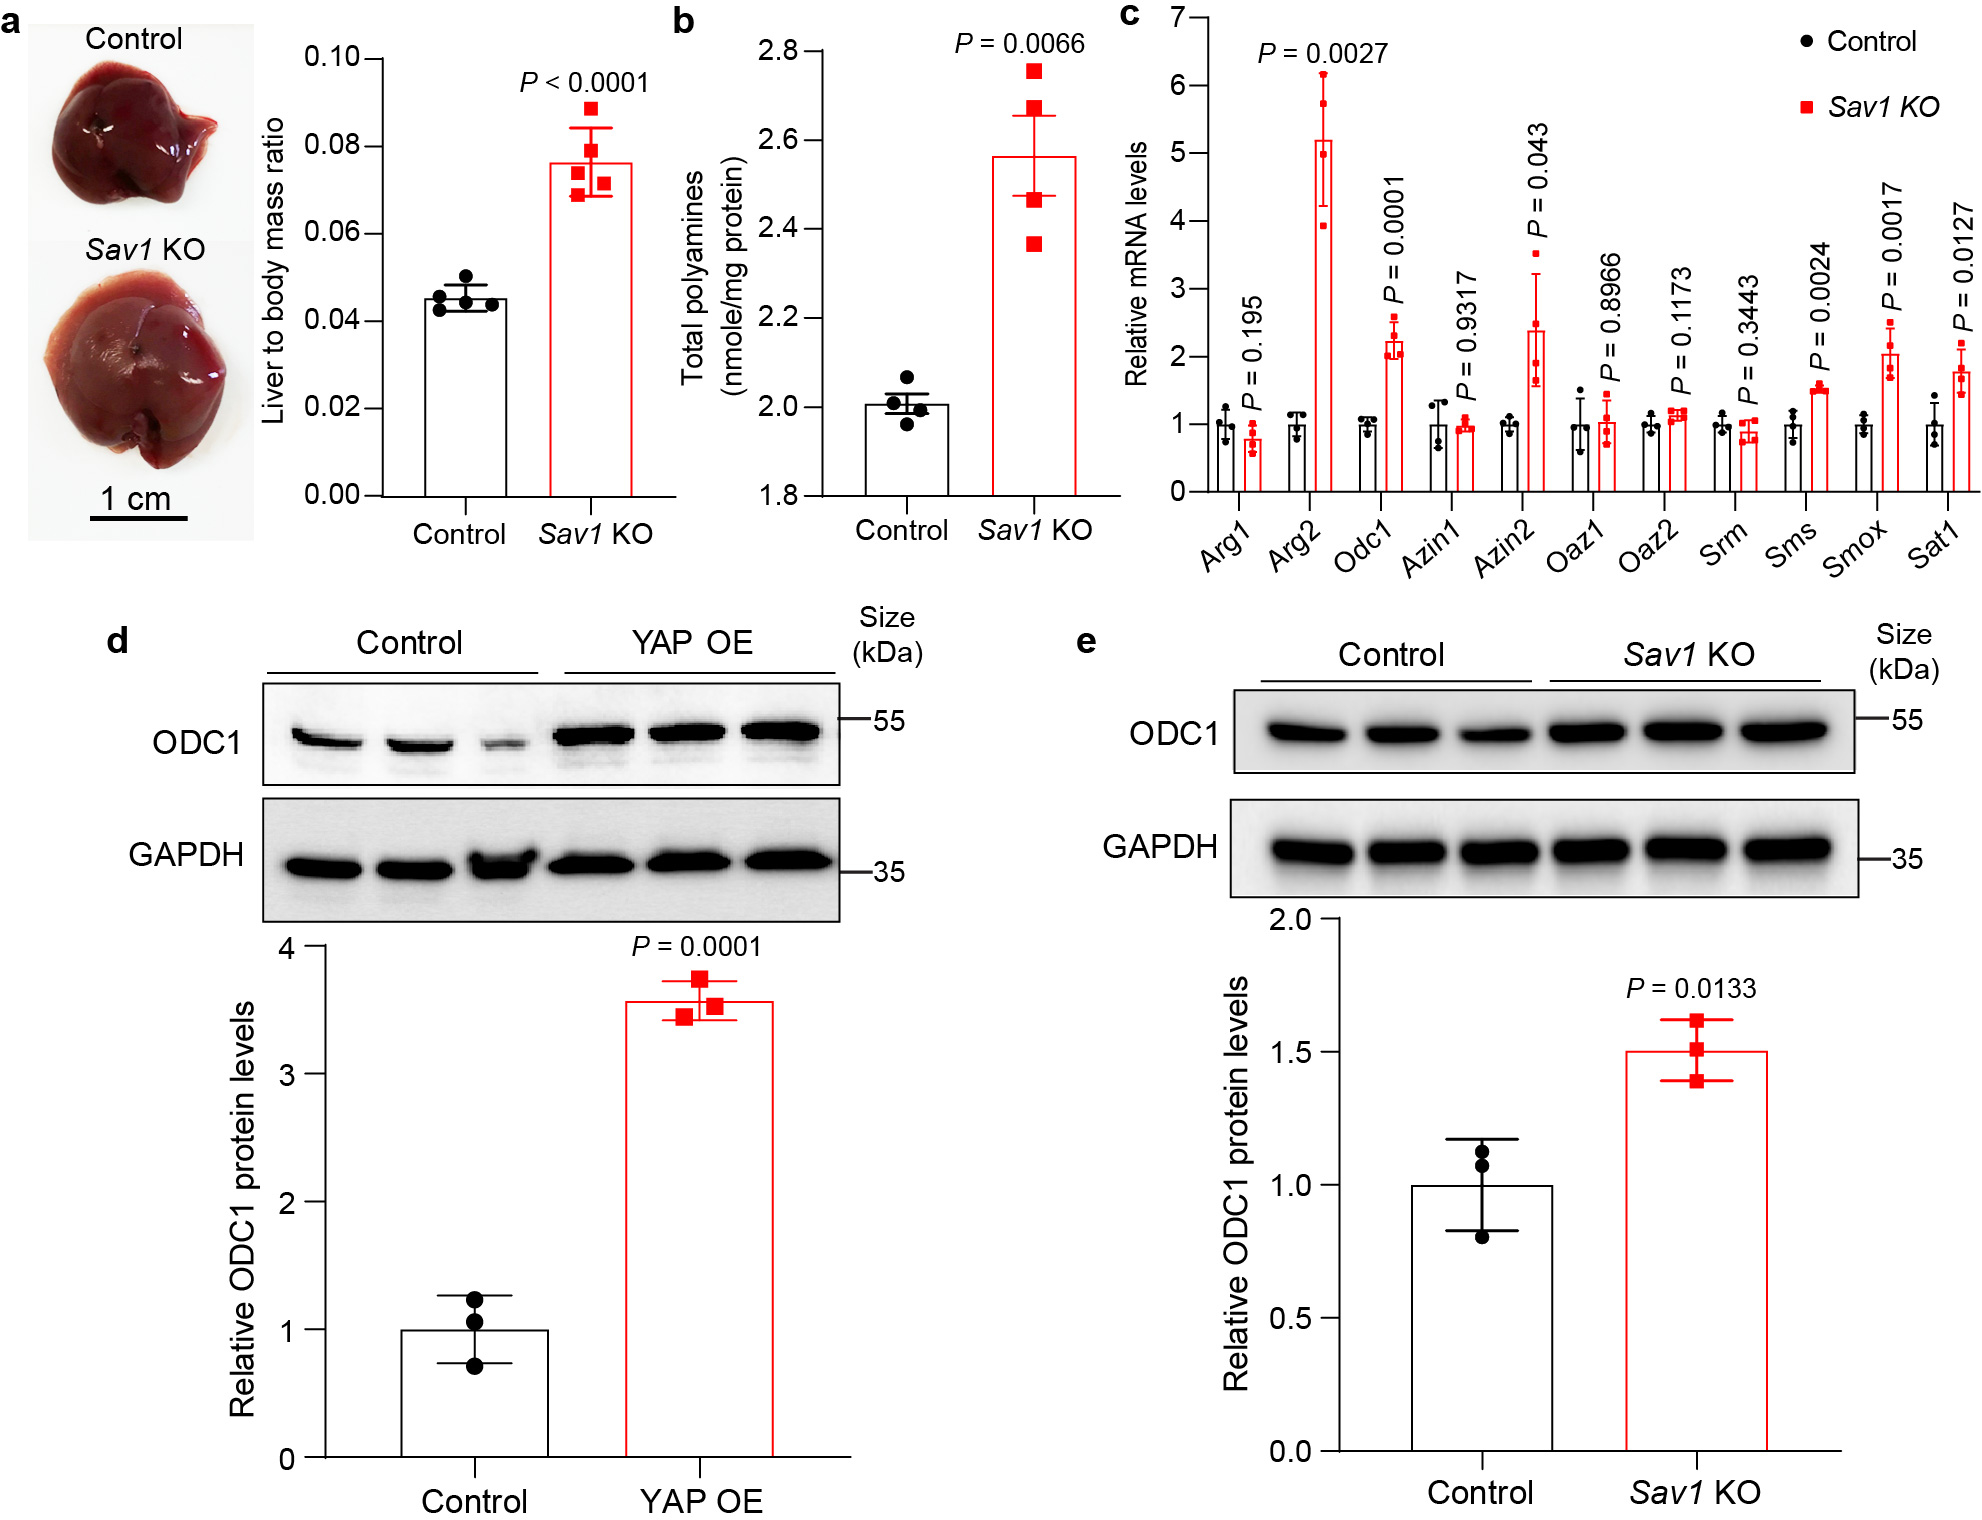
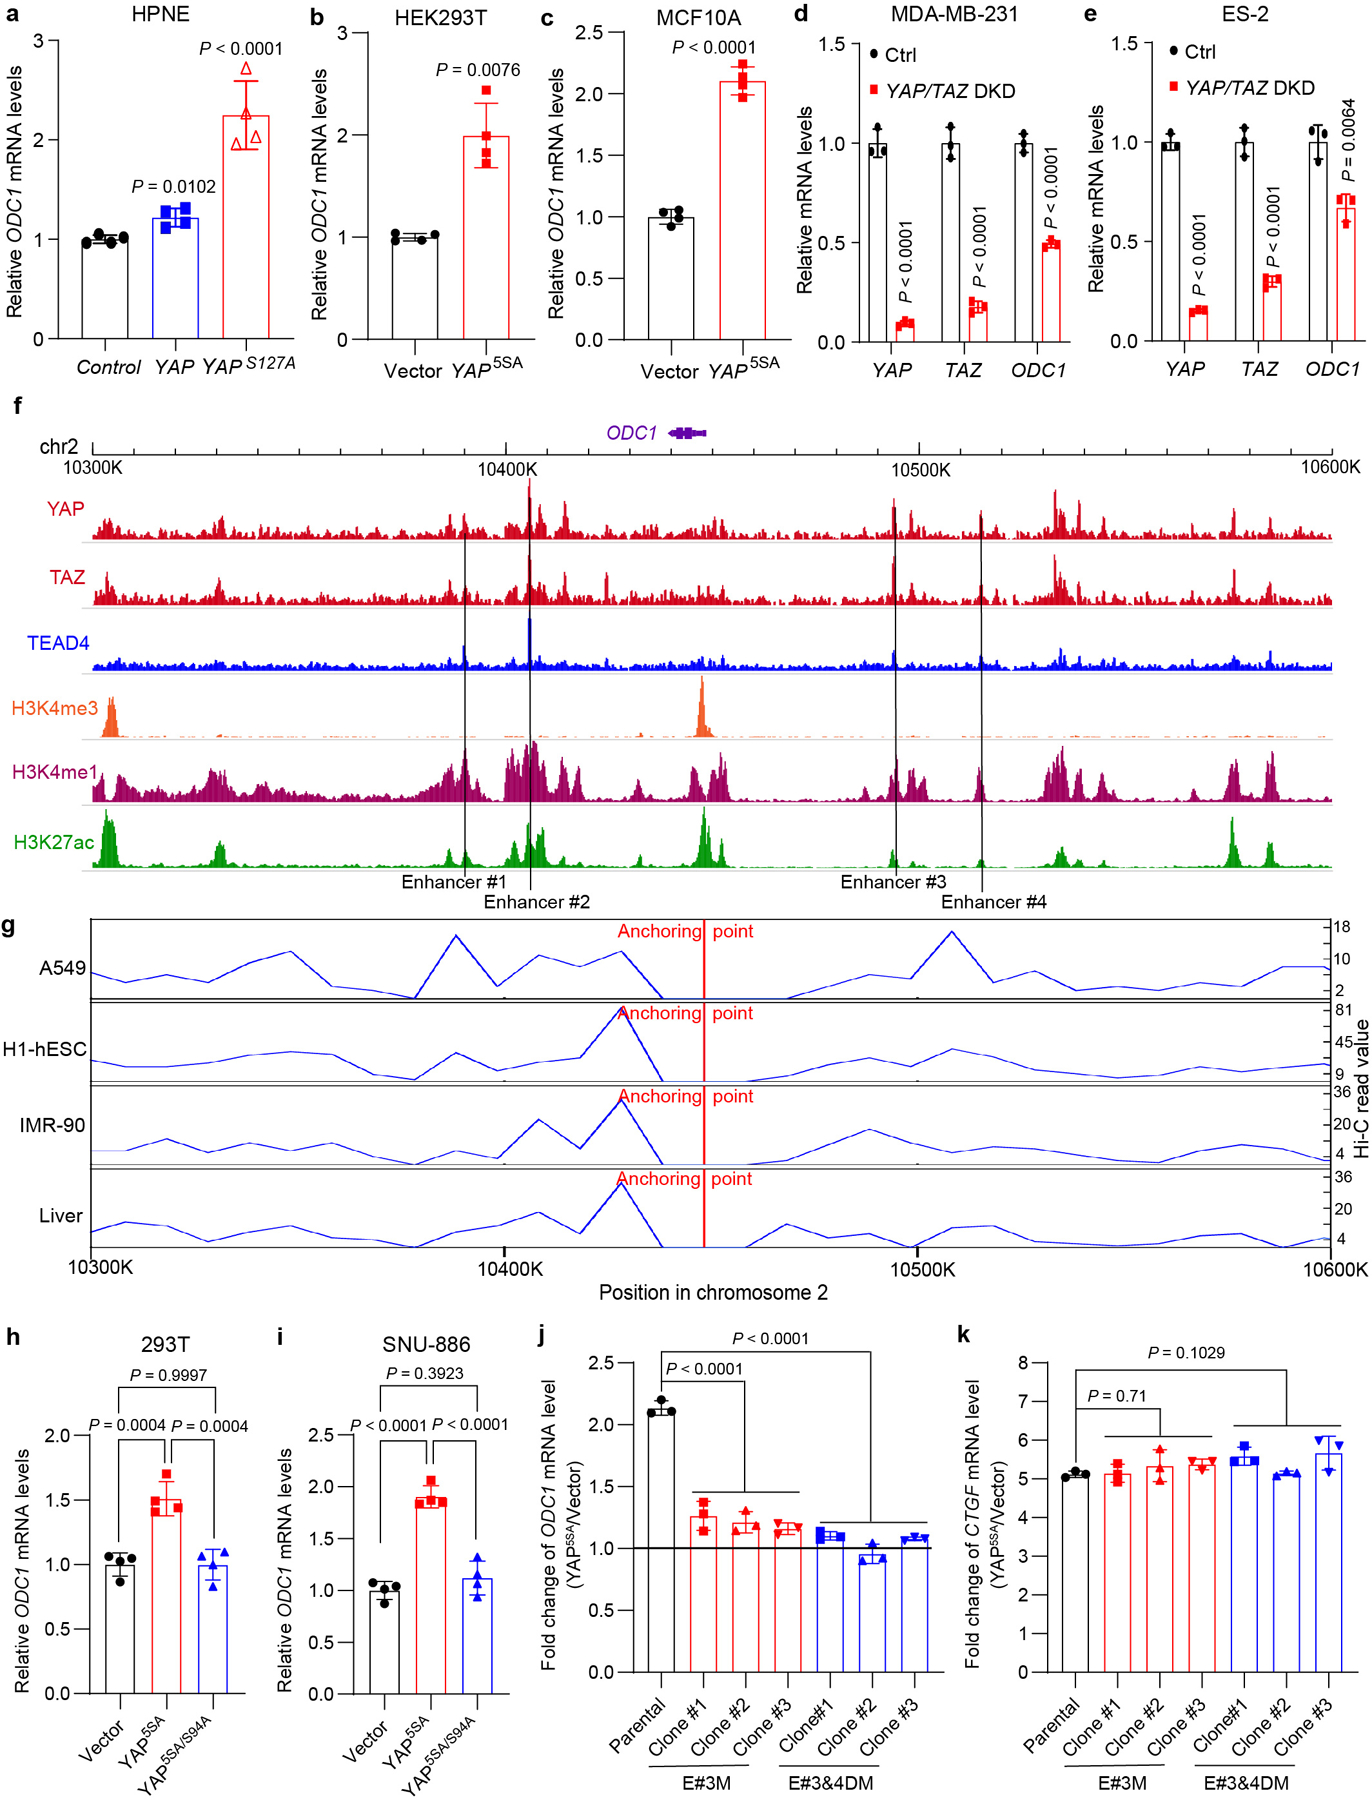
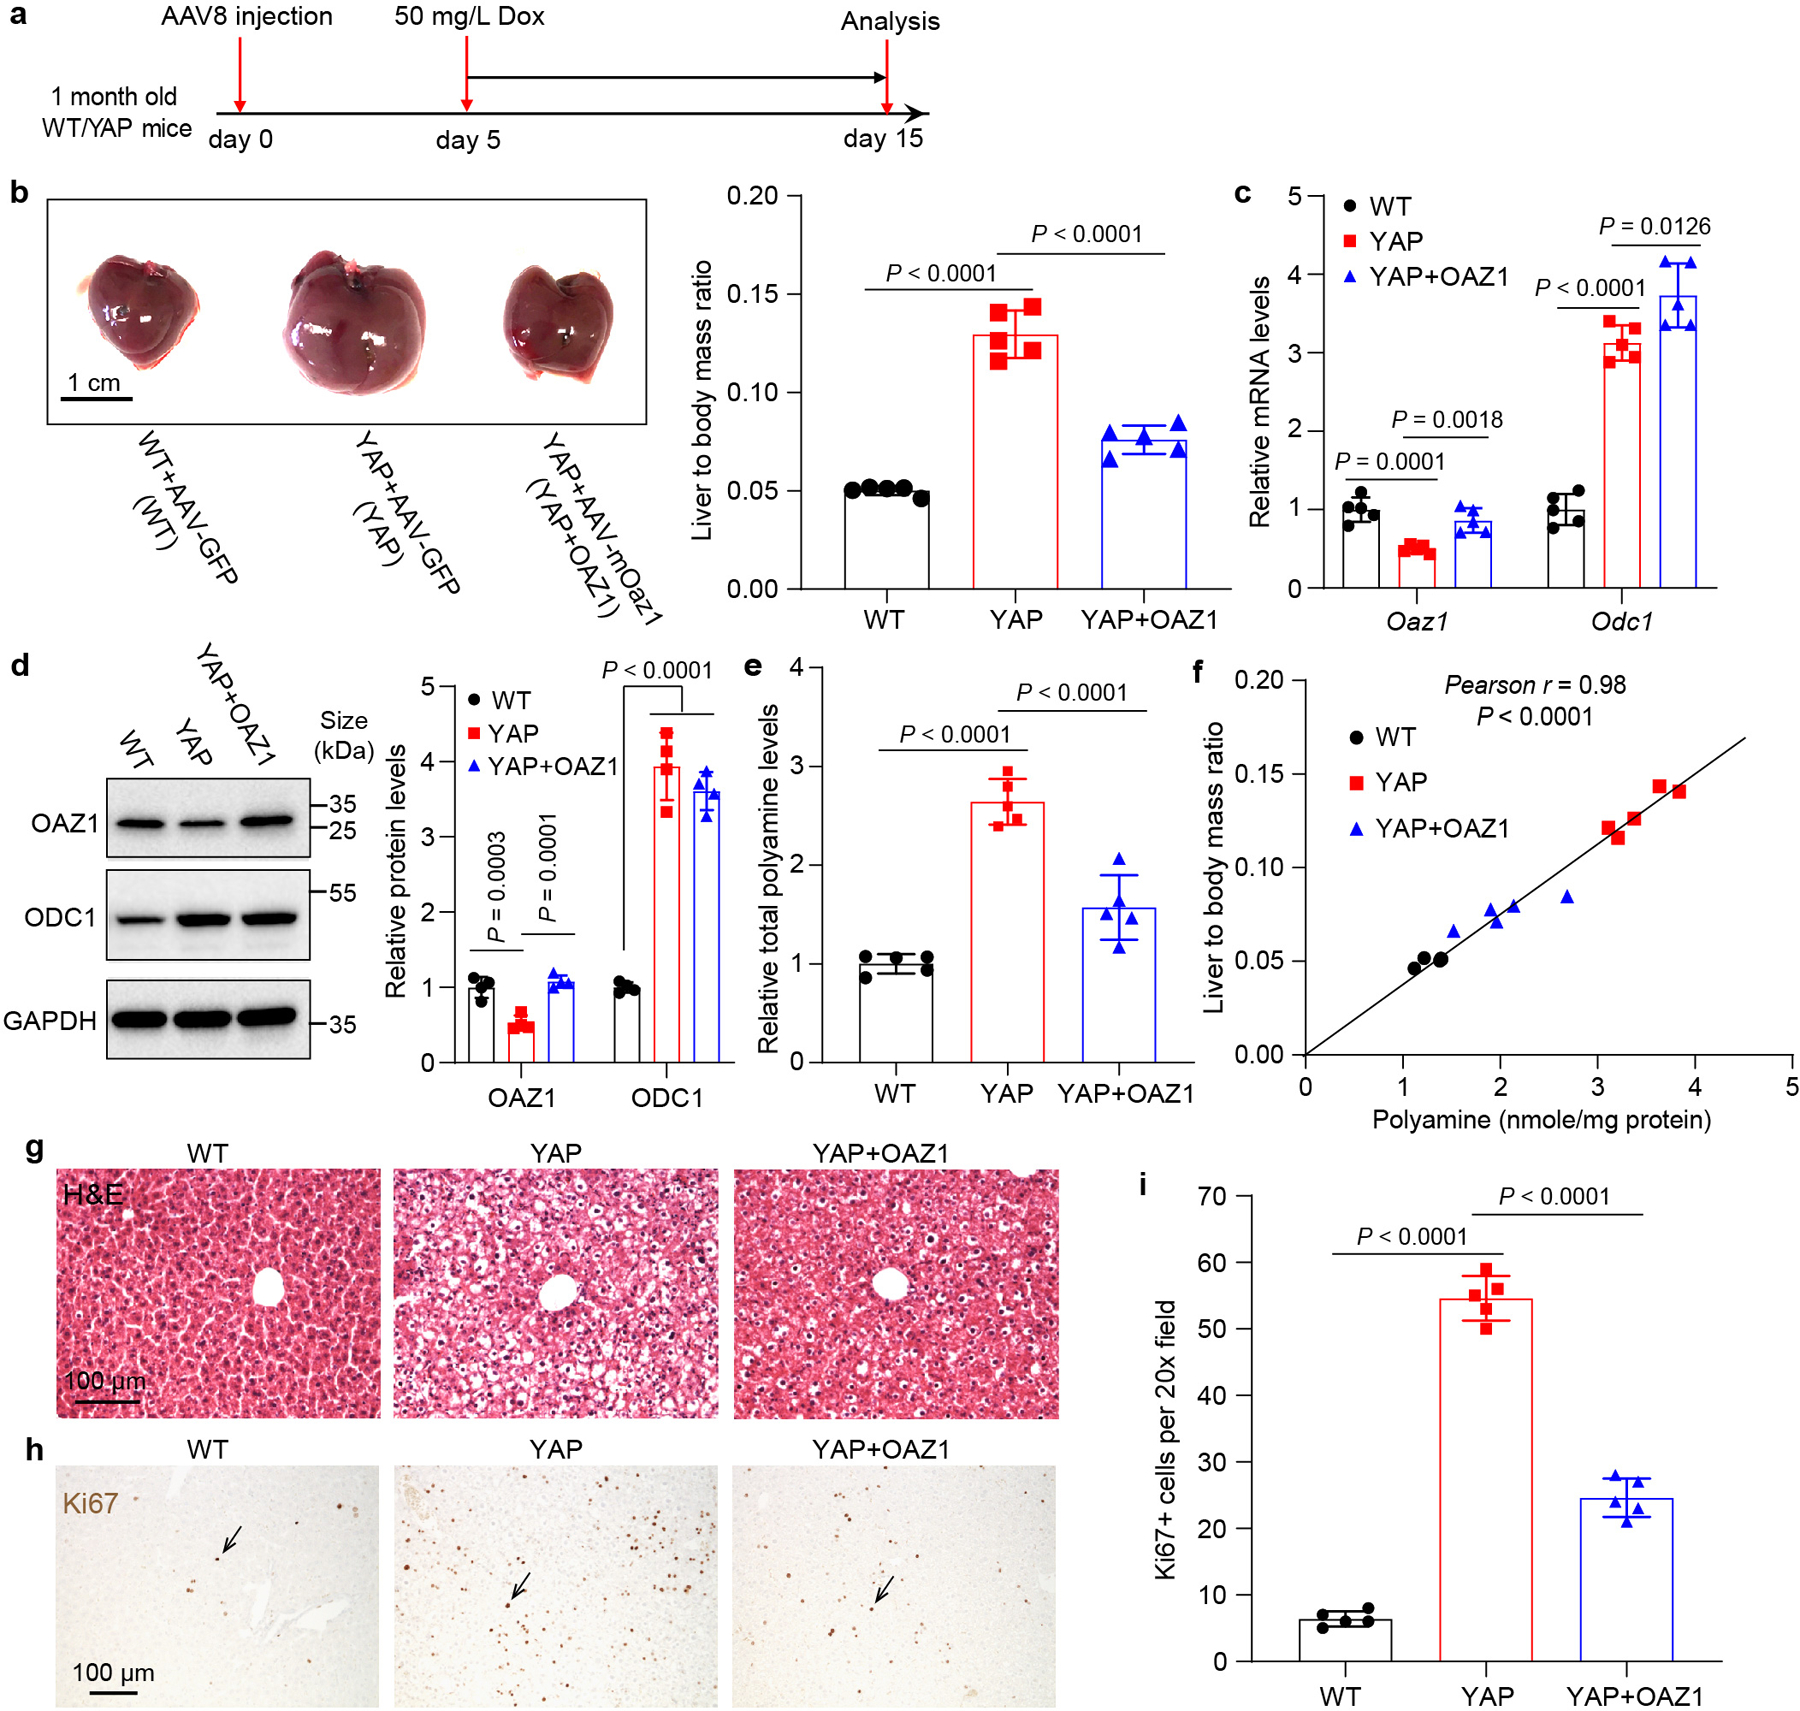
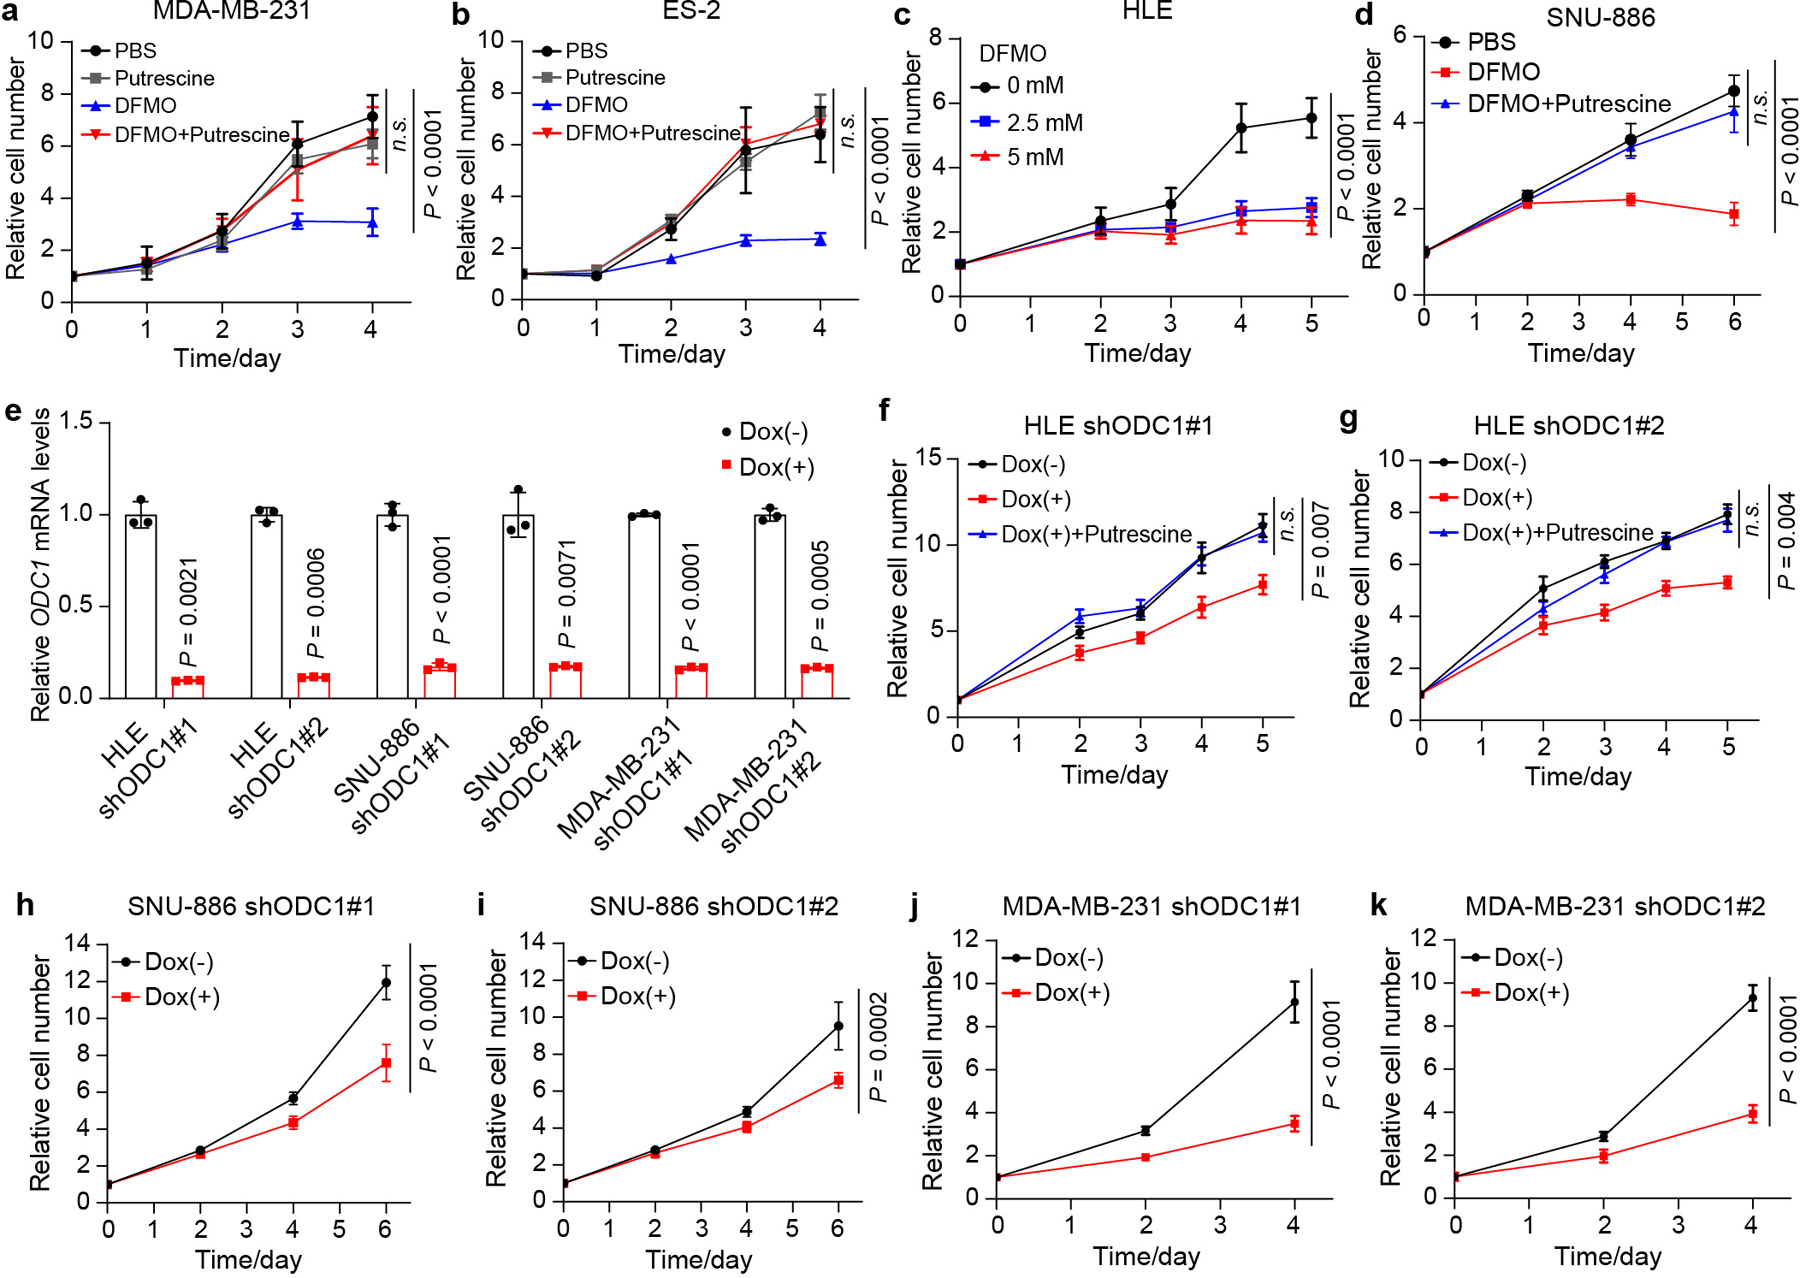
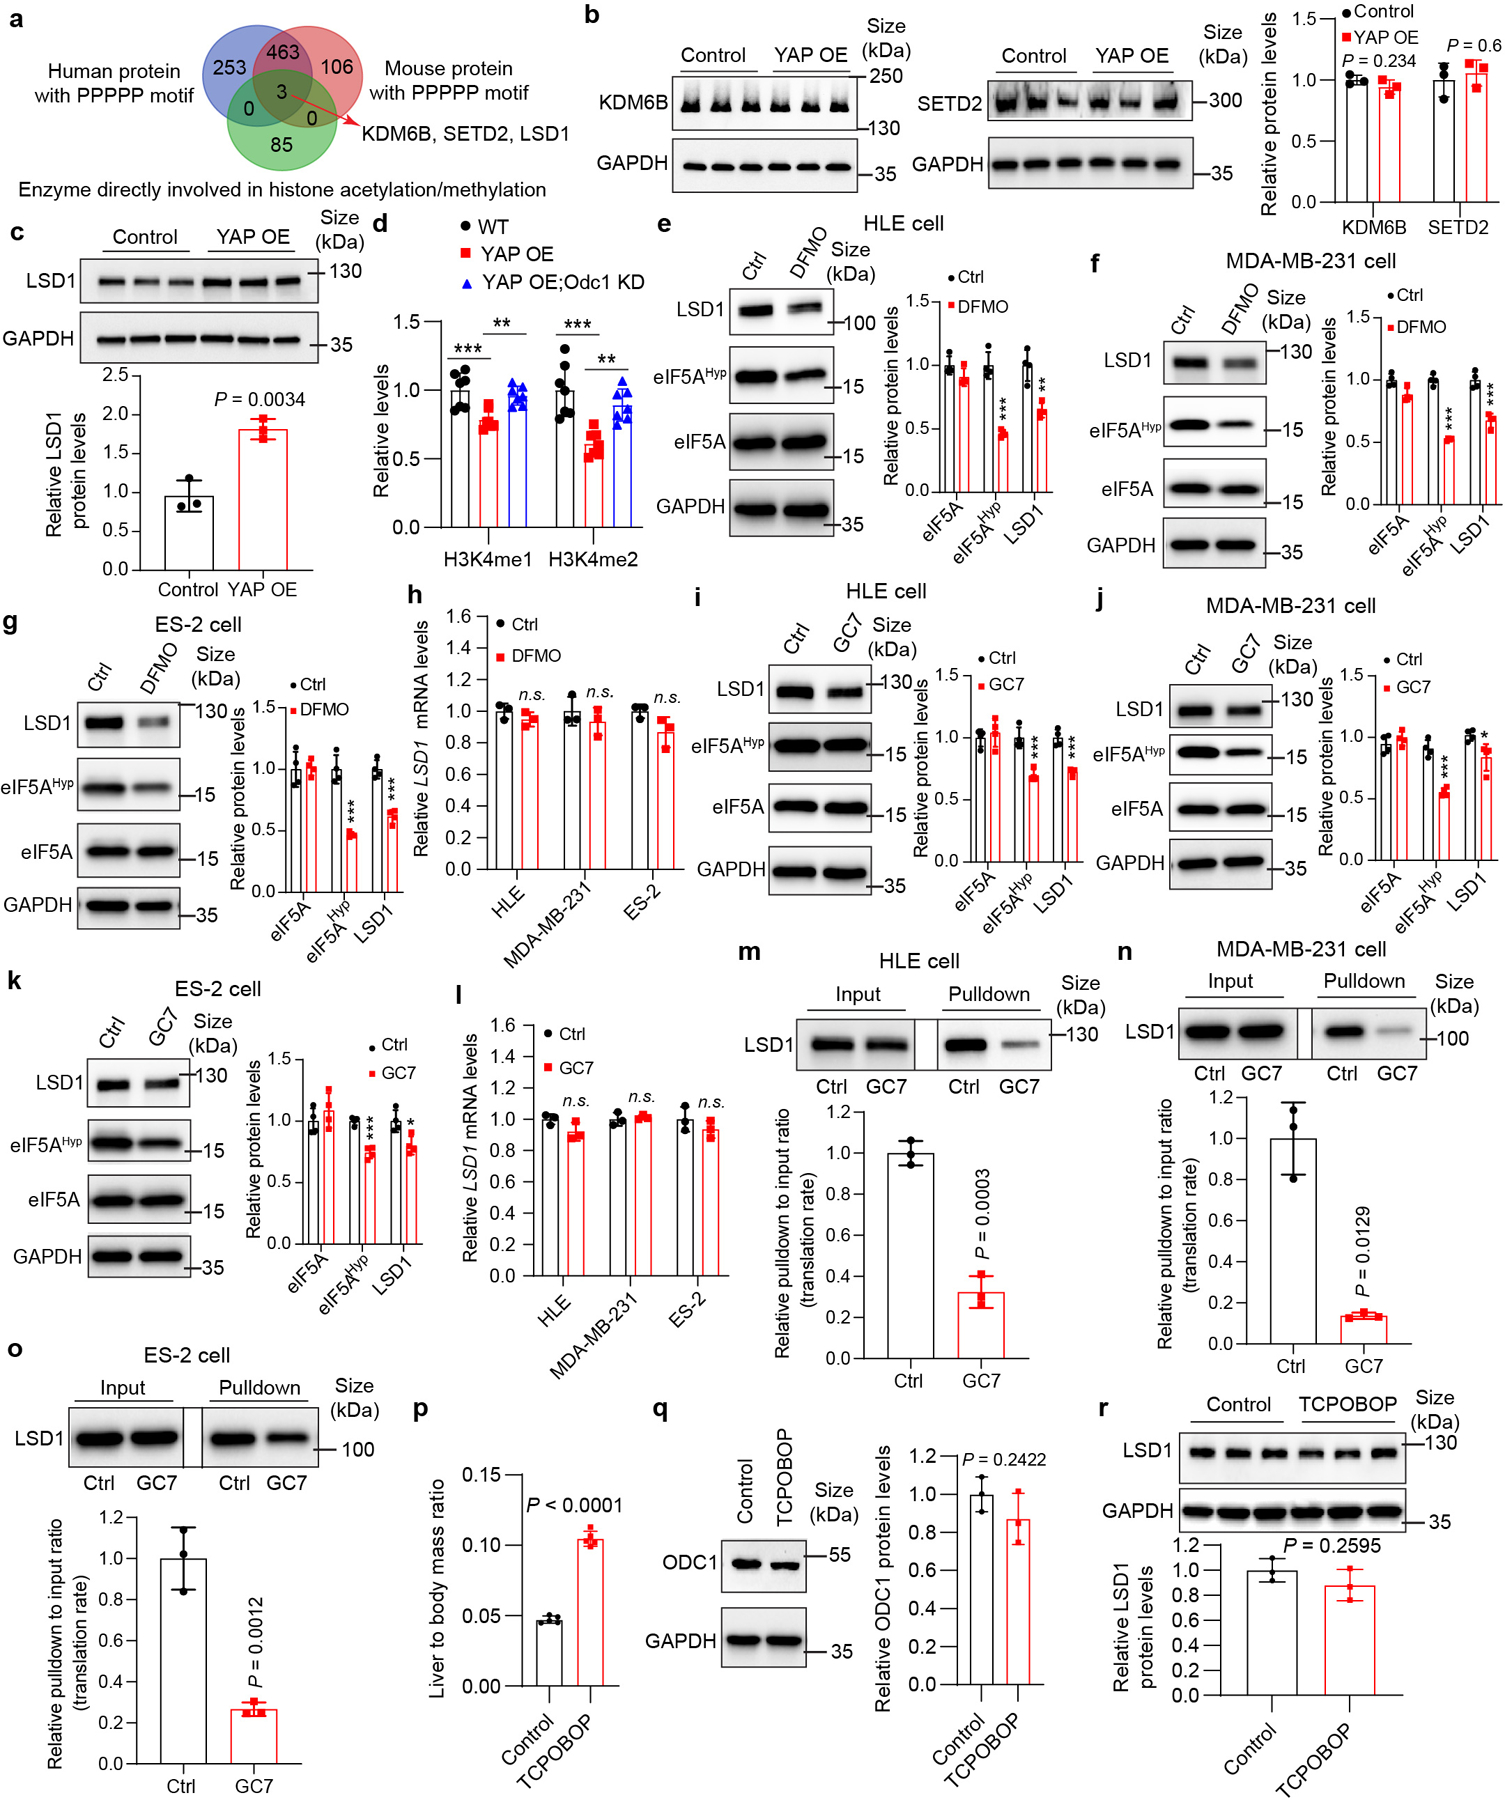
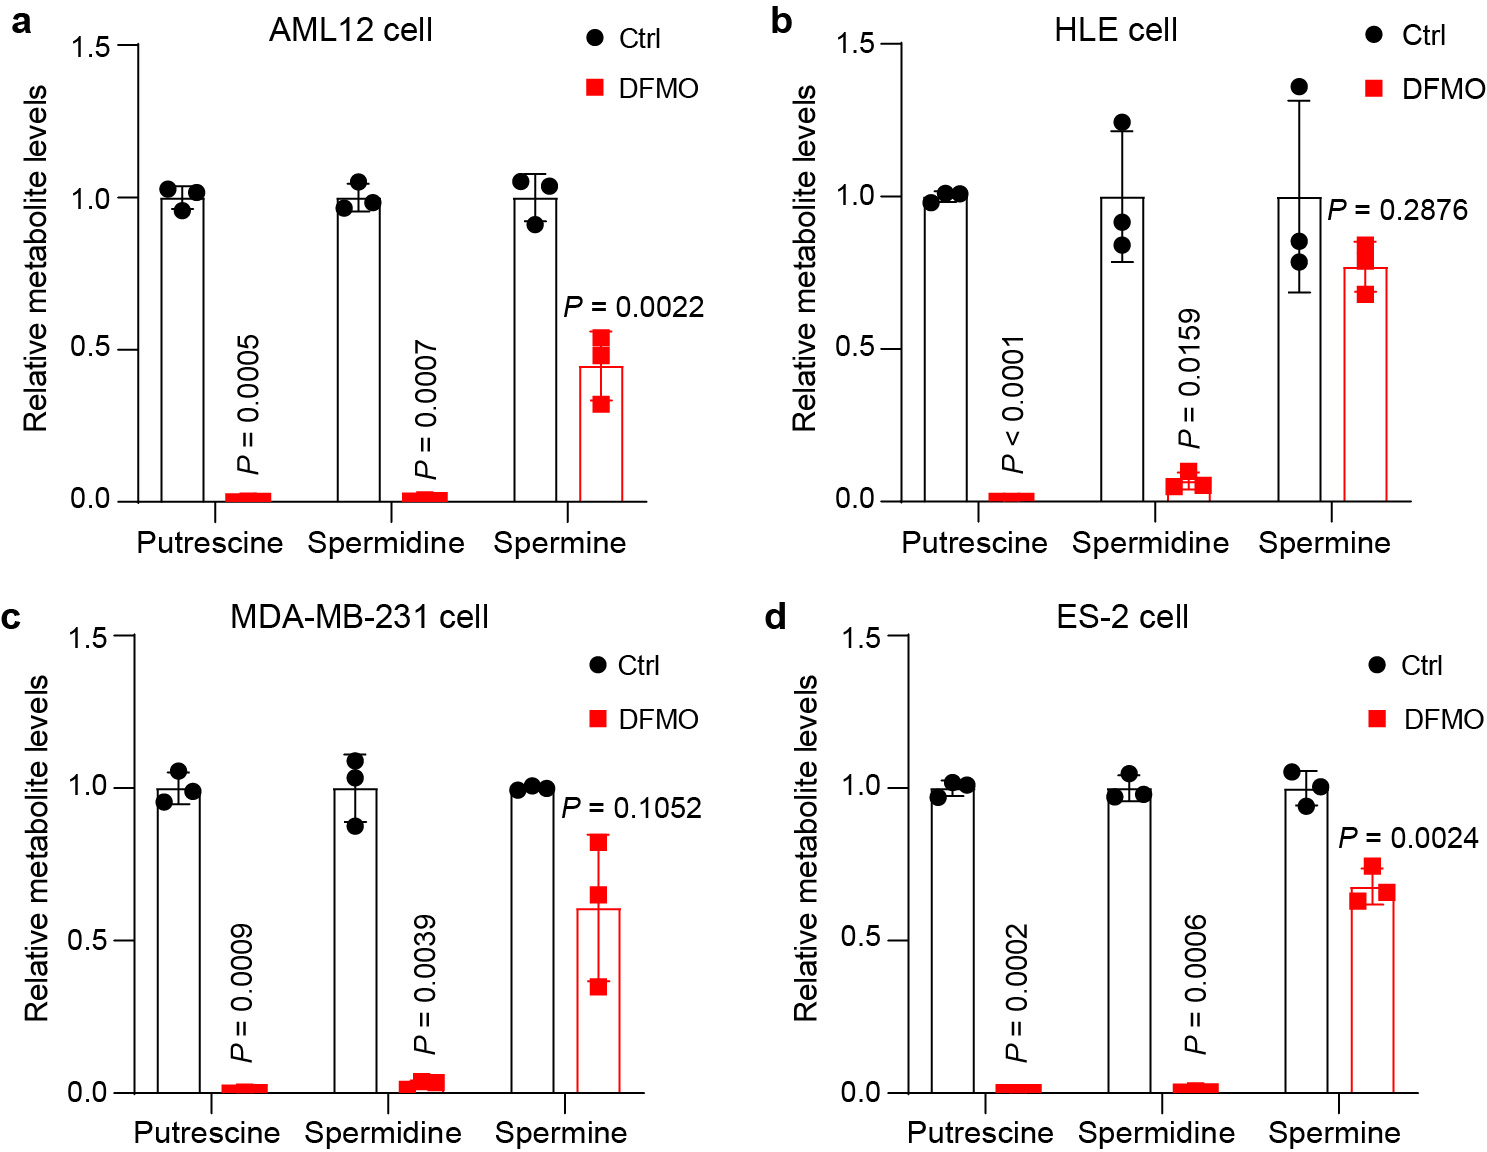
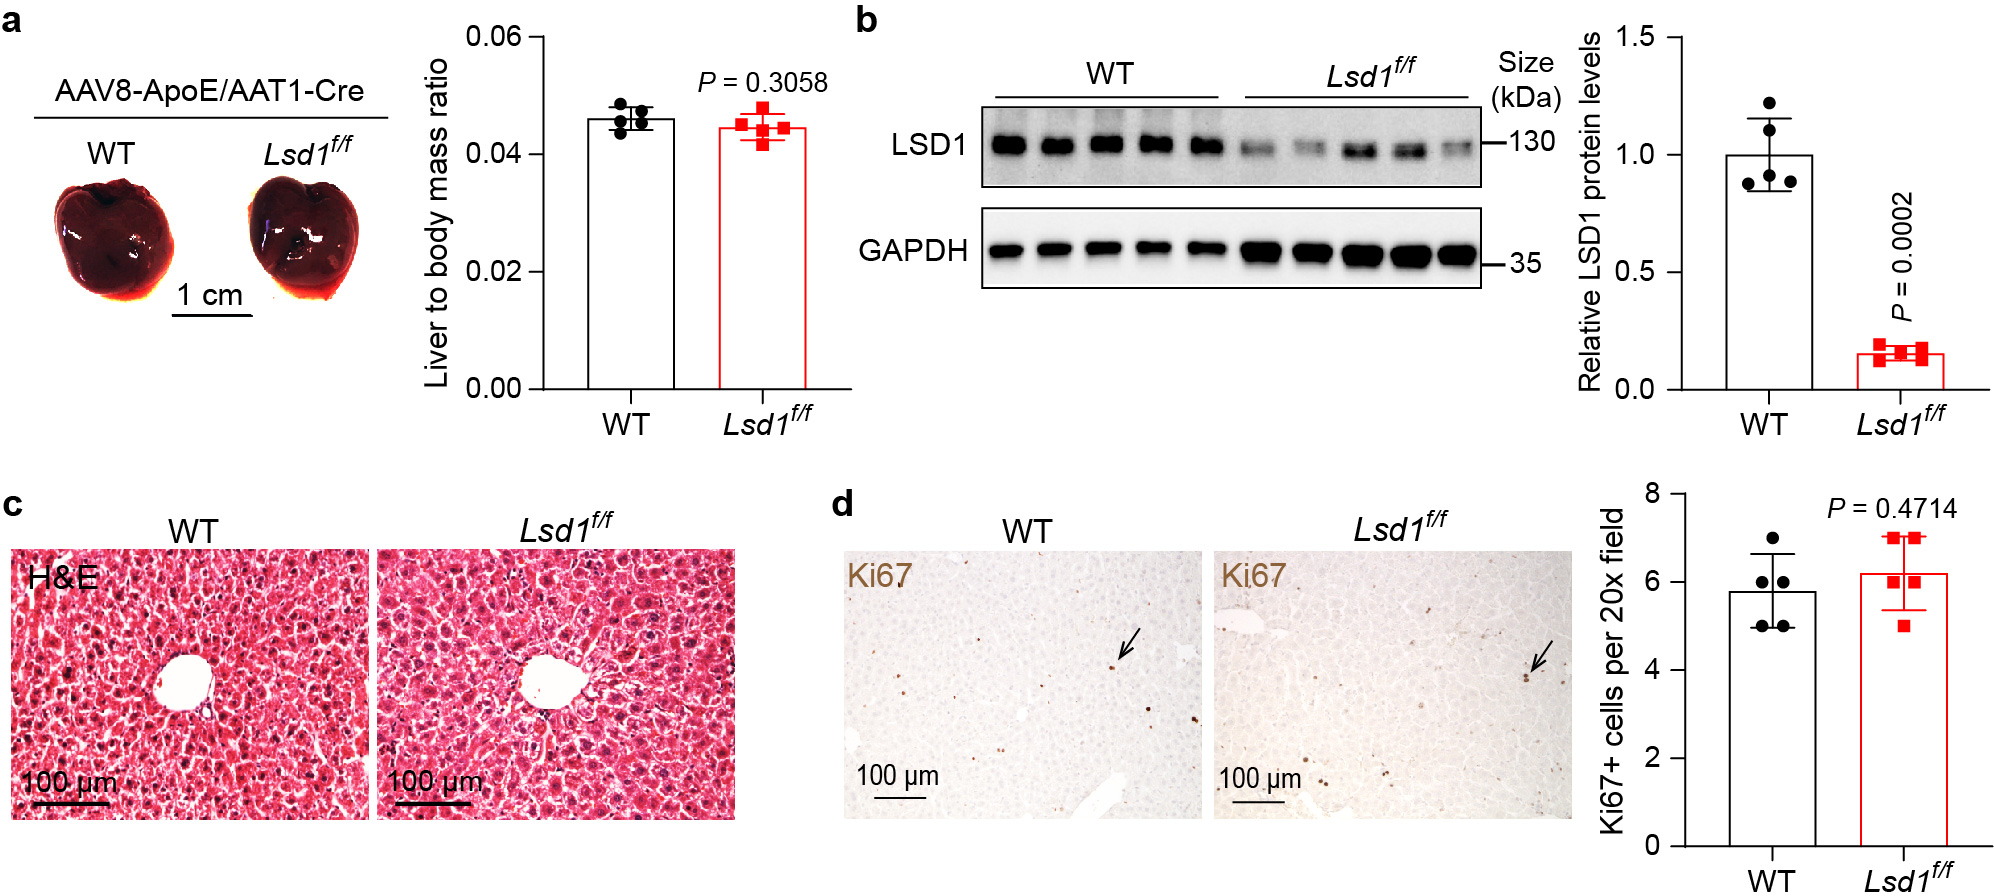
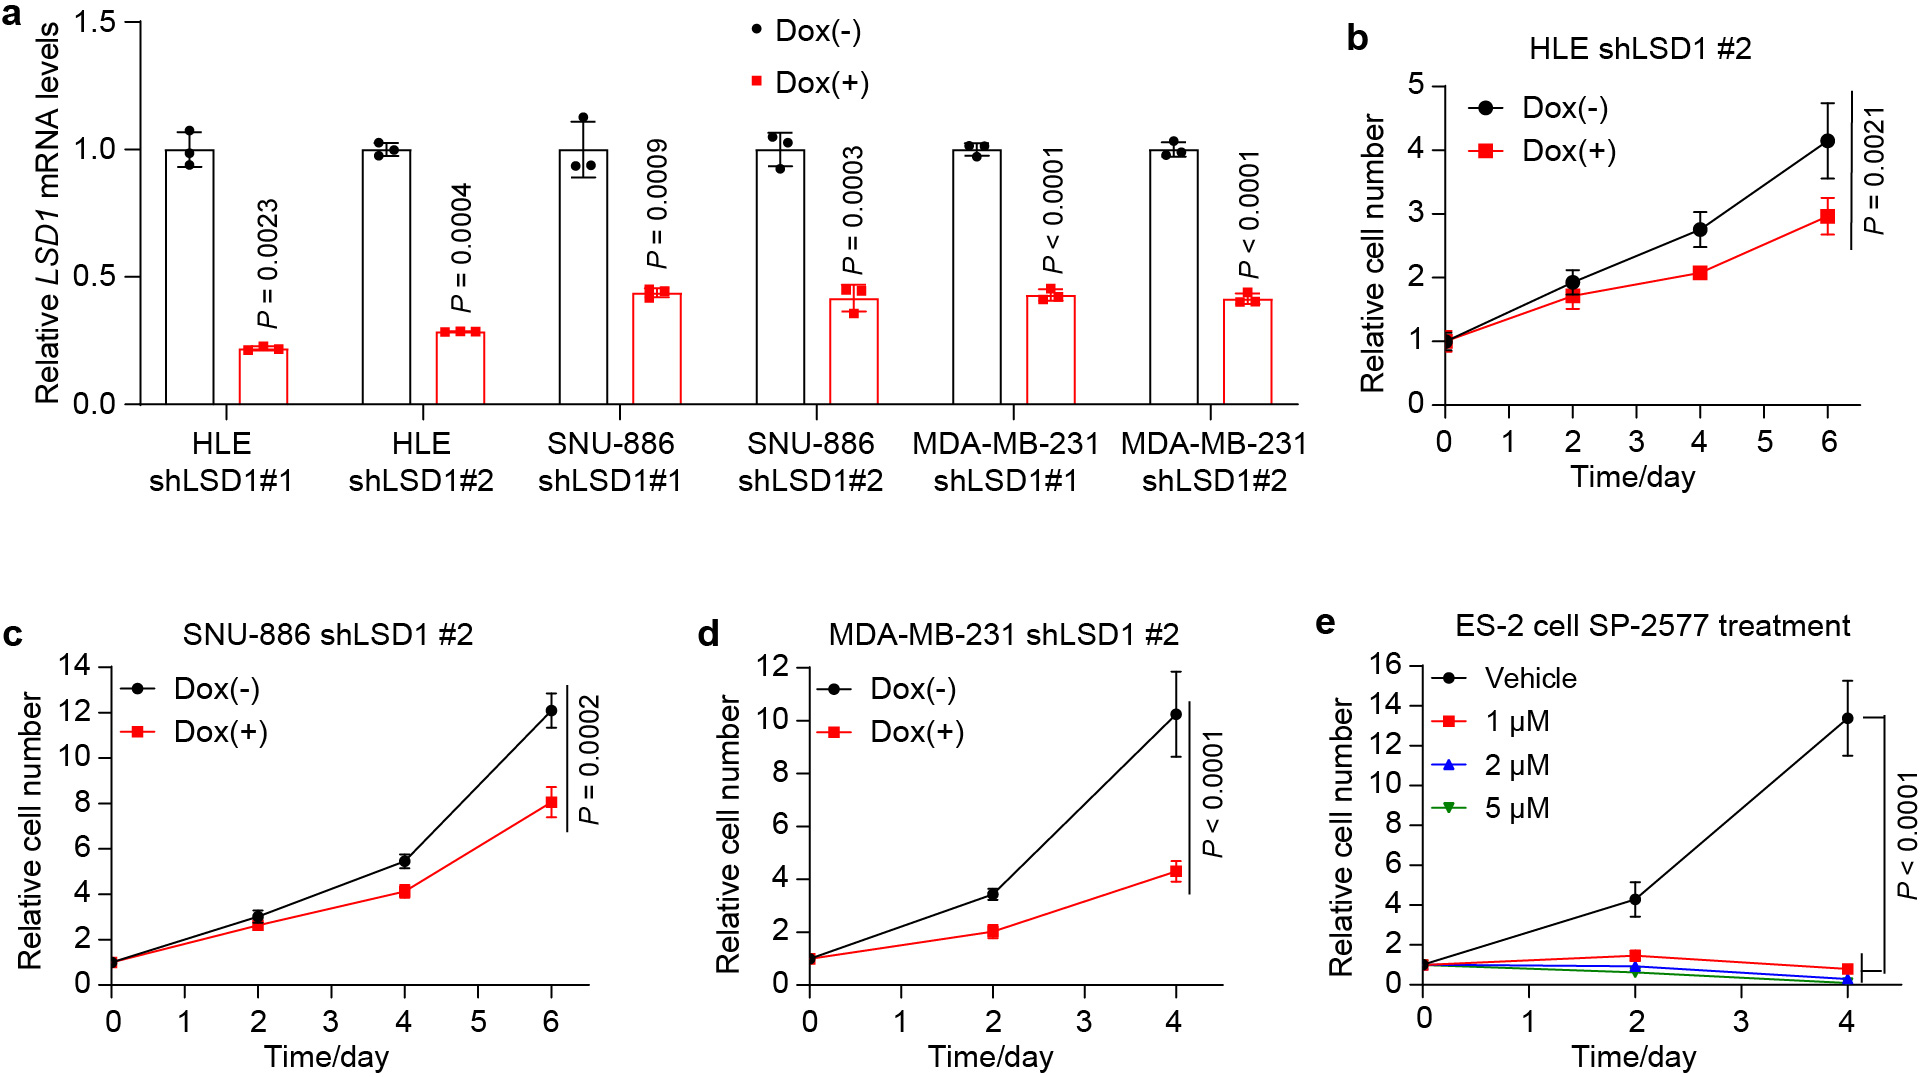
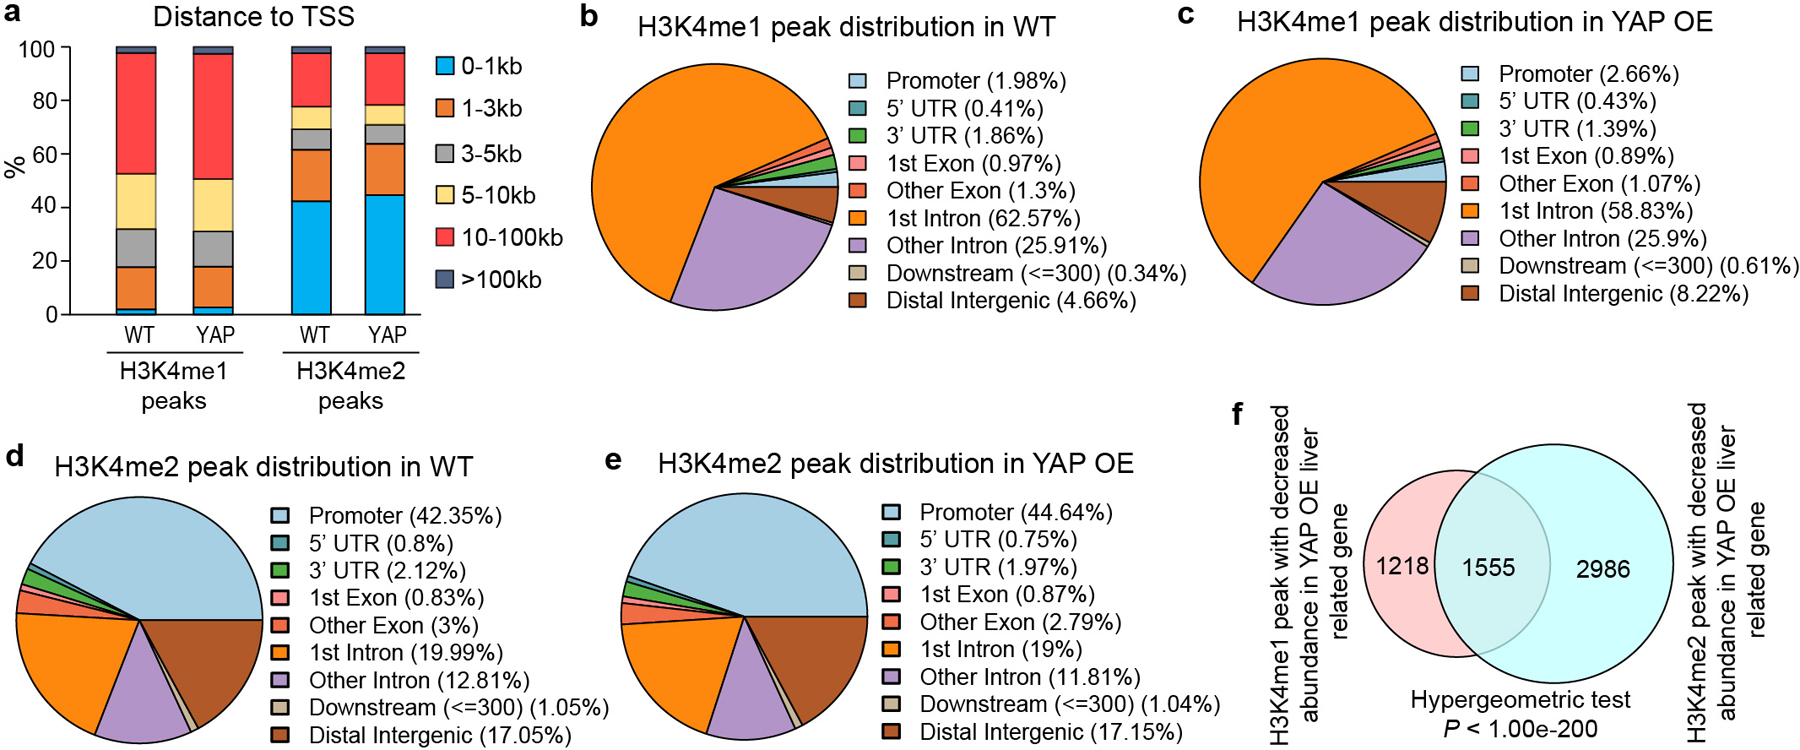
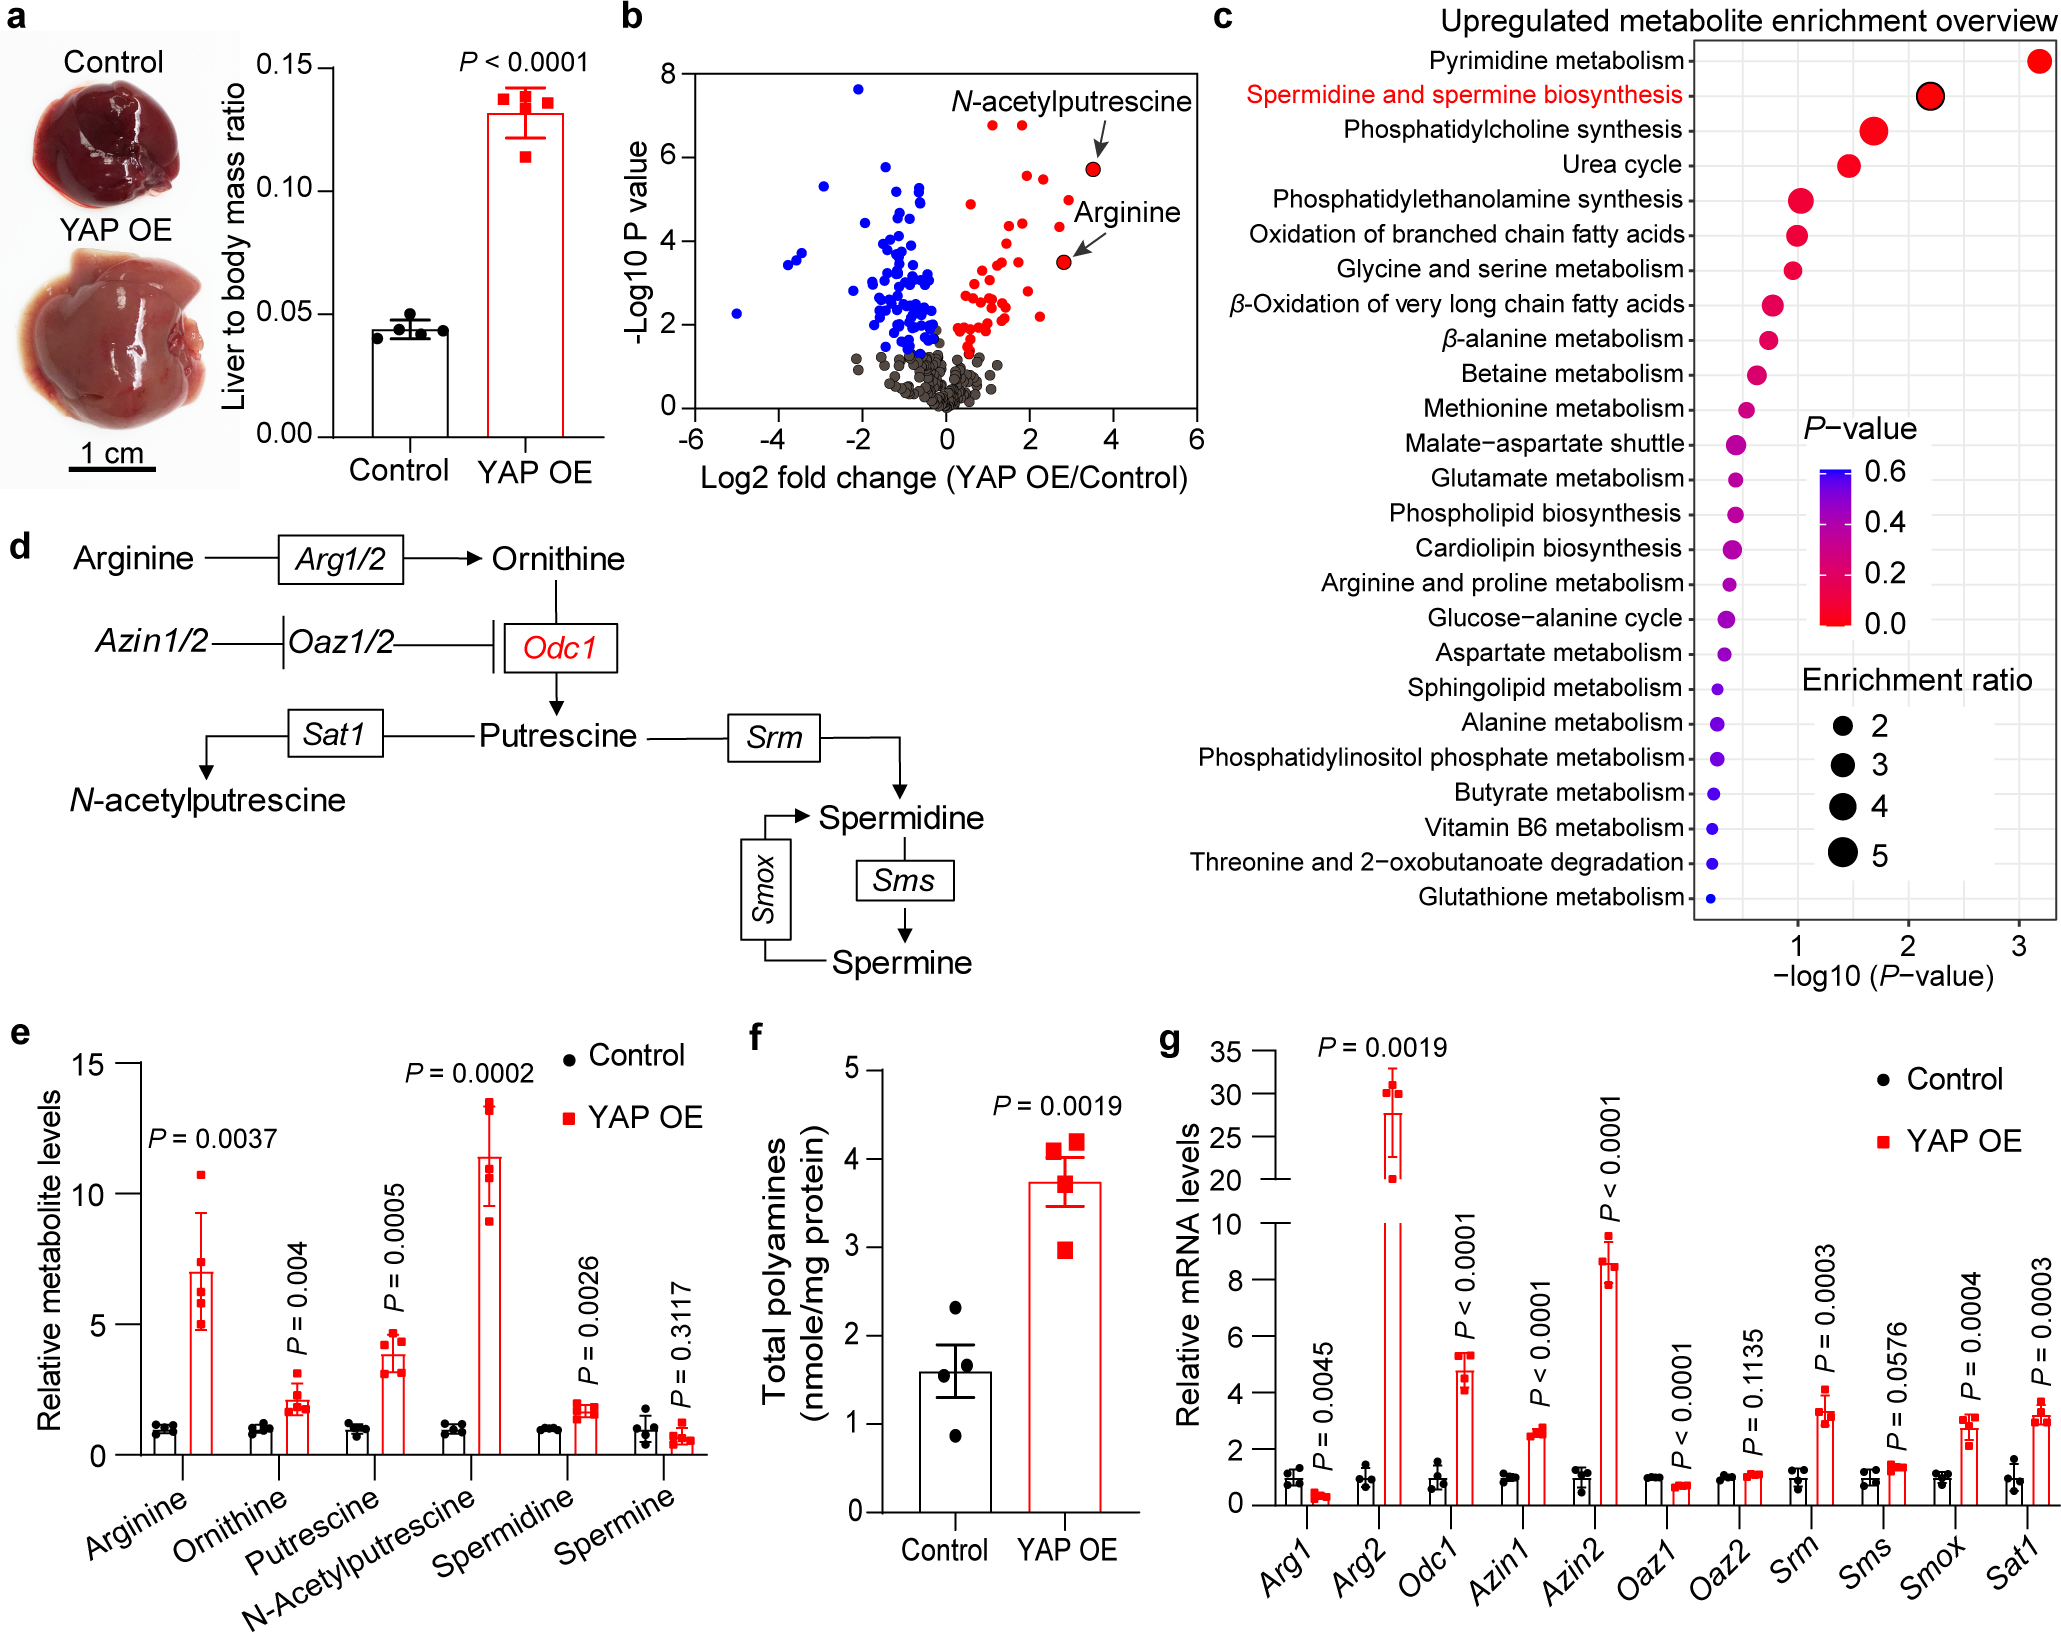
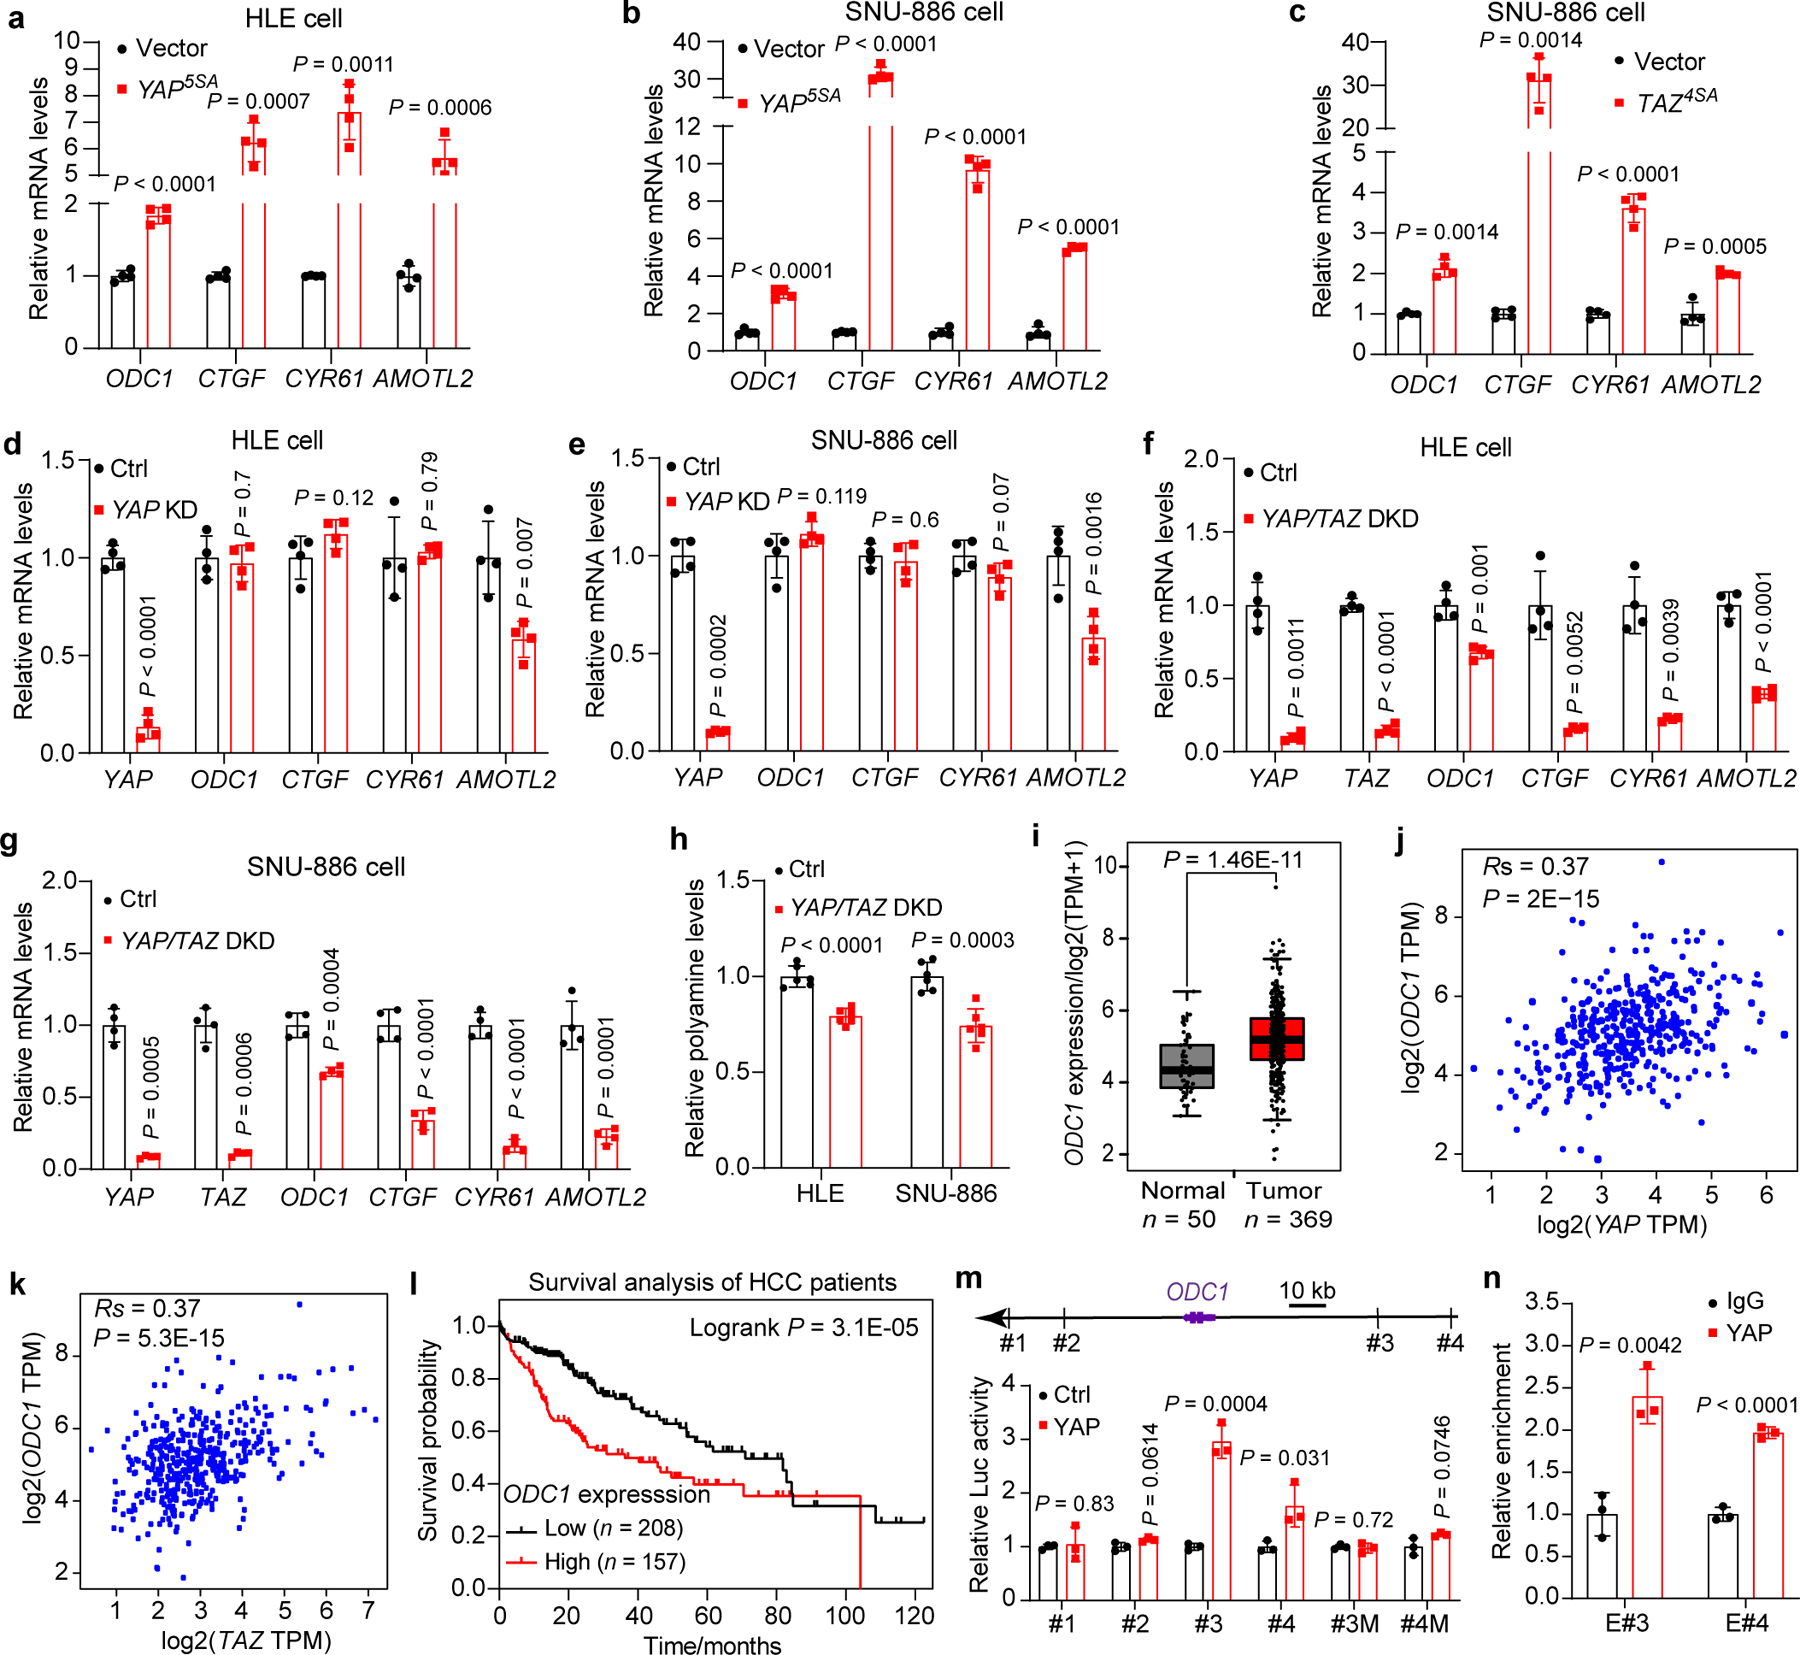
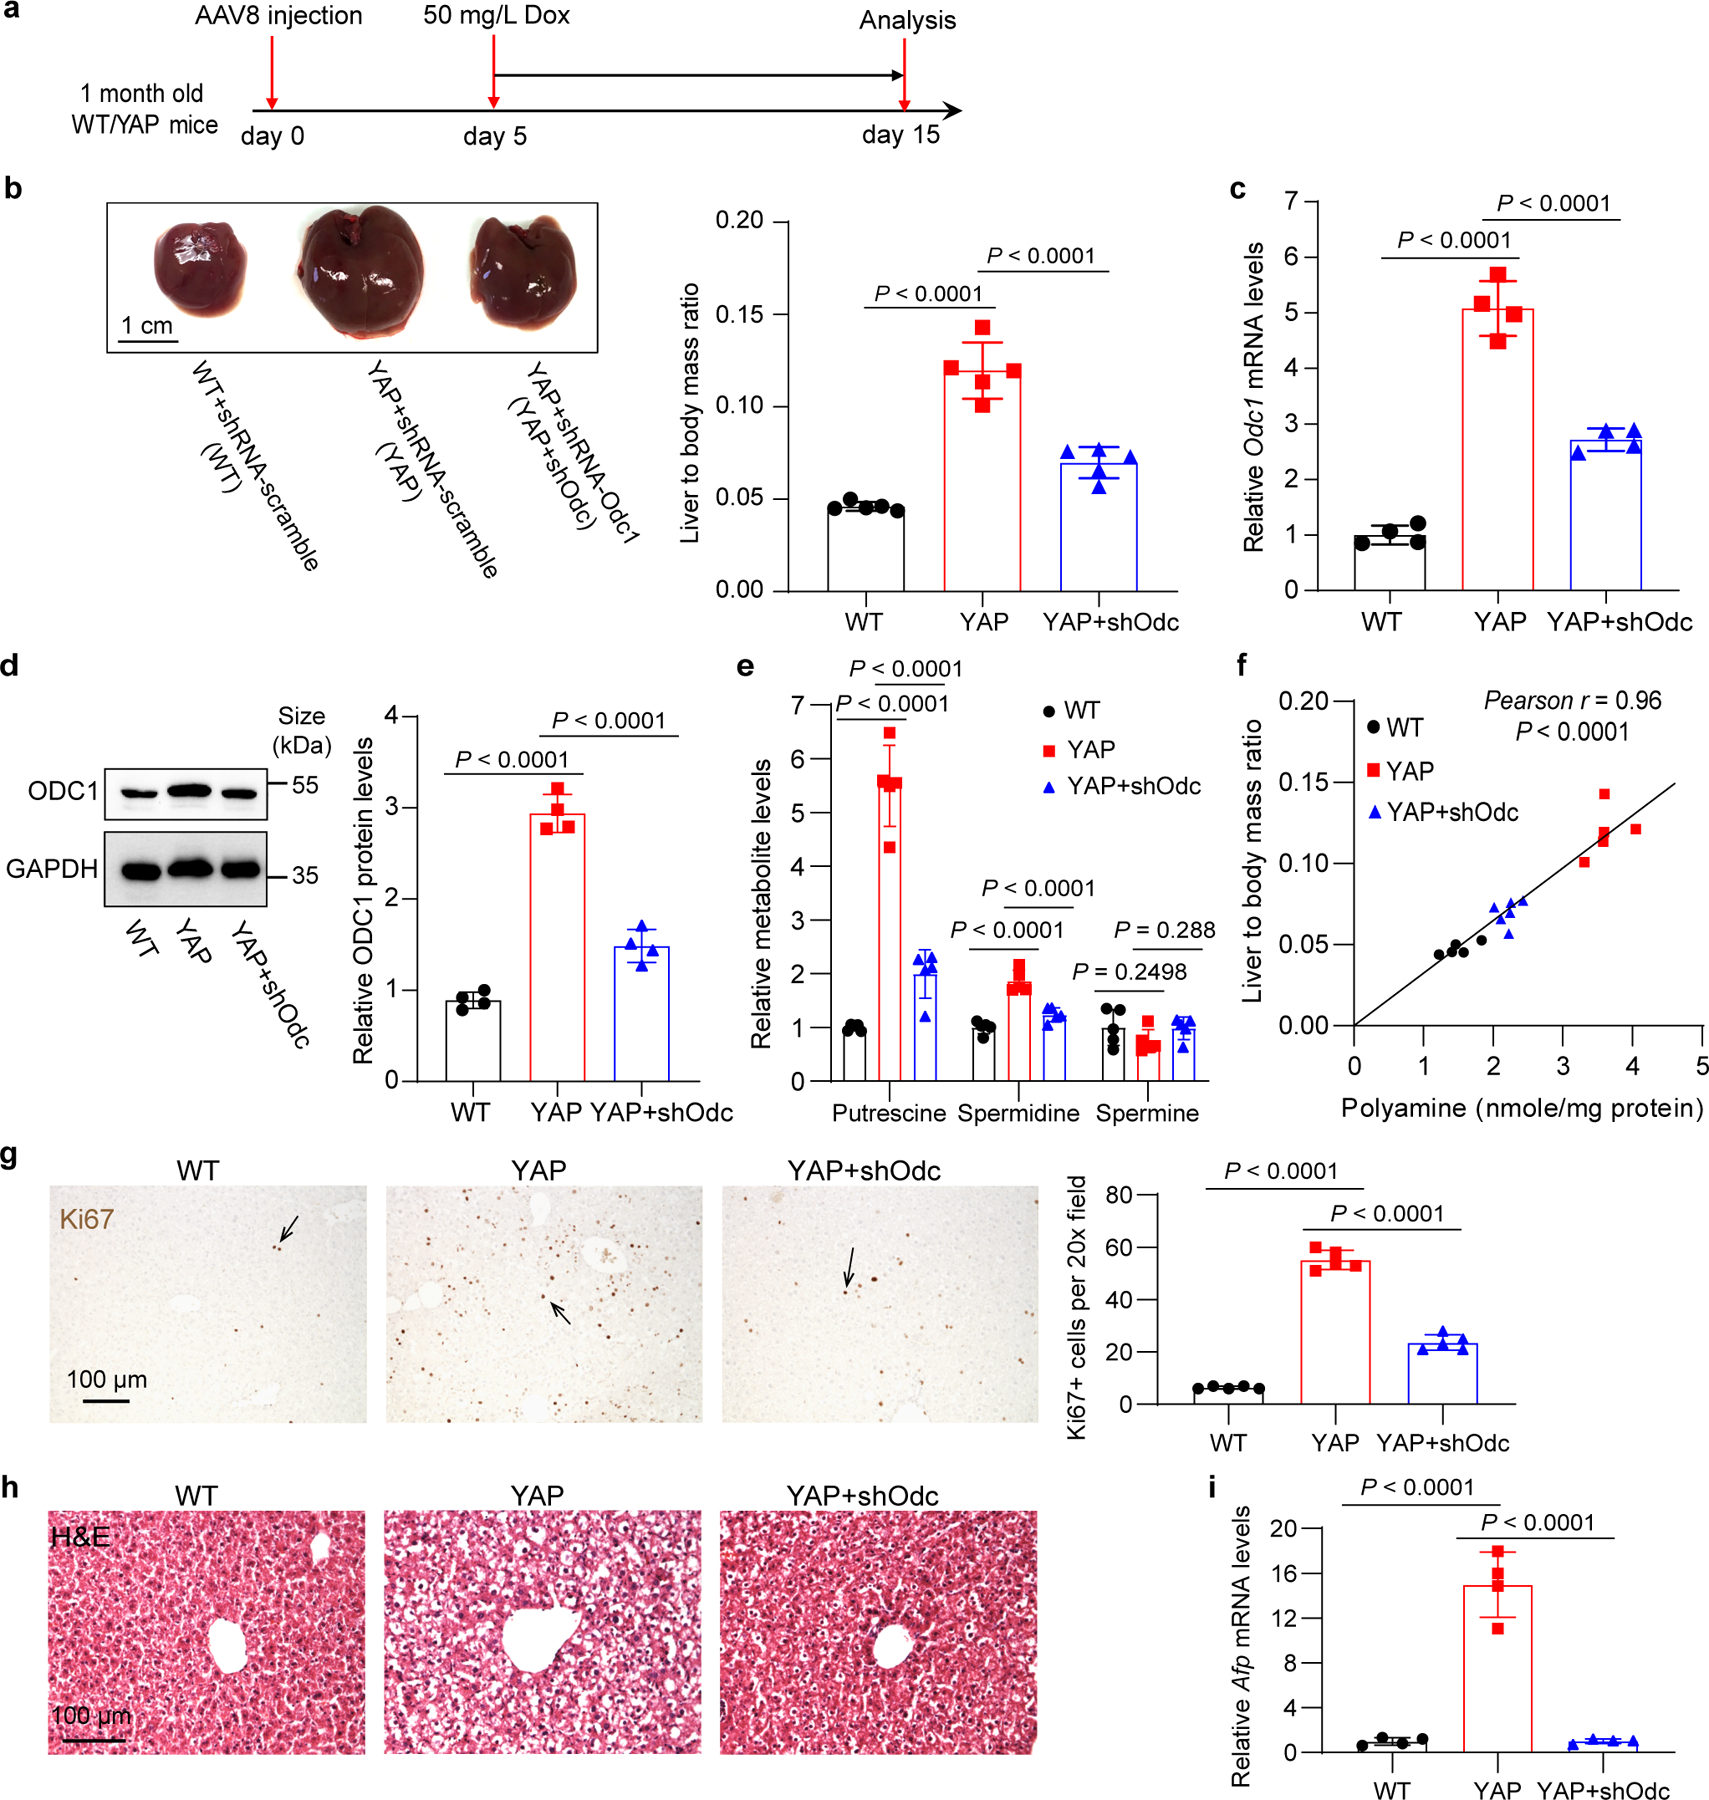
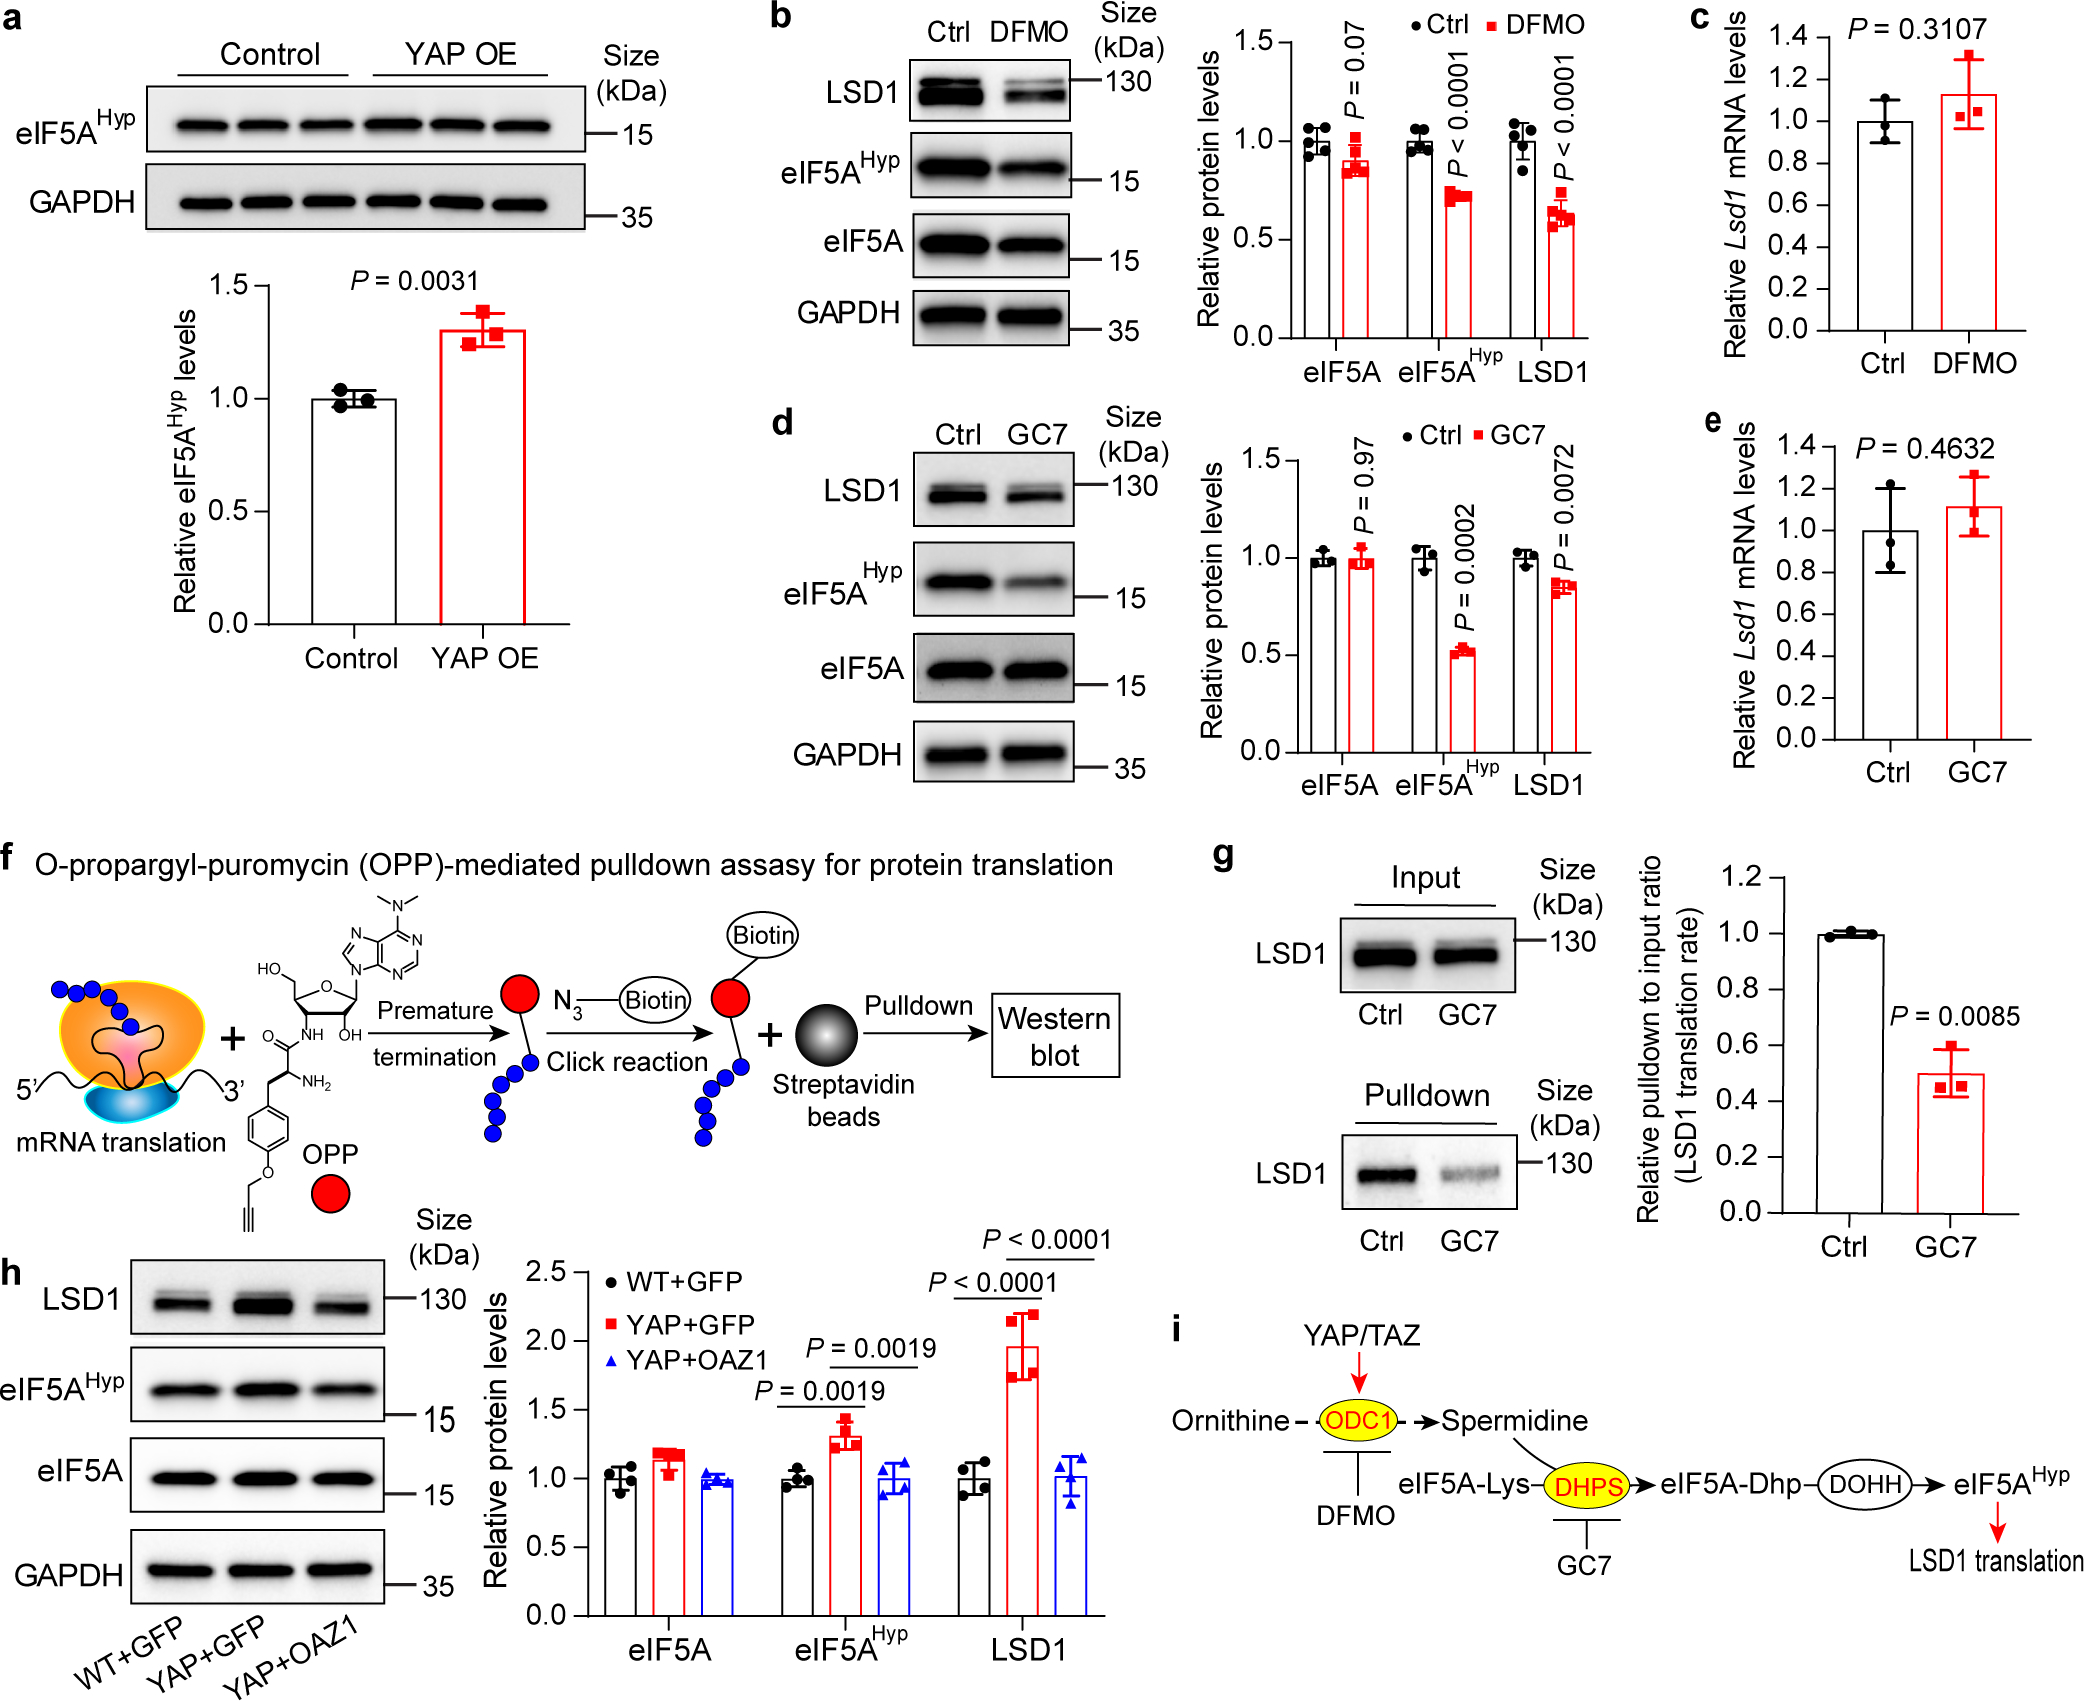
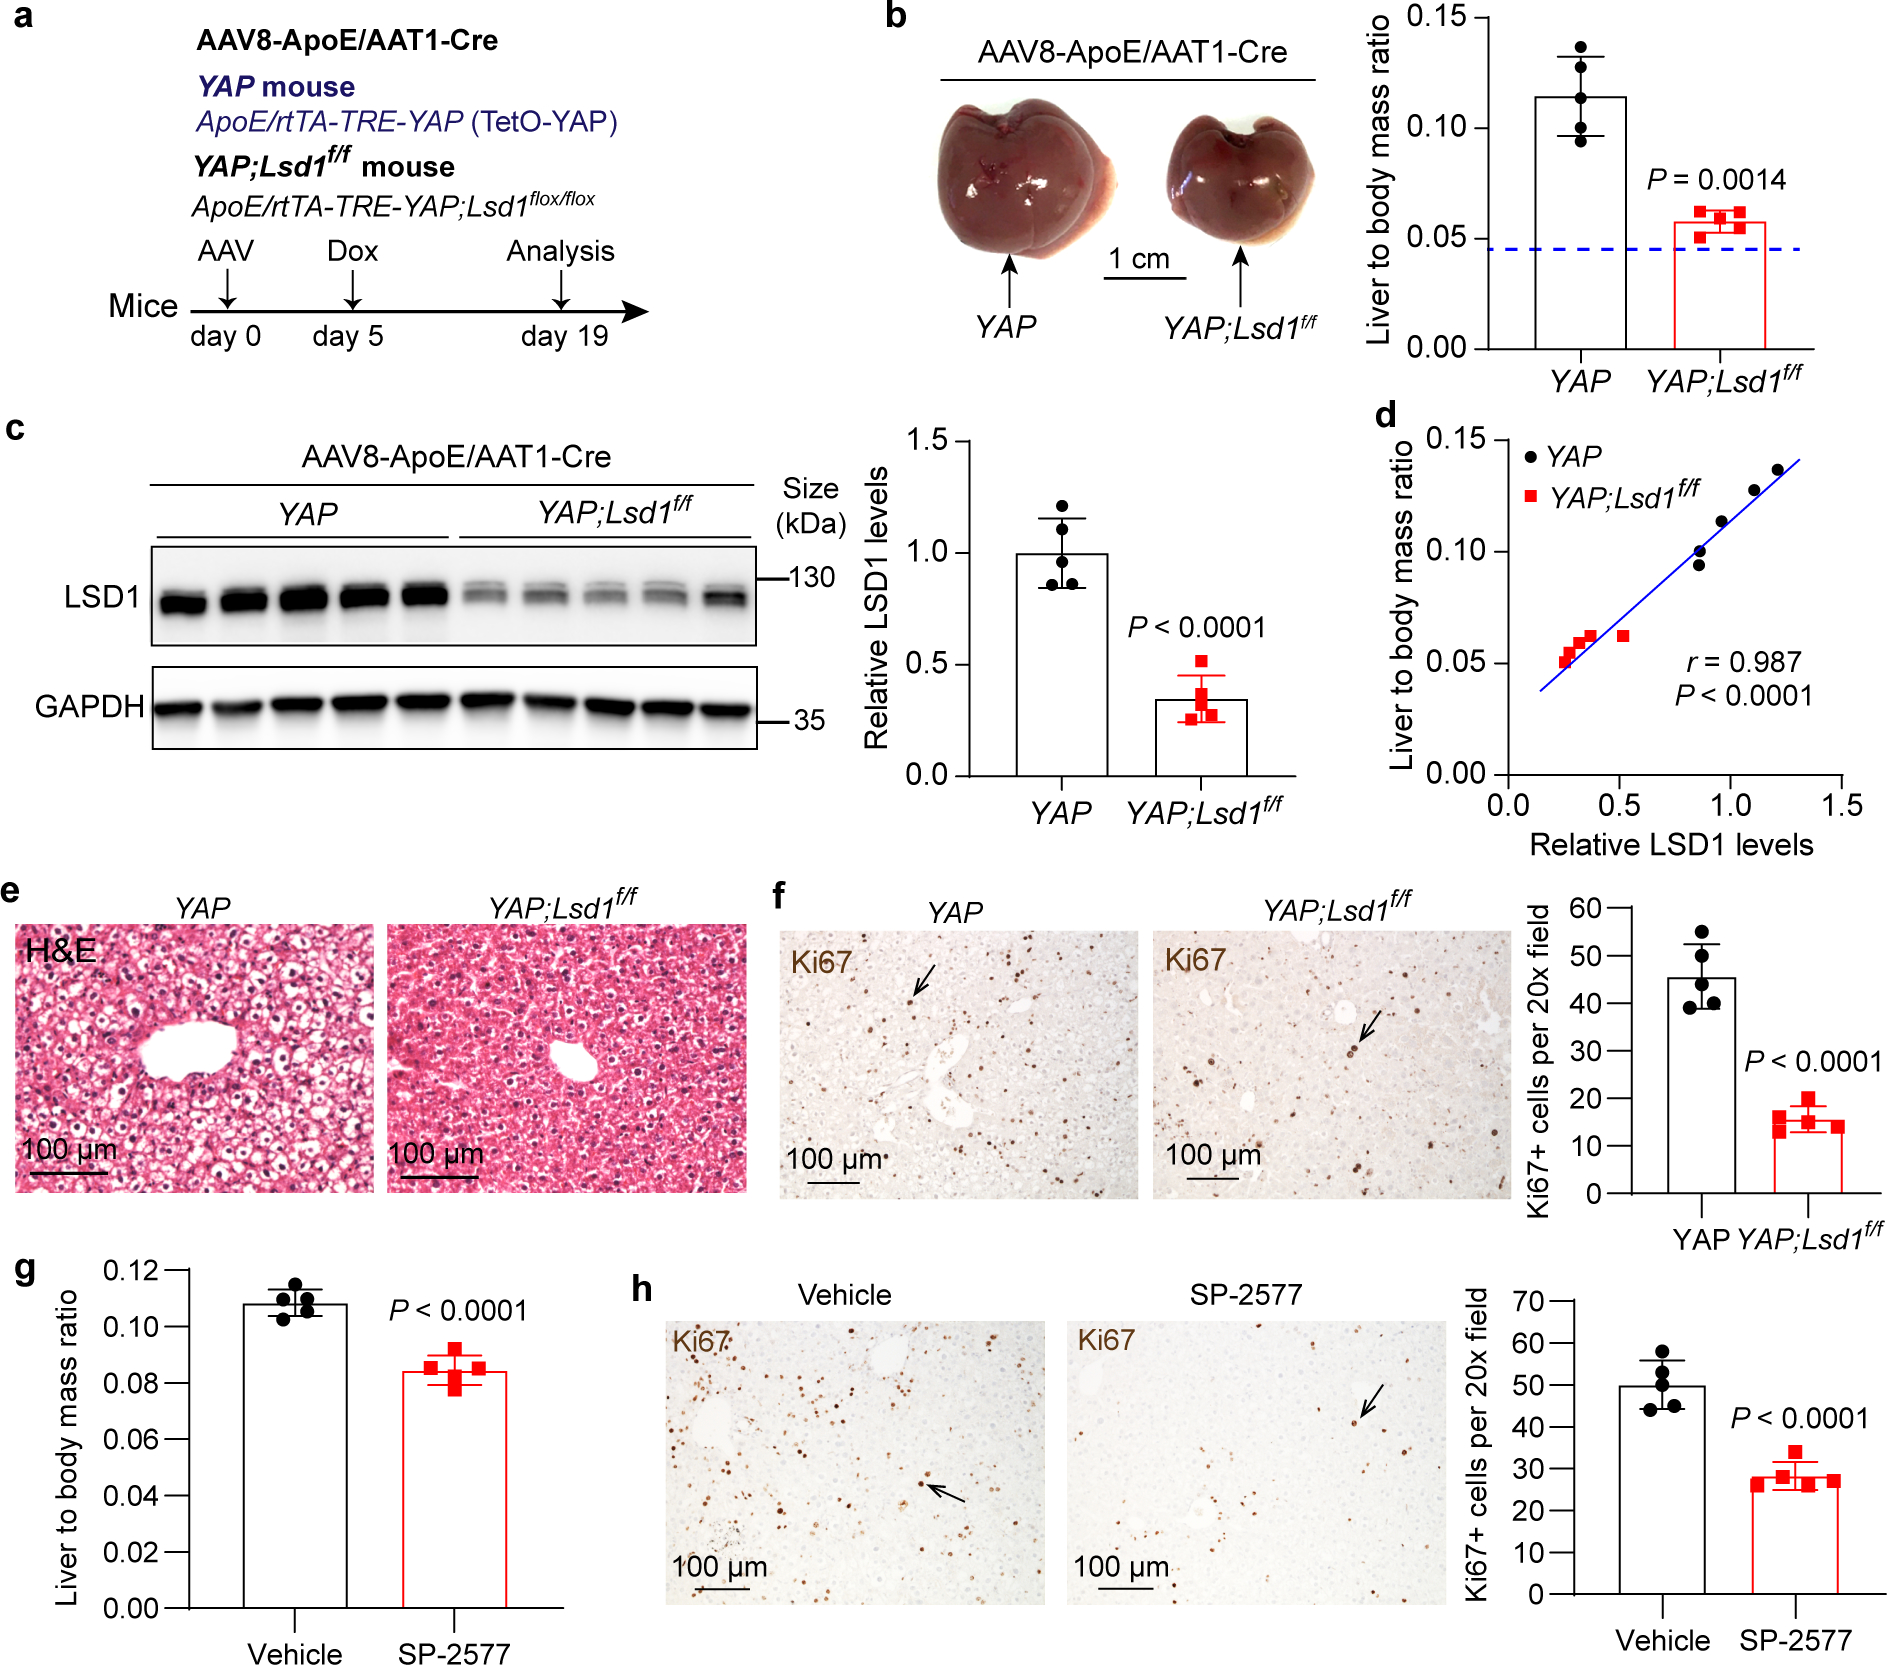
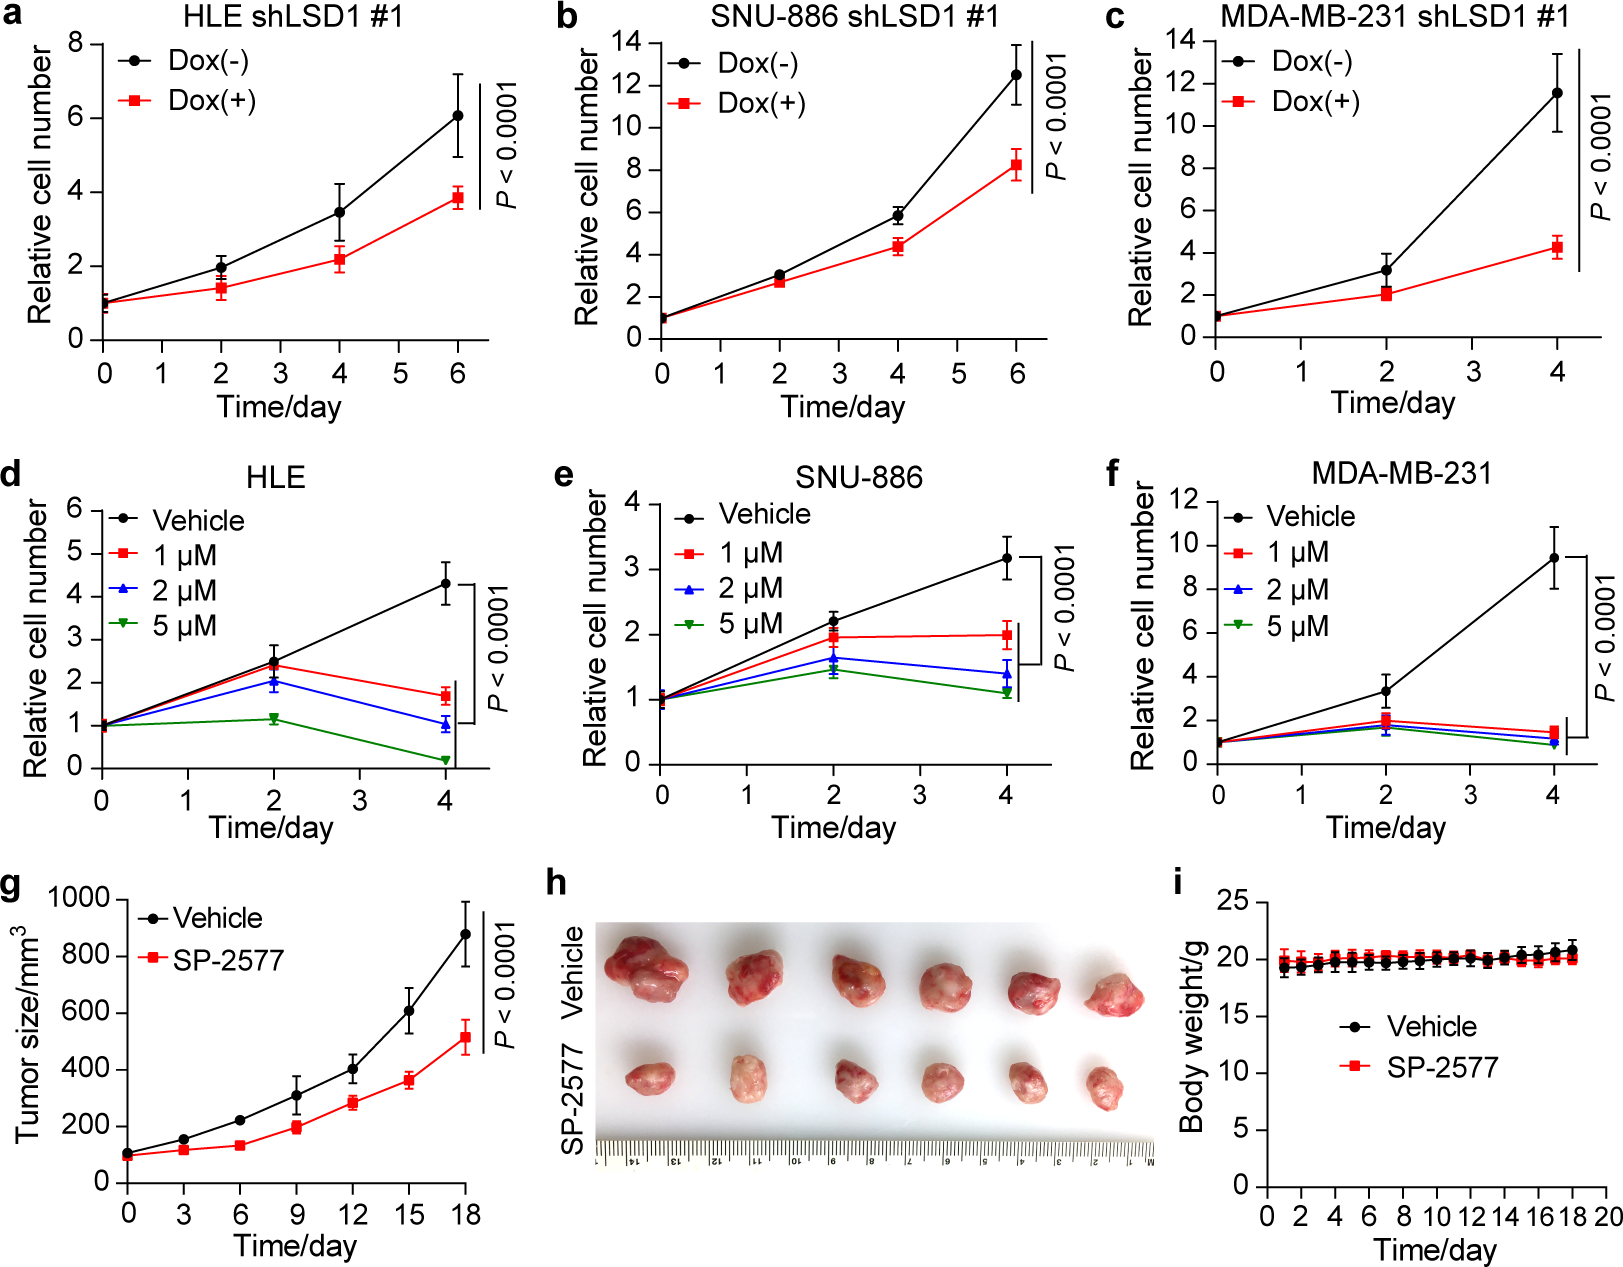
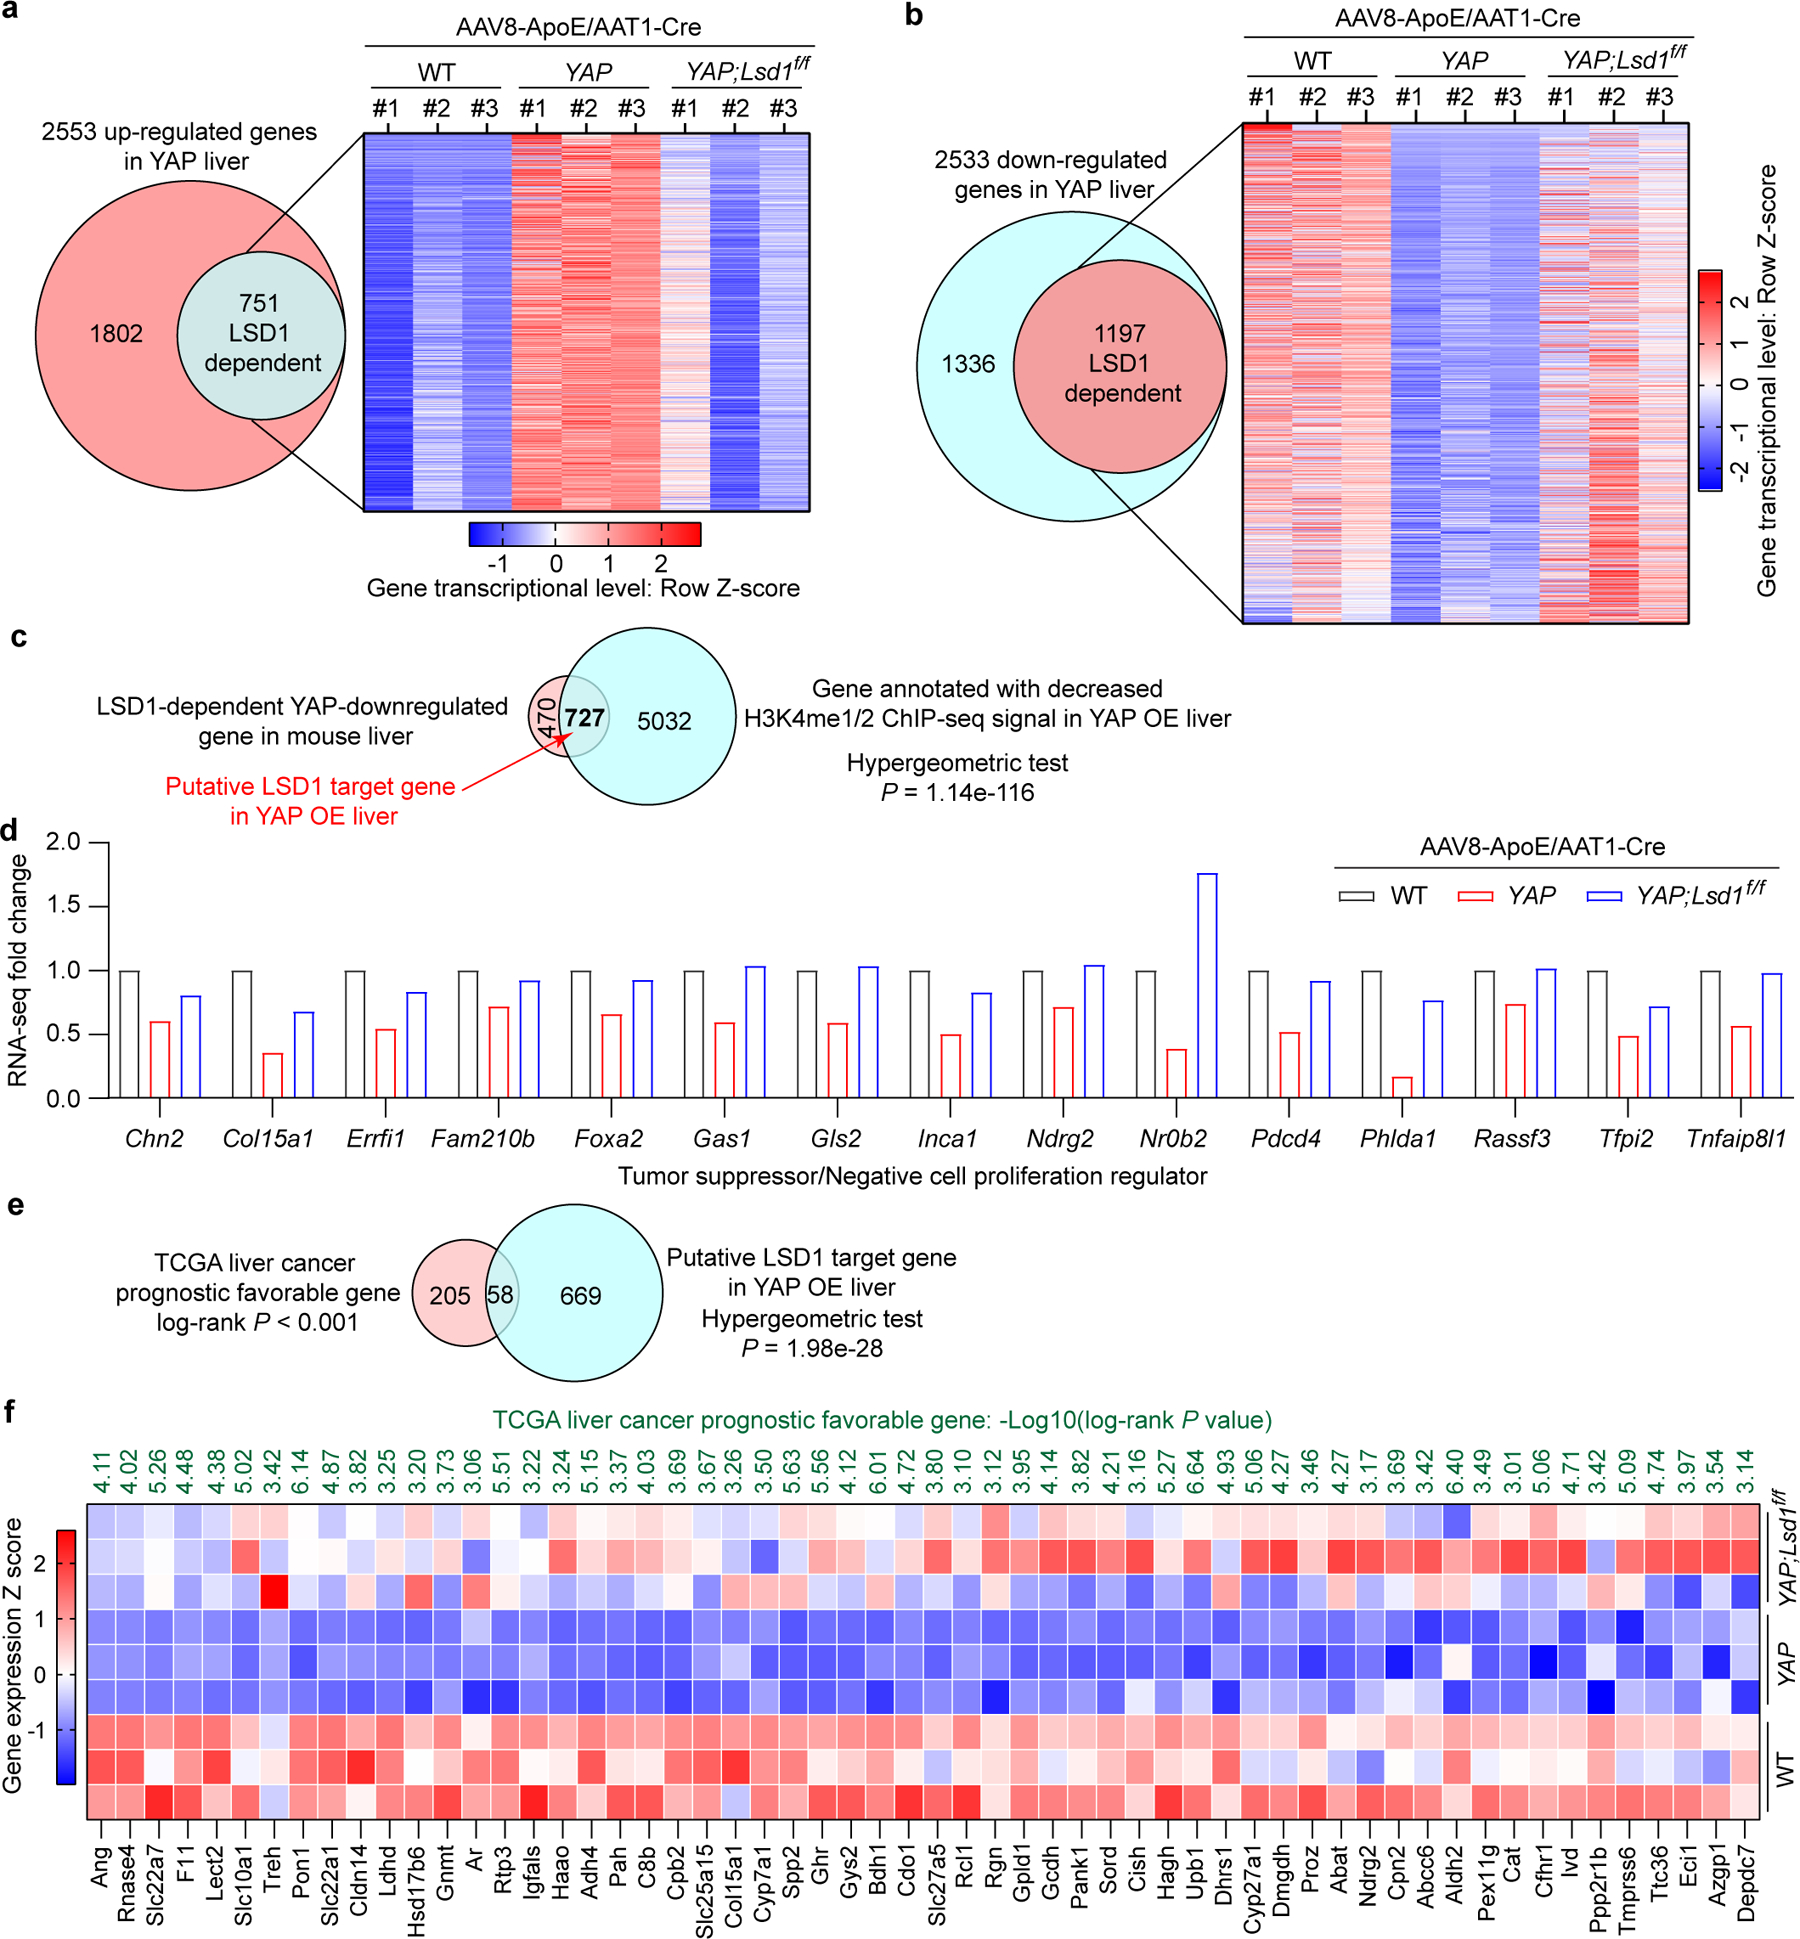
Metabolic reprogramming is central to oncogene-induced tumorigenesis by providing the necessary building blocks and energy sources, but how oncogenic signalling controls metabolites that play regulatory roles in driving cell proliferation and tumour growth is less understood. Here we show that oncogene YAP/TAZ promotes polyamine biosynthesis by activating the transcription of the rate-limiting enzyme ornithine decarboxylase 1. The increased polyamine levels, in turn, promote the hypusination of eukaryotic translation factor 5A (eIF5A) to support efficient translation of histone demethylase LSD1, a transcriptional repressor that mediates a bulk of YAP/TAZ-downregulated genes including tumour suppressors in YAP/TAZ-activated cells. Accentuating the importance of the YAP/TAZ-polyamine-eIF5A hypusination-LSD1 axis, inhibiting polyamine biosynthesis or LSD1 suppressed YAP/TAZ-induced cell proliferation and tumour growth. Given the frequent upregulation of YAP/TAZ activity and polyamine levels in diverse cancers, our identification of YAP/TAZ as an upstream regulator and LSD1 as a downstream effector of the oncometabolite polyamine offers a molecular framework in which oncogene-induced metabolic and epigenetic reprogramming coordinately drives tumorigenesis, and suggests potential therapeutic strategies in YAP/TAZ- or polyamine-dependent human malignancies.


Conflict of interest statement

Competing interests

The authors have no financial and non-financial competing interests.

Figures

Extended Data Fig. 1:
Extended Data Fig. 1:. Metabolomics analysis of YAP OE mouse livers.
a, Schematic diagram of the experimental design. YAP is conditionally expressed in the liver by doxycycline addition. b, YAP expression levels were examined by western blot. Data are represented as mean ± SD, n = 3 mice per group, unpaired two-tailed Student’s t-test. c, Principal component analysis (PCA) shows that YAP OE and control have different metabolic profiles. Value in the parenthesis is the proportion of variance explained by the corresponding principal component. d, Significantly up-regulated metabolites (Fold change > 1.2 and P < 0.05, unpaired two-tailed Student’s t-test) in YAP OE livers are shown as a heat map. e, Top 50 significantly down-regulated metabolites in YAP OE livers are shown as a heat map.
Extended Data Fig. 2:
Extended Data Fig. 2:. Sav1 knockout leads to liver overgrowth, increased levels of polyamine and ODC1 expression in mouse liver.
a, Alb-Cre mice were crossed with Sav1flox mice to knock out Sav1 (Alb-Cre;Sav1flox/flox, Sav1 KO) in the liver. Sav1flox/flox mice were used as controls. Representative liver images of one-month old mice are shown in the left panel, and liver to body mass ratios are shown in the right panel. Data are represented as mean ± SD, n = 5, unpaired two-tailed Student’s t-test. b, Levels of total polyamines in control and Sav1 KO mouse livers. Data are shown as mean ± SEM, n = 4, unpaired two-tailed Student’s t-test. c, Relative mRNA levels of genes involved in polyamine metabolism in control and Sav1 KO mouse livers. Data are shown as mean ± SD, n = 4, unpaired two-tailed Student’s t-test. d,e, Relative ODC1 protein levels were examined in YAP OE and Sav1 KO mouse livers by western blot. Data are shown as mean ± SD, n = 3, unpaired two-tailed Student’s t-test.
Extended Data Fig. 3:
Extended Data Fig. 3:. YAP/TAZ regulates ODC1 transcription in human cells.
a, Relative mRNA levels of ODC1 in HPNE cells stably expressing an empty vector (control), YAP or YAPS127A were examined by RT-qPCR. Data are represented as mean ± SD, n = 4, multiple t-test with Bonferroni correction. b, HEK293T cells were transiently transfected with empty vector or YAP5SA plasmids, and relative mRNA levels of ODC1 were measured by RT-qPCR. Data are represented as mean ± SD, n = 4, unpaired two-tailed Student’s t-test. c, Relative mRNA levels of ODC1 in MCF10A cells transfected by lentivirus expressing an empty vector or YAP5SA were examined by RT-qPCR. Data are represented as mean ± SD, n = 4, unpaired two-tailed Student’s t-test. d,e, MDA-MB-231 and ES-2 cells, which were reported with high YAP/TAZ activity previously, were transfected with siRNAs targeting YAP and TAZ (YAP/TAZ DKD) or non-targeting control (Ctrl). Relative mRNA levels of indicated genes were measured by RT-qPCR. Data are represented as mean ± SD, n = 3, unpaired two-tailed Student’s t-test. f, ChIP-seq analysis shows potentially active enhancer regions binding with YAP/TAZ/TEAD4 in MDA-MB-231 cells. g, Hi-C data analysis shows interactive regions with ODC1 promoter in multiple human cells and liver. h, 293T cells were transiently transfected with empty vector, YAP5SA or YAP5SA/S94A plasmids, and relative mRNA levels of ODC1 were measured by RT-qPCR. Data are represented as mean ± SD, n = 4, one-way ANOVA, Tukey’s multiple comparisons test. i, SNU-886 cells were transiently transfected with empty vector, YAP5SA or YAP5SA/S94A plasmids, and relative mRNA levels of ODC1 were measured by RT-qPCR. Data are represented as mean ± SD, n = 4, one-way ANOVA, Tukey’s multiple comparisons test. j,k, Human HAP1 parental cells, or mutant cells deleted of #3 (E#3M) or both #3 and #4 (E#3&4DM) TEAD-binding sites of ODC1 enhancer were transfected by empty lentivirus vector or vector expressing YAP5SA. Relative mRNA levels of ODC1 (j) and CTGF (k) were examined by RT-qPCR. Data are represented as mean ± SD, n = 3, one-way ANOVA, Dunnett’s multiple comparisons test.
Extended Data Fig. 4:
Extended Data Fig. 4:. AAV-mediated ectopic expression of OAZ1 inhibits YAP-induced liver overgrowth.
a, Experimental design. One-month old wild type (WT) and Dox inducible YAP transgenic (YAP) mice were treated with AAV8-GFP or AAV8-Alb>Oaz1. Five days later, 50 mg/L Dox was added in drink water to induce YAP overexpression for 10 days. b, Representative liver images of mice described in (a) and quantification of liver to body mass ratio. Data are represented as mean ± SD, n = 5, one-way ANOVA, Dunnett’s multiple comparisons test. c, Relative Odc1 and Oaz1 mRNA levels were examined by RT-qPCR. Data are represented as mean ± SD, n = 5, one-way ANOVA, Dunnett’s multiple comparisons test. d, Relative levels of OAZ1 and ODC1 protein were examined by western blot. Quantitation data are shown as mean ± SD, n = 4, one-way ANOVA, Dunnett’s multiple comparisons test. e, Relative total polyamine levels were measured by a commercial kit. Data are represented as mean ± SD, n = 5, one-way ANOVA, Dunnett’s multiple comparisons test. f, Pearson correlation between liver size and polyamine concentrations in the mice from all the three groups. n = 5 per group, r = 0.98, P < 0.0001, two-sided Pearson correlation test. g,h, Representative images of H&E and Ki67 staining of liver samples from WT, YAP and YAP+OAZ1 mice. Livers from 5 mice each experiment were examined with similar results. i, Quantitation of Ki67+ cells. Data are represented as mean ± SD, n = 5, one-way ANOVA, Dunnett’s multiple comparisons test.
Extended Data Fig. 5:
Extended Data Fig. 5:. Inhibiting ODC1 impedes the proliferation of human cancer cells with active YAP/TAZ.
a,b, MDA-MB-231 and ES-2 cells were treated with PBS, 2.5 mM DFMO (ODC1 inhibitor), 1 mM putrescine or 2.5 mM DFMO plus 1 mM putrescine. Relative cell number was measured. Data are represented as mean ± SD, n = 5, two-way ANOVA, n.s., not significant P = 0.57. c, HLE cells were treated with different concentrations of DFMO. Relative cell number was measured. Data are represented as mean ± SD, n = 5, two-way ANOVA. d, SNU-886 cells were treated with PBS, 2.5 mM DFMO, 2.5 mM DFMO plus 1 mM putrescine. Relative cell number was measured. Data are represented as mean ± SD, n = 6, two-way ANOVA, n.s., not significant P = 0.65. e, ODC1 knockdown efficiency was evaluated by RT-qPCR in HLE, SNU-886 and MDA-MB-231 cells two days post dox treatment. Each cell line was tested with two different doxycycline (Dox) inducible shRNAs (shODC1 #1 and shODC1 #2). Data are shown as mean ± SD, n = 3, unpaired two-tailed Student’s t-test. f,g, HLE cells carrying shODC1 #1 or shODC1 #2 were treated with 1 μg/mL of Dox or 1 μg/mL of Dox plus 1 mM of putrescine. Relative cell number was measured. Data are represented as mean ± SEM, n = 6, two-way ANOVA, n.s., not significant P = 0.75. h,i, SNU-886 cells carrying shODC1 #1 or shODC1 #2 were treated with 1 μg/mL of Dox. Relative cell number was measured. Data are represented as mean ± SD, n = 6, two-way ANOVA. j,k, MDA-MB-231 cells carrying shODC1 #1 or shODC1 #2 were treated with 1 μg/mL of Dox. Relative cell number was measured. Data are represented as mean ± SD, n = 6, two-way ANOVA.
Extended Data Fig. 6:
Extended Data Fig. 6:. Identification of LSD1 as a target of eIF5AHyp.
a, Whole proteome peptide sequence analysis identified 3 enzymes directly involved in histone acetylation and methylation with polyproline motif (≥ 5 consecutive proline residues) conserved in human and mouse. b, Relative KDM6B and SETD2 protein levels in control and YAP OE livers. Data are represented as mean ± SD, n = 3, unpaired two-tailed Student’s t-test. c, Relative LSD1 protein levels in control and YAP OE livers. Data are represented as mean ± SD, n = 3, unpaired two-tailed Student’s t-test. d, Relative levels of H3K4me1/2 in control, YAP OE and YAP OE;Odc1 KD livers. Data are represented as mean ± SD, n = 7, **P = 0.0046, ***P = 0.0009, one-way ANOVA with Dunnett’s multiple comparisons test. e-g, HLE, MDA-MB-231 and ES-2 cells were treated with 2.5 mM DFMO or PBS (Ctrl) for 72 hours. Relative eIF5AHyp and LSD1 levels were examined by western blot. Data are represented as mean ± SD, n = 4, **P = 0.0019, ***P = 0.00031, unpaired two-tailed Student’s t-test. h, HLE, MDA-MB-231 and ES-2 cells were treated with 2.5 mM DFMO or PBS (Ctrl) for 72 hours. Relative LSD1 mRNA levels were examined by RT-qPCR. Data are represented as mean ± SD, n = 3, n.s., not significant P = 0.0955, unpaired two-tailed Student’s t-test. i-k, HLE, MDA-MB-231 and ES-2 cells were treated with 10 μM GC7 or PBS (Ctrl) for 24 hours. Relative eIF5AHyp and LSD1 levels were examined by western blot. Data are represented as mean ± SD, n = 4, *P = 0.0223, ***P = 0.0008, **unpaired two-tailed Student’s t-test. l, HLE, MDA-MB-231 and ES-2 cells were treated with 10 μM GC7 or PBS (Ctrl) for 24 hours. Relative LSD1 mRNA levels were measured by RT-qPCR. Data are represented as mean ± SD, n = 3, n.s., not significant P = 0.112, unpaired two-tailed Student’s t-test. m-o, Western blots reveal newly synthesized LSD1 of HLE, MDA-MB-231 and ES-2 cells treated with GC7 or PBS (Ctrl) for 24 hours using the method shown in Fig. 4f. Data are represented as mean ± SD, n = 3, unpaired two-tailed Student’s t-test. p-r, Mice were treated with vehicle (Control) and a single dose of 3 mg/kg TCPOBOP prepared in 10% DMSO/90% corn oil (TCPOBOP). Liver size (p), ODC1 protein levels (q) and LSD1 protein levels (r) were examined 7 days post TCPOBOP treatment. Data are represented as mean ± SD, n = 5 for p, n = 3 for q and r, unpaired two-tailed Student’s t-test.
Extended Data Fig. 7:
Extended Data Fig. 7:. Relative levels of individual polyamine in DFMO-treated cell lines.
a, Relative polyamine levels of AML12 cells treated with 2.5 mM DFMO or PBS (Ctrl) for 72 hours. Data are represented as mean ± SD, n = 3, unpaired two-tailed Student’s t-test. b, Relative polyamine levels of HLE cells treated with 2.5 mM DFMO or PBS (Ctrl) for 72 hours. Data are represented as mean ± SD, n = 3, unpaired two-tailed Student’s t-test. c, Relative polyamine levels of MDA-MB-231 cells treated with 2.5 mM DFMO or PBS (Ctrl) for 72 hours. Data are represented as mean ± SD, n = 3, unpaired two-tailed Student’s t-test. d, Relative polyamine levels of ES-2 cells treated with 2.5 mM DFMO or PBS (Ctrl) for 72 hours. Data are represented as mean ± SD, n = 3, unpaired two-tailed Student’s t-test.
Extended Data Fig. 8:
Extended Data Fig. 8:. AAV-mediated Lsd1 knockout in the liver has little effect on liver size and histology in Lsd1f/f mice.
a, Wildtype (WT) and Lsd1flox/flox (Lsd1f/f) mouse livers 19 days post AAV8-ApoE/AAT1-Cre treatment, and quantification of liver to body mass ratio. Data are represented as mean ± SD, n = 5, unpaired two-tailed Student’s t-test. b, Western blot analysis of LSD1 expression in WT and Lsd1f/f mouse livers post AAV treatment, and quantitation of relative LSD1 protein levels. Data are shown as mean ± SD, n = 5, unpaired two-tailed Student’s t-test. c, Representative images of liver H&E staining. Livers from 5 mice each experiment were examined with similar results. d, Liver Ki67 IHC staining and quantification. Data are represented as mean ± SD, n = 5, unpaired two-tailed Student’s t-test.
Extended Data Fig. 9:
Extended Data Fig. 9:. Inhibiting LSD1 impedes the proliferation of human cancer cells with active YAP/TAZ.
a, LSD1 knockdown efficiency was evaluated by RT-qPCR in HLE, SNU-886 and MDA-MB-231 cells 2 days post doxycycline (Dox) treatment. Each cell line was tested with two different Dox inducible shRNAs (shLSD1 #1 and shLSD1 #2). Data are represented as mean ± SD, n = 3, unpaired two-tailed Student’s t-test. b, HLE cells carrying shLSD1 #2 were treated with 1 μg/mL of Dox. Relative cell number was measured. Data are represented as mean ± SD, n = 5, two-way ANOVA. c, SNU-886 cells carrying shLSD1 #2 were treated with 1 μg/mL of Dox. Relative cell number was measured. Data are represented as mean ± SD, n = 6, two-way ANOVA. d, MDA-MB-231 cells carrying shLSD1 #2 were treated with 1 μg/mL of Dox. Relative cell number was measured. Data are represented as mean ± SD, n = 6, two-way ANOVA. e, ES-2 cells were treated with different concentrations of LSD1 inhibitor SP-2577. Relative cell number was measured. Data are represented as mean ± SD, n = 6, two-way ANOVA.
Extended Data Fig. 10:
Extended Data Fig. 10:. Characterization of H3K4me1/2 ChIP-seq data in WT and YAP OE livers.
a-e, Distribution and annotation of H3K4me1/2 ChIP peaks in WT and YAP OE liver samples. f, Overlap of genes annotated with decreased H3K4me1 and H3K4me2 ChIP peak signal in YAP OE livers (Hypergeometric test, P < 1.00e-200).
Fig. 1|
Fig. 1|. YAP activation promotes polyamine biosynthesis in mouse liver.
a, One-month old hepatocyte-specific, tetracycline-inducible YAP transgenic mice (YAP OE) and wild type littermates (Control) were treated with doxycycline in drink water for 10 days to induce YAP overexpression in the liver. Representative liver images are shown in the left panel, and liver to body mass ratios are shown in the right panel. Data are represented as mean ± SD, n = 5, unpaired two-tailed Student’s t-test. b, A volcano plot of changed metabolites induced by YAP OE. Metabolites with |fold change|>1.2 and P < 0.05 are highlighted in red (increased) or blue (decreased), unpaired two-tailed Student’s t-test. c, Metabolic pathway enrichment analysis of upregulated metabolites in YAP OE livers. P value was calculated using one-tailed Fisher’s exact test. d, A schematic diagram of polyamine metabolic pathway. Arg1/2, arginase 1/2. Azin1/2, antizyme inhibitor 1/2. Oaz1/2, ornithine decarboxylase antizyme 1/2. Odc1, ornithine decarboxylase. Sat1, diamine acetyltransferase 1. Srm, spermidine synthase. Sms, spermine synthase. Smox, spermine oxidase. e, Relative levels of metabolites involved in polyamine metabolism in control and YAP OE livers. Data are represented as mean ± SD, n = 5, unpaired two-tailed Student’s t-test. f, Levels of total polyamines in control and YAP OE livers. Data are represented as mean ± SEM, n = 4, unpaired two-tailed Student’s t-test. g, Relative mRNA levels of genes involved in polyamine metabolism in control and YAP OE livers. Data are represented as mean ± SD, n = 4, unpaired two-tailed Student’s t-test.
Fig. 2|
Fig. 2|. YAP/TAZ regulates ODC1 expression and polyamine biosynthesis in human HCC.
a,b, HLE and SNU-886 cells were transfected with Lenti-vector (Vector) or Lenti-YAP5SA (YAP5SA) to establish stable cell lines, and relative mRNA levels of indicated genes were measured by RT-qPCR. Data are represented as mean ± SD, n = 4, unpaired two-tailed Student’s t-test. c, SNU-886 cells were transiently transfected with empty vector or TAZ4SA plasmids, and relative mRNA levels of ODC1 were measured by RT-qPCR. Data are represented as mean ± SD, n = 4, unpaired two-tailed Student’s t-test. d,e, HLE and SNU-886 cells were transfected with siRNA targeting YAP (YAP KD) or non-targeting control (Ctrl). Relative mRNA levels of indicated genes were measured by RT-qPCR. Data are represented as mean ± SD, n = 4, unpaired two-tailed Student’s t-test. f,g, HLE and SNU-886 cells were transfected with siRNAs targeting YAP and TAZ (YAP/TAZ DKD) or non-targeting control (Ctrl). Relative mRNA levels of indicated genes were measured by RT-qPCR. Data are represented as mean ± SD, n = 4, unpaired two-tailed Student’s t-test. h, Relative total polyamine levels were measured in the indicated cells. Data are represented as mean ± SD, n = 6, unpaired two-tailed Student’s t-test. i, Comparison of ODC1 mRNA levels (TPM, transcripts per million) in tumors and matched normal tissues from human hepatocellular carcinoma (HCC) patients in the TCGA dataset. For the boxplots, the center lines mark the median, the box limits indicate the 25th and 75th percentiles, and the whiskers extend 1.5× the interquartile range from the 25th and 75th percentiles (biologically independent samples n = 50 for normal, n = 369 for tumor, unpaired two-tailed Student’s t-test). j,k, Spearman correlation between YAP/TAZ and ODC1 in tumors and matched normal tissues from HCC patients in the TCGA dataset (two-tailed Spearman’s correlation test). l, Kaplan-Meier overall survival analysis of ODC1 for HCC patients from the TCGA dataset. P value was calculated using the two-side log-rank test. m, Luciferase reporter assay in 293T cells of putative ODC1 enhancers containing either wildtype or mutated TEAD binding sites. Data are represented as mean ± SD, n = 3, unpaired two-tailed Student’s t-test. n, ChIP-qPCR assay in SNU-886 cells showing YAP bound to ODC1 enhancer #3 and #4. Data are represented as mean ± SD, n = 3, unpaired two-tailed Student’s t-test.
Fig. 3|
Fig. 3|. Odc1 knockdown inhibits YAP-induced liver overgrowth and polyamine biosynthesis.
a, Experimental design. One-month old wild type (WT) and Dox inducible YAP transgenic (YAP) mice were treated with AAV8-shRNA-Odc1(shOdc) or non-targeting scramble. Five days later, 50 mg/L Dox was added in drink water to induce YAP overexpression for 10 days. b, Representative liver images are shown in the left panel, and liver to body mass ratios are shown in the right panel. Data are represented as mean ± SD, n = 5 mice per group, one-way ANOVA, Tukey’s multiple comparisons test. c, Relative Odc1 mRNA levels were examined by RT-qPCR. Data are represented as mean ± SD, n = 4, one-way ANOVA, Tukey’s multiple comparisons test. d, Representative western blot images of liver extractions of indicated genotypes (left) and the quantification results of ODC1 protein levels (right). Data are represented as mean ± SD, n = 4 mice per group, one-way ANOVA, Tukey’s multiple comparisons test. e, Relative levels of individual polyamine. Data are represented as mean ± SD, n = 5, one-way ANOVA, Dunnett’s multiple comparisons test. f, Pearson correlation between liver size and total polyamine concentrations in the mice from all the three groups (n = 5 mice for WT and YAP, n = 6 mice for YAP+shOdc, two-tailed Pearson correlation test). g, Quantitation of Ki67+ cells. Data are represented as mean ± SD, n = 5, one-way ANOVA, Tukey’s multiple comparisons test. h, Representative images of H&E staining of liver samples of WT, YAP, and YAP+shOdc mice. i, Relative mRNA levels of Afp. Data are represented as mean ± SD, n = 4, one-way ANOVA, Tukey’s multiple comparisons test.
Fig. 4|
Fig. 4|. Polyamine-mediated eIF5A hypusination (eIF5AHyp) is required for efficient translation of LSD1.
a, Relative levels of eIF5AHyp in control and YAP OE mouse livers. Data are represented as mean ± SD, n = 3, unpaired two-tailed Student’s t-test. b,c, AML12 cells were treated with 2.5 mM DFMO or PBS (Ctrl) for 72 hours. eIF5AHyp and LSD1 protein and Lsd1 mRNA levels were examined. Data are represented as mean ± SD, n = 5 for b, n = 3 for c, unpaired two-tailed Student’s t-test. d,e, AML12 cells were treated with 10 μM GC7 or PBS (Ctrl) for 24 hours. eIF5AHyp and LSD1 protein and Lsd1 mRNA levels were examined. Data are represented as mean ± SD, n = 3, unpaired two-tailed Student’s t-test. f, OPP-pulldown assay for nascent protein synthesis. OPP is incorporated into newly translated proteins, then the azide group on biotin is conjugated to an alkyne group on OPP by click reaction. Biotin-labeled proteins are pulldown by magnetic streptavidin beads and detected by western blot. g, Relative levels of newly synthesized LSD1 of AML12 cells treated with 10 μM GC7 or PBS (Ctrl) for 24 hours using the method shown in panel (f). Data are represented as mean ± SD, n = 3, unpaired two-tailed Student’s t-test. h, Relative protein levels of LSD1, eIF5A and eIF5AHyp in livers of wild type mice treated with AAV8-GFP (WT+GFP), YAP OE treated with AAV8-GFP (YAP+GFP) or AAV8-Oaz1 (YAP+OAZ1) (see Extended Data Fig. 4a,b for experimental design). Quantification data are represented as mean ± SD, n = 4, one-way ANOVA, Dunnett’s multiple comparisons test. i, A schematic showing the proposed polyamine-eIF5AHyp-LSD1 axis.
Fig. 5|
Fig. 5|. LSD1 suppression inhibits YAP-induced overgrowth in mouse liver.
a, Experimental procedure to knock out Lsd1 in YAP OE mouse liver. The YAP transgenic mice and YAP;Lsd1f/f mice were transduced with AAV8-ApoE/AAT1-Cre virus first, then 5 days post AAV treatment, 30 mg/L dox was added in drink water to induce YAP overexpression for 14 days. b, YAP and YAP;Lsd1f/f mice livers at day 19 and quantification of liver to body mass ratio of the mice described in (a). Blue line indicates the average value of wildtype mice. Data are represented as mean ± SD, n = 5, unpaired two-tailed Student’s t-test. c, LSD1 protein levels were examined by western blot. Quantification data are represented as mean ± SD, n = 5, unpaired two-tailed Student’s t-test. d, Pearson correlation between liver size and relative LSD1 protein levels (two-tailed Pearson correlation test). e, Representative images of H&E staining of livers. Livers from 5 mice each experiment were examined with similar results. f, Liver Ki67 staining and quantitation. Data are represented as mean ± SD, n = 5, unpaired two-tailed Student’s t-test. g, YAP transgenic mice were treated with vehicle or 40 mg/kg SP-2577 i.p. daily for 10 days. Relative liver size was quantified as liver to body mass ratio. Data are represented as mean ± SD, n = 5, unpaired two-tailed Student’s t-test. h, Liver Ki67 staining and quantitation. Data are represented as mean ± SD, n = 5, unpaired two-tailed Student’s t-test.
Fig. 6|
Fig. 6|. LSD1 suppression inhibits the proliferation of human cancer cells with active YAP/TAZ.
a-c, HLE, SNU-886 and MDA-MB-231 cells carrying doxycycline (Dox) inducible shLSD1 #1 were treated with 1 μg/mL of Dox, and relative cell number was measured. Data are represented as mean ± SD, n = 5 for HLE, n = 6 for SNU-886 and MDA-MB-231, two-way ANOVA. d-f, HLE, SNU-886 and MDA-MB-231 cells were treated with different concentrations of LSD1 inhibitor SP-2577 and vehicle (DMSO), and relative cell number was measured. Data are represented as mean ± SD, n = 6, two-way ANOVA. g, Tumor size of MDA-MB-231 xenograft in NSG mice treated with vehicle or SP-2577. Data are represented as mean ± SD, n = 6, two-way ANOVA. h, Images of tumors derived from the MDA-MB-231 xenografts at the end of the experimental treatment. i, Body weight of mice during the experimental procedure. No significant difference was found between vehicle and SP-2577 groups (data are presented as mean ± SD, n = 6, P = 0.72, two-way ANOVA).
Fig. 7|
Fig. 7|. Identification and functional analysis of the putative LSD1 target genes in YAP OE mouse liver.
a, RNA-seq analysis of up-regulated genes that are dependent on LSD1 in YAP OE livers (adjusted P value < 0.05 for both comparisons: YAP vs WT and YAP;Lsd1f/f vs YAP, Bonferroni correction for multiple comparisons test). b, RNA-seq analysis of down-regulated genes that are dependent on LSD1 in YAP OE livers (adjusted P value < 0.05 for both comparisons: YAP vs WT and YAP;Lsd1f/f vs YAP, Bonferroni correction for multiple comparisons test). c, A Venn diagram showing the putative LSD1 target genes in YAP OE livers. d, Potential tumor suppressors and negative cell proliferation regulators among the putative LSD1 target genes (adjusted P < 0.05 for comparisons: YAP vs WT and YAP;Lsd1f/f vs YAP from RNA-seq analysis, Bonferroni correction for multiple comparisons test). e,f, The putative LSD1 target genes were overlapped with liver cancer prognosis favorable genes. The significance of overlapping in (e) was validated by one-tailed hypergeometric test with P = 1.98e-28. The survival analysis in (f) was performed with two-sided Log-rank test.

References

    1. Pavlova NN & Thompson CB The Emerging Hallmarks of Cancer Metabolism. Cell Metab. 23, 27–47 (2016). - PMC - PubMed
    1. Dang L et al. Cancer-associated IDH1 mutations produce 2-hydroxyglutarate. Nature 462, 739–744 (2009). - PMC - PubMed
    1. Faubert B, Solmonson A & DeBerardinis RJ Metabolic reprogramming and cancer progression. Science 368, eaaw5473 (2020). - PMC - PubMed
    1. Vander Heiden MG & DeBerardinis RJ Understanding the Intersections between Metabolism and Cancer Biology. Cell 168, 657–669 (2017). - PMC - PubMed
    1. Yu F-X, Zhao B & Guan K-L Hippo pathway in organ size control, tissue homeostasis, and cancer. Cell 163, 811–828 (2015). - PMC - PubMed

Publication types

MeSH terms