. 2022 Mar;54(3):240-250.
doi: 10.1038/s41588-021-01011-w. Epub 2022 Feb 17.

Analysis of rare genetic variation underlying cardiometabolic diseases and traits among 200,000 individuals in the UK Biobank

Collaborators, Affiliations

Analysis of rare genetic variation underlying cardiometabolic diseases and traits among 200,000 individuals in the UK Biobank

Sean J Jurgens et al. Nat Genet. 2022 Mar.

Abstract

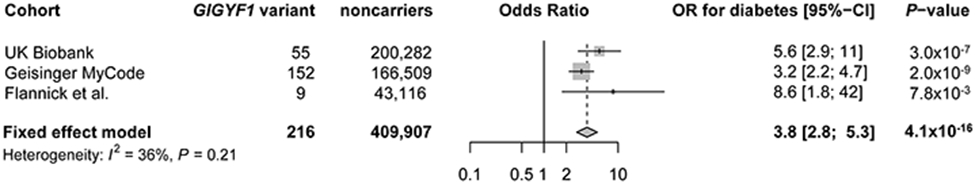
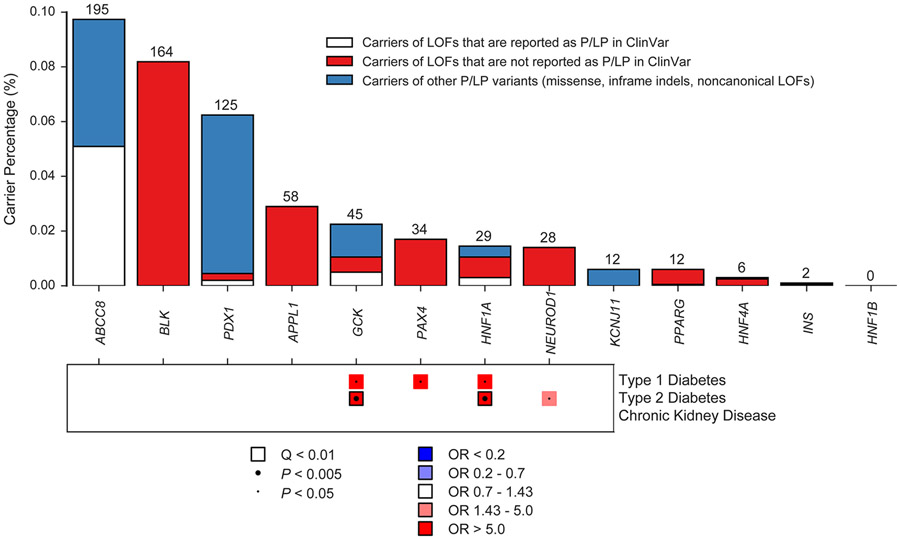
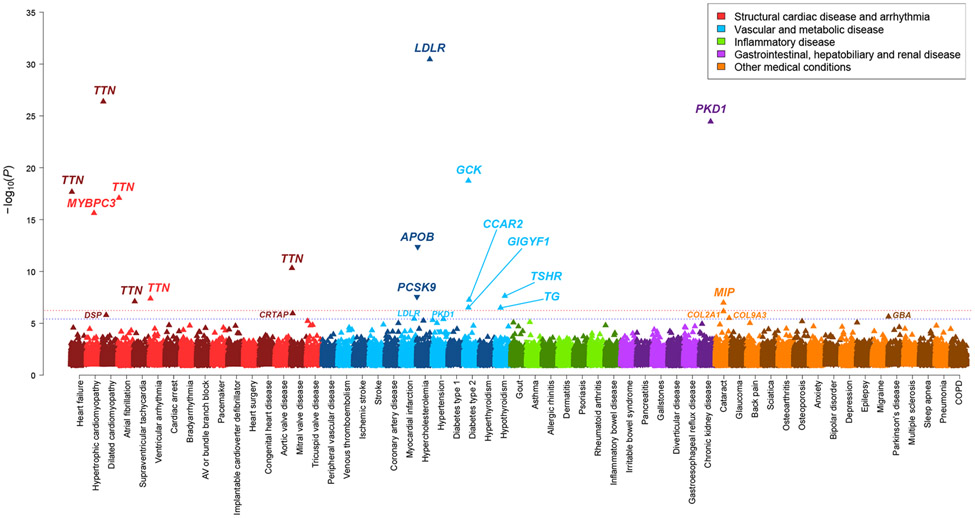
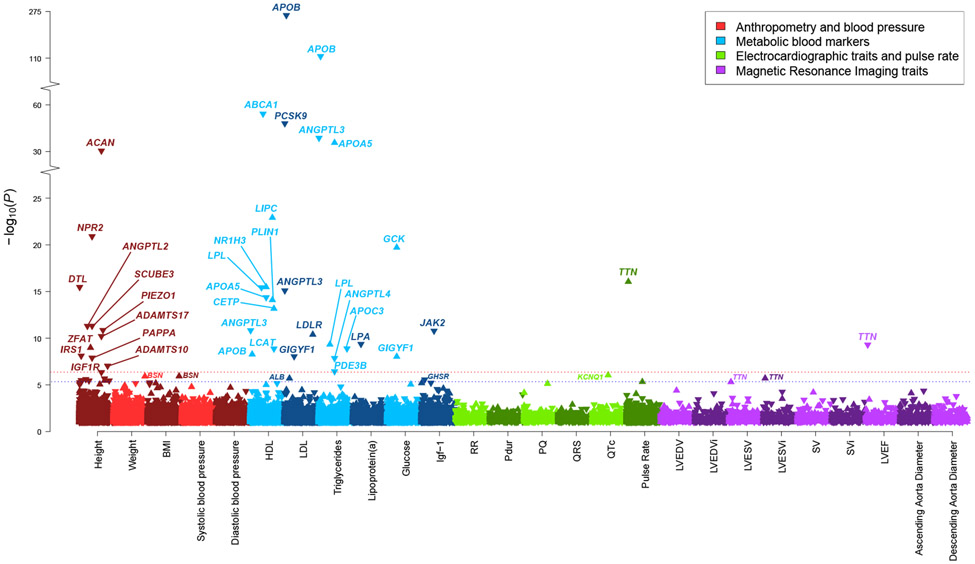
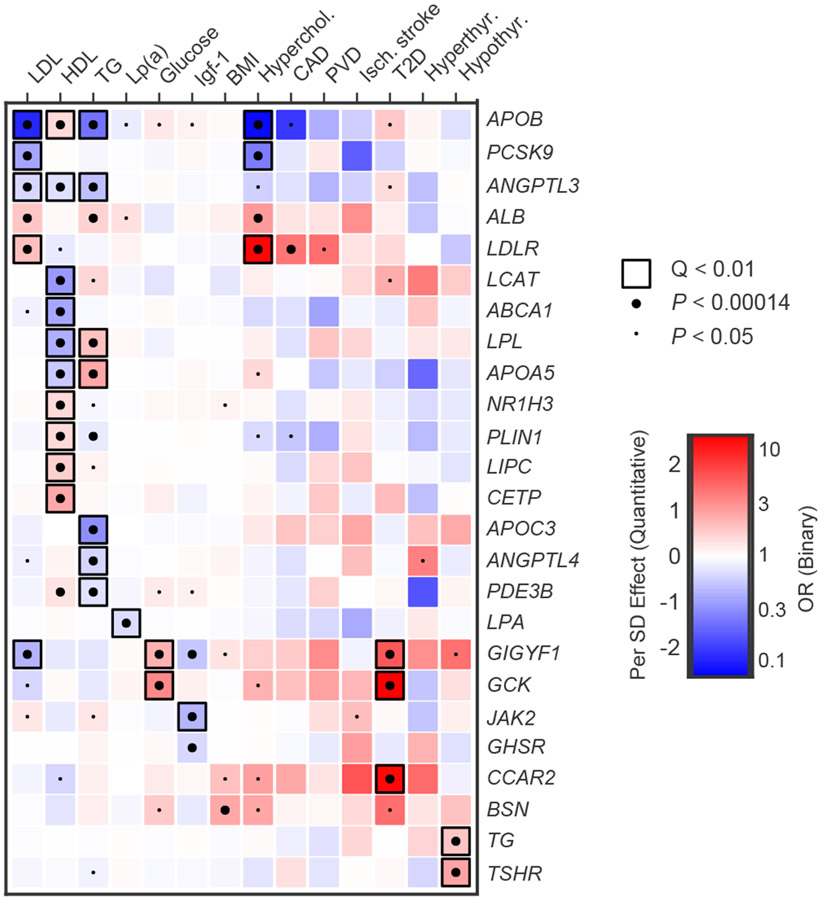
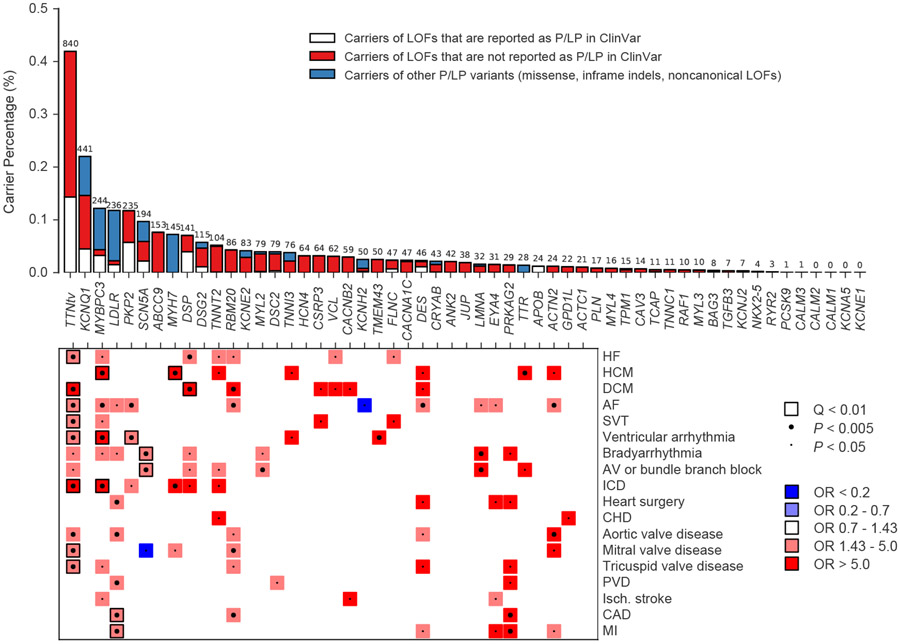
Cardiometabolic diseases are the leading cause of death worldwide. Despite a known genetic component, our understanding of these diseases remains incomplete. Here, we analyzed the contribution of rare variants to 57 diseases and 26 cardiometabolic traits, using data from 200,337 UK Biobank participants with whole-exome sequencing. We identified 57 gene-based associations, with broad replication of novel signals in Geisinger MyCode. There was a striking risk associated with mutations in known Mendelian disease genes, including MYBPC3, LDLR, GCK, PKD1 and TTN. Many genes showed independent convergence of rare and common variant evidence, including an association between GIGYF1 and type 2 diabetes. We identified several large effect associations for height and 18 unique genes associated with blood lipid or glucose levels. Finally, we found that between 1.0% and 2.4% of participants carried rare potentially pathogenic variants for cardiometabolic disorders. These findings may facilitate studies aimed at therapeutics and screening of these common disorders.


Figures

Extended Data Fig. 1
Extended Data Fig. 1. Meta-analysis results for GIGYF1 rare variants and type 2 diabetes across three cohorts
Data are presented in a forest plot, with study specific odds ratios (OR) with 95% confidence intervals (95% CI), and a meta-analysis OR shown with a diamond where the edges of the diamond show the meta-analysis 95% CI. Meta-analysis results are obtained from an inverse-variance weighted fixed-effects meta-analysis approach. Study-specific and meta-analysis P-values are two-sided and unadjusted for multiple testing. To evaluate heterogeneity between studies, an I2 index for heterogeneity and a P-value from Cochran’s Q test are provided, which show limited evidence of heterogeneity.
Extended Data Fig. 2
Extended Data Fig. 2. Carrier frequencies of putatively pathogenic variants in monogenic diabetes genes
The top of the graph is a bar chart showing carrier frequencies for loss-of-function (LOF) variants and pathogenic/likely pathogenic (P/LP) variants for genes in which variants are known to cause dominant type 2 diabetes or maturity-onset diabetes of the young (MODY). For ABCC8 and KCNJ11, analyses were restricted to previously reported P/LP variants only. The bottom of the graph is a pruned heatmap showing associations between such variants with diabetes and chronic kidney disease, where blue indicates lower risk of disease and red indicates increased risk of the disease. P-values were computed using saddle point approximation and were obtained from logistic mixed effects models, adjusting for sex, age, sequencing batch, associated principal components (PCs), a sparse kinship matrix. P-values shown are two-sided and unadjusted for multiple testing. Odds ratios (OR) were obtained from Firth’s regression models adjusting for sex, age, sequencing batch and associated PCs among unrelated samples. For clarity, associations with P > 0.05 and 0.7 < OR < 1.43 have been made white. Only GCK (45 carriers) and HNF1A (29 carriers) showed robust associations with diabetes. Of note, PDX1 carriers are driven by a single likely pathogenic missense variant, p.Cys18Arg (n = 112 carriers). Our results therefore indicate that this allele specifically does not represent a highly penetrant pathogenic variant, but do not necessarily translate to the 13 carriers of LOF variants.
Figure 1 ∣
Figure 1 ∣. Rare genetic variation for 57 cardiometabolic and other medical disorders in the UK Biobank.
Multiple-trait Manhattan plot representing the results from exome-wide gene-based tests for each phenotype. Phenotypes are labelled on the x-axis and the −log10 of the P-value for each test on the y-axis. Variants included in the gene-based test are restricted to loss-of-function and predicted-deleterious missense variants. P-values were computed using the saddle point approximation and were obtained from logistic mixed effects models, adjusting for sex, age, sequencing batch, associated principal components (PCs) and a sparse kinship matrix. P-values shown are two-sided and unadjusted for multiple testing. The red line indicates the significance threshold at a Benjamini-Hochberg false-discovery-rate (FDR) of 1% across all tests across all binary and quantitative traits, while the blue line represents the suggestive threshold at FDR 5%. An arrow pointing upwards indicates that rare variants were associated with increased risk of disease, while arrows pointing downward indicate decreased risk.
Figure 2 ∣
Figure 2 ∣. Rare genetic variation for 26 quantitative cardiometabolic traits in the UK Biobank.
Multiple-trait Manhattan plot representing the results from exome-wide gene-based tests for each phenotype. Phenotypes are labelled on the x-axis and the −log10 of the P-value for each test on the y-axis. Variants included in the gene-based test are restricted to loss-of-function and predicted-deleterious missense variants. P-values were obtained from score tests from linear mixed effects models, adjusting for sex, age, sequencing batch, associated principal components (PCs), MRI serial number (for MRI traits) and a sparse kinship matrix. P-values shown are two-sided and unadjusted for multiple testing. The red line indicates the significance threshold at a Benjamini-Hochberg false-discovery rate (FDR) of 1% across all tests across all binary and quantitative traits, while the blue line represents the suggestive threshold at FDR 5%. For height, suggestively associated genes are not annotated with gene names for clarity. An arrow pointing upwards indicates that rare variants were associated with higher value for a given quantitative trait, while arrows pointing downward indicate lower value. BMI, body mass index; HDL, high-density lipoprotein; LDL, low-density lipoprotein; Igf-1, insulin-like growth factor 1; RR, RR interval; Pdur, P-wave duration; PQ, PQ interval; QRS, QRS-complex duration; QTc, Bazett-corrected QT interval; LVEDV, left ventricular end-diastolic volume; LVEDVi, body-surface-area indexed left ventricular end-diastolic volume; LVESV, left ventricular end-systolic volume; LVESVi, body-surface-area indexed left ventricular end-systolic volume; SV, stroke volume; SVi, body-surface-area indexed stroke volume; LVEF, left ventricular ejection fraction.
Figure 3 ∣
Figure 3 ∣. Pleiotropy of rare variants in metabolic genes.
This heatmap shows association results for genes associated at false-discovery rate (FDR) Q-value < 0.05 with any metabolic trait in our primary analysis, across a range of relevant metabolic traits. P-values were obtained from score tests in linear mixed effects models (quantitative traits) or saddle point approximation in logistic mixed effects models (binary traits), adjusting for sex, age, sequencing batch, associated principal components (PCs) and a sparse kinship matrix. P-values shown are two-sided and unadjusted for multiple testing, while Q-values represent false-discovery rate (FDR) adjusted two-sided P-values by Benjamini-Hochberg method. Effect sizes for quantitative traits (β) were obtained from the same linear model, while odds ratios (OR) for binary traits were obtained from Firth’s regression models adjusting for sex, age, sequencing batch and associated PCs among unrelated samples. A small dot indicates nominal significance (P < 0.05), a large dot indicates P < 0.00014 (0.05/ 350 tests), while a black square indicates FDR Q-value < 0.01 in the primary discovery phase. Red indicates β > 0 (quantitative traits) or OR > 1 (binary traits), while blue indicates β < 0 (quantitative traits) or OR < 1 (binary traits). LDL, low-density lipoprotein; HDL, high-density lipoprotein; TG, triglycerides; Lp(a), lipoprotein (a); Igf-1, insulin-like growth factor 1; Hyperchol, hypercholesterolemia; CAD, coronary artery disease; PVD, peripheral vascular disease; Isch. Stroke, ischemic stroke; T2D, type 2 diabetes.
Figure 4 ∣
Figure 4 ∣. Putatively pathogenic variants in Mendelian cardiovascular disease genes in the UK Biobank.
The top of the figure is a bar chart showing carrier frequencies for rare LOF, pathogenic and likely pathogenic variants in genes reported for dominant inheritance of arrhythmia, cardiomyopathy or hypercholesterolemia. The absolute number of carriers in the UK Biobank is shown above each bar. Bar charts are stacked to visualize carriers of LOFs reported in ClinVar as likely pathogenic or pathogenic (P/LP), carriers of LOFs not reported in ClinVar as P/LP, and carriers of other P/LP variants (missense, inframe indels, noncanonical or low-confidence LOFs, etc). The bottom of the figure is a pruned heatmap showing association results between these variants and cardiovascular outcomes that reach nominal significance (P < 0.05). P-values were computed using the saddle point approximation and were obtained from logistic mixed effects models, adjusting for sex, age, sequencing batch, associated principal components (PCs) and a sparse kinship matrix. P-values shown are two-sided and unadjusted for multiple testing. Odds ratios (OR) were obtained from Firth’s regression models adjusting for sex, age, sequencing batch and associated PCs among unrelated samples. A small dot represents nominal significance (P < 0.05), while a large dot represents P < 0.005. A square represents significant at an FDR Q-value of < 0.01. Blue indicates OR < 1, while red indicates OR > 1. For clarity, tests with P > 0.05 or an OR between 0.7 and 1.43 have been made white. HF, heart failure; HCM, hypertrophic cardiomyopathy; DCM, dilated cardiomyopathy; AF, atrial fibrillation; SVT, supraventricular tachycardia; AV, atrioventricular; ICD, implantable cardioverter-defibrillator; CHD, congenital heart disease; PVD, peripheral vascular disease; Isch., Ischemic; CAD, coronary artery disease; MI, myocardial infarction.

References

    1. Locke AE et al. Genetic studies of body mass index yield new insights for obesity biology. Nature 518, 197–206 (2015). - PMC - PubMed
    1. Roselli C et al. Multi-ethnic genome-wide association study for atrial fibrillation. Nat. Genet 50, 1225–1233 (2018). - PMC - PubMed
    1. Shah S et al. Genome-wide association and Mendelian randomisation analysis provide insights into the pathogenesis of heart failure. Nat. Commun 11, 163 (2020). - PMC - PubMed
    1. Klarin D et al. Genetics of blood lipids among ~300,000 multi-ethnic participants of the Million Veteran Program. Nat. Genet 50, 1514–1523 (2018). - PMC - PubMed
    1. Pirruccello JP et al. Analysis of cardiac magnetic resonance imaging in 36,000 individuals yields genetic insights into dilated cardiomyopathy. Nat. Commun 11, 2254 (2020). - PMC - PubMed

Methods-only References

    1. Sudlow C et al. UK Biobank: an open access resource for identifying the causes of a wide range of complex diseases of middle and old age. PLoS Med. 12, e1001779 (2015). - PMC - PubMed
    1. Liu X, Wu C, Li C & Boerwinkle E dbNSFP v3.0: a one-stop database of functional predictions and annotations for human nonsynonymous and splice-site SNVs. Hum. Mutat 37, 235–241 (2016). - PMC - PubMed
    1. McLaren W et al. The Ensembl Variant Effect Predictor. Genome Biol 17, 122 (2016). - PMC - PubMed
    1. Zhou W et al. Efficiently controlling for case-control imbalance and sample relatedness in large-scale genetic association studies. Nat. Genet 50, 1335–1341 (2018). - PMC - PubMed
    1. Heinze G A comparative investigation of methods for logistic regression with separated or nearly separated data. Statistics in Medicine 25, 4216–4226 (2006). - PubMed

Publication types

MeSH terms