. 2022 Feb;28(2):303-314.
doi: 10.1038/s41591-022-01688-4. Epub 2022 Feb 17.

Microbiome and metabolome features of the cardiometabolic disease spectrum

Sebastien Fromentin #  1 Sofia K Forslund #  2   3   4   5   6 Kanta Chechi #  7   8   9 Judith Aron-Wisnewsky #  10   11 Rima Chakaroun #  12 Trine Nielsen #  13 Valentina Tremaroli  14 Boyang Ji  15 Edi Prifti  10   16 Antonis Myridakis  7 Julien Chilloux  7 Petros Andrikopoulos  7   9 Yong Fan  13 Michael T Olanipekun  7   9 Renato Alves  2 Solia Adiouch  10 Noam Bar  17   18 Yeela Talmor-Barkan  17   18   19   20 Eugeni Belda  10   21   22 Robert Caesar  14 Luis Pedro Coelho  2 Gwen Falony  23   24 Soraya Fellahi  25 Pilar Galan  1 Nathalie Galleron  1 Gerard Helft  26 Lesley Hoyles  7   27 Richard Isnard  26 Emmanuelle Le Chatelier  1 Hanna Julienne  1 Lisa Olsson  14 Helle Krogh Pedersen  13 Nicolas Pons  1 Benoit Quinquis  1 Christine Rouault  10 Hugo Roume  1 Joe-Elie Salem  28 Thomas S B Schmidt  2 Sara Vieira-Silva  23   24 Peishun Li  15 Maria Zimmermann-Kogadeeva  2 Christian Lewinter  29 Nadja B Søndertoft  13 Tue H Hansen  13 Dominique Gauguier  30 Jens Peter Gøtze  31 Lars Køber  29 Ran Kornowski  19 Henrik Vestergaard  13   32 Torben Hansen  13 Jean-Daniel Zucker  10   16 Serge Hercberg  33 Ivica Letunic  34 Fredrik Bäckhed  13   14 Jean-Michel Oppert  11 Jens Nielsen  15 Jeroen Raes  23   24 Peer Bork  2 Michael Stumvoll  12 Eran Segal  17   18 Karine Clément  35   36 Marc-Emmanuel Dumas  37   38   39 S Dusko Ehrlich  40   41 Oluf Pedersen  42
Affiliations

Microbiome and metabolome features of the cardiometabolic disease spectrum

Sebastien Fromentin et al. Nat Med. 2022 Feb.

Abstract

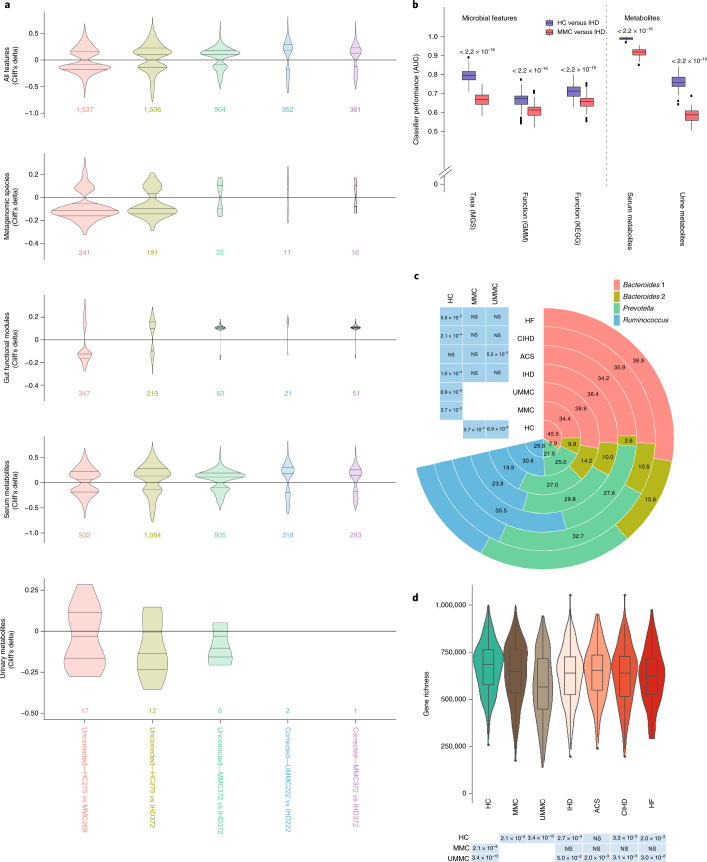
Previous microbiome and metabolome analyses exploring non-communicable diseases have paid scant attention to major confounders of study outcomes, such as common, pre-morbid and co-morbid conditions, or polypharmacy. Here, in the context of ischemic heart disease (IHD), we used a study design that recapitulates disease initiation, escalation and response to treatment over time, mirroring a longitudinal study that would otherwise be difficult to perform given the protracted nature of IHD pathogenesis. We recruited 1,241 middle-aged Europeans, including healthy individuals, individuals with dysmetabolic morbidities (obesity and type 2 diabetes) but lacking overt IHD diagnosis and individuals with IHD at three distinct clinical stages-acute coronary syndrome, chronic IHD and IHD with heart failure-and characterized their phenome, gut metagenome and serum and urine metabolome. We found that about 75% of microbiome and metabolome features that distinguish individuals with IHD from healthy individuals after adjustment for effects of medication and lifestyle are present in individuals exhibiting dysmetabolism, suggesting that major alterations of the gut microbiome and metabolome might begin long before clinical onset of IHD. We further categorized microbiome and metabolome signatures related to prodromal dysmetabolism, specific to IHD in general or to each of its three subtypes or related to escalation or de-escalation of IHD. Discriminant analysis based on specific IHD microbiome and metabolome features could better differentiate individuals with IHD from healthy individuals or metabolically matched individuals as compared to the conventional risk markers, pointing to a pathophysiological relevance of these features.


Conflict of interest statement

F.B. is a shareholder in Implexion Pharma. K.C. is a consultant for Danone Research, LNC Therapeutics and CONFO Therapeutics for work that is unassociated with the present study. K.C. has held a collaborative research contract with Danone Research in the context of the MetaCardis project. The other authors declare no competing interests.

Figures

Fig. 1
Fig. 1. Overview of the study design.
Top: the 1,241 individuals studied here are a subset of individuals from the European MetaCardis cohort, in which participants underwent deep bioclinical phenotyping combined with gut microbiome and serum and urine metabolome profiling. Participants were classified as being HCs (n = 275, healthy by self-report and no intake of lipid-lowering, anti-diabetic or anti-hypertensive drugs) and a combined group of patients diagnosed with IHD (n = 372, on various drugs). The IHD group included cases with ACS (n = 112), CIHD (n = 158) and HF (n = 102) due to CIHD. Two additional control groups were included: MMCs without diagnosed IHD (n = 372, matched on age, BMI and T2D status of the individuals with IHD, some of whom were prescribed lipid-lowering, anti-diabetic and anti-hypertensive medication but no IHD-related drugs) and untreated (non-medicated) metabolically matched non-IHD controls (UMMCs, n = 222, no intake of lipid-lowering, anti-diabetic, anti-hypertensive or IHD drugs). Bottom: microbiome and metabolome features were segregated into four categories, as indicated. The human icons were adapted from https://smart.servier.com/.
Fig. 2
Fig. 2. Alterations of gut microbiome and metabolome features along the natural history of IHD.
a, Violin plots representing the distribution of significant gut microbiome and metabolome features among various group comparisons before and after data being subjected to the drug deconfounding pipeline (lower line, lower quartile; medium line, median; upper line, upper quartile). Numbers below each subplot represent total features in the respective group comparison (shown as x axis) that retained significance (FDR ≤ 0.1) plotted against the Cliff’s delta (y axis) for each set of features before (uncorrected) or after drug deconfounding (corrected). b, Box plots showing classifier performance comparison using HCs or MMCs as controls relative to individuals with IHD, based either on all microbial features (left) or on quantified metabolome features (right) as input (center line, median; box limits, upper and lower quartiles; whiskers, 1.5× interquartile range; points, outliers). Two-sided MWU P values are included for each comparison. c, Pie chart (right) comparing the percent (shown as numbers) distribution of four enterotypes among various study groups. Table (left) shows the chi-squared P value for each study group relative to the three control groups—that is, HC, MMC and UMMC. d, Box plots (upper) comparing gut bacterial gene richness among the indicated study groups (violin, distribution; center line, median; box limits, upper and lower quartiles; whiskers, 1.5× interquartile range; points, outliers). Table (below) shows the two-sided MWU P values for each study group relative to the three control groups—that is, HC, MMC and UMMC. Two-sided MWU and chi-squared tests were used for assessing the significance of group-wise comparisons in a, b, d and c, respectively, using HC (n = 275), MMC (n = 372), UMMC (n = 222), IHD (n = 372), ACS (n = 112), CIHD (n = 158) and HF (n = 102) groups. Multiple testing corrections were done using the Benjamini–Hochberg method, and FDR ≤ 0.1 was considered significant. NS, not significant.
Fig. 3
Fig. 3. Approach used for categorization of microbiome and metabolome features in the cross-sectional study.
ad, Gut microbiome and plasma and urine metabolome features that exhibited a statistically significant shift uniquely when treated MMCs, untreated UMMCs and treated individuals with IHD were compared with HCs were categorized as DMFs (a,b) as these features exhibited significant alterations in association with metabolic syndrome (that is, obesity and T2D) and not IHD per se. In contrast, gut microbiome and plasma and urine metabolome features that exhibited a significant change when either MMCs or UMMCs were compared with individuals with IHD were categorized as IHDFs. In addition, features exhibiting a significant change in individuals with IHD relative to HCs were categorized as IHDFs when they exhibited a simultaneous significant shift in individuals with IHD relative to MMCs or UMMCs (a,c). Next, we considered the natural trajectory of IHD in two stages—that is, HCs versus MMCs or UMMCs (representing the dysmetabolism stage) and MMCs or UMMCs versus individuals with IHD (representing the IHD stage). Features exhibiting a significant change under both dysmetabolic and IHD stages and in the same direction (representing disease progression) were thus labeled as ESCFs (a,d), whereas those exhibiting a significant change in the reverse direction (representing disease stabilization) were labeled as DSCFs (a,d). Our approach evaluated every feature across all group comparisons using the criteria of (1) non-confounded status (that is, feature cannot be confounded by any tested host variables, including drug treatment); (2) significance status (that is, feature has to exhibit FDR < 0.1 for respective group comparison); and (3) a directional alignment status (that is, direction of change when disease stages are considered) for categorization as DMF (b), IHDF (c), ESCF or DSCF (d). (See Extended Data Fig. 4 and Methods for more details.) The arrow size further reflects the number of features identified by each route for respective categorization: 767 DMFs, 283 IHDFs and 98 each of ESCFs and DSCFs were identified. Two-sided MWU was used for assessing the significance of group-wise comparisons using HC (n = 275), MMC (n = 372), UMMC (n = 222) and IHD (n = 372) groups. Multiple testing corrections were done using the Benjamini–Hochberg method, and FDR ≤ 0.1 was considered significant. The human icons were adapted from https://smart.servier.com/.
Fig. 4
Fig. 4. Microbiome and metabolome features linked with IHD and its dysmetabolic pre-morbidities.
Using the categorization scheme described in Fig. 3 and Extended Data Fig. 4, gut microbiome and metabolome markers were categorized as DMFs, IHDFs, ESCFs or DSCFs, of which IHDFs (a), ESCFs (b) and DSCFs (c) are displayed here. In each panel, arrow length shows effect sizes (Cliff’s delta) for respective group comparisons. Cliff’s delta for HC versus IHD comparisons are displayed for IHDFs (a), whereas Cliff’s delta for both HC versus MMC and MMC versus IHD are displayed for ESCFs (b) and DSCFs (c), with arrowhead pointing to the direction of change. Only features exhibiting an absolute effect size greater than 0.1 are displayed, inclusive of serum metabolites, metagenomic species and microbial density indices (see Supplementary Table 17 for a description of effect sizes and confounding status). Two-sided MWU was used for assessing the significance of group-wise comparisons using HC (n = 275), MMC (n = 372), UMMC (n = 222) and IHD (n = 372) groups. Multiple testing corrections were done using the Benjamini–Hochberg method, and FDR ≤ 0.1 was considered significant. *The metabolite was not validated by an internal standard but confirmed with great confidence according to information from Metabolon (Methods) who performed the analysis. **An internal standard for the metabolite was not available but was confirmed with reasonable confidence according to information from Metabolon (Methods) who performed the analysis.
Fig. 5
Fig. 5. Metabolome and microbiome features altered uniquely in IHD and its subtypes.
Circle plot shows gut microbial species and serum metabolites that were categorized as being specific to IHD or to its subtypes—ACS, CIHD and HF due to CIHD as per our categorization scheme shown in Fig. 3 and Extended Data Fig. 4. Each layer shows effect sizes (Cliff’s delta) for individual features that were either enriched or depleted in cases (IHD or its subtypes) versus HCs (see also Supplementary Table 17 for all features listed as being specific to IHD and its subtypes). Only features exhibiting absolute effect sizes greater than 0.1 for HC versus IHD are displayed. *The metabolite was not validated by an internal standard but confirmed with great confidence according to information from Metabolon (Methods) who performed the analysis. **An internal standard for the metabolite was not available but was confirmed with reasonable confidence according to information from Metabolon (Methods) who performed the analysis.
Fig. 6
Fig. 6. Validation of markers for ACS.
ac, For the gut microbial and plasma metabolome features common to both MetaCardis and Israeli cohorts, a Spearman correlation analysis (a) was conducted between the effect sizes (Cliff’s delta) for HC versus ACS comparison in each study after recalculating Cliff’s deltas in the Israeli population. Next, ROC curves depicting the classifier performance (AUROC) of five-fold cross-validated O-PLS-DA models based on the overlapped set of ACS biomarkers in three settings are shown for MetaCardis as the training population (b) and Israeli cohort as the test population (c). Model 1 included nine clinical ACS risk variables—that is, age, sex, BMI, systolic blood pressure, diastolic blood pressure, glycated hemoglobin (factored as >5.7, 5.7–6.4 and <6.4 mmol l−1), smoking status, fasting total cholesterol and HDL cholesterol (mmol l−1). Model 2 included ACS-specific biomarkers identified in our study that were also found in ref. (118 variables), whereas model 3 involved all variables considered for model 1 and model 2 (that is, 127 variables). Two-sided MWU was used for assessing the significance of group-wise comparisons using HC (n = 275) and ACS (n = 112) in MetaCardis population and HC (n = 473) versus ACS (n = 156) in the Israeli population. Multiple testing corrections were done using the Benjamini–Hochberg method, and FDR ≤ 0.1 was considered significant.
Extended Data Fig. 1
Extended Data Fig. 1. Overview of selected bio-clinical variables of the various groups.
Box plots (above) representing the distribution of key bio-clinical variables in various study groups (lower line, lower quartile; medium line, median; upper line, upper quartile). Table (below) shows the two-sided MWU P for respective group comparisons using HC (n = 275), MMC (n = 372), UMMC (n = 222), IHD (n = 372), ACS (n = 112), CIHD (n = 158), HF (n = 102). IHD: ischemic heart disease patients, HC: healthy controls, MMC: metabolically matched controls, UMMC unmedicated metabolically matched controls, ACS: acute coronary syndrome, CIHD: chronic IHD, HF: heart failure due to CIHD, BMI: body mass index; HbA1c: glycated haemoglobin, pro-ANP: pro-atrial natriuretic peptide, MWU: Mann-Whitney U.
Extended Data Fig. 2
Extended Data Fig. 2. Microbiome findings from the literature.
Cuneiform plot shows literature review of gut microbial taxonomic and predicted functional features reported to be associated with IHD, while highlighting their individual replication in the present MetaCardis study group either as a general dysmetabolism biomarker (seen only in case of HC versus MMC), or as an IHD biomarker (seen also in case of MMC versus IHD) (Supplementary Table 15). The literature review was performed as a keyword search in PubMed (Medline) using combinations of the words ‘microbiota’ and ‘microbiome’ with the word ‘atherosclerosis’, ‘cardiovascular disease’, ‘coronary artery disease’, ‘ischemic heart disease’, ‘myocardial infarction’, ‘acute coronary syndrome’, ‘angina pectoris’ and ‘heart failure’. Studies were identified that met the following criteria: 1) published during the recent 15 years, 2) reporting data from human studies with at least 15 participants, 3) using culture-independent methods for microbiota profiling and 4) evaluating the link between human microbiota and manifestations of impaired heart disease (Supplementary Table 16). Results on functional features were derived from four studies using whole-genome shotgun sequencing,,. Results imputed from 16 S rRNA gene analyses were not included. Point marker color and size reflect MetaCardis findings (Cliff’s delta), with arrows displaying direction of effects. Literature findings are shown at a uniform effect size. Markers are shown only for features significantly different in abundance (FDR < 0.1) and have a bold border if they cannot be reduced to the confounding influence of any drug or drug combination prescribed to treat dysmetabolism. While the majority of literature findings are recaptured in our study when comparing HC and IHD, relatively fewer were found in MMC and IHD comparisons, implying them to be general markers of dysmetabolism rather than being IHD-only microbiome markers. Two-sided MWU tests were used for assessing the significance of group-wise comparisons using HC (n = 275), MMC (n = 372), UMMC (n = 222) and IHD (n = 372) groups. Multiple testing corrections were done using Benjamini-Hochberg method and FDR < = 0.1 was considered significant. IHD: ischemic heart disease patients, HC: healthy controls, MMC: metabolically matched controls, MWU: Mann-Whitney-U tests, FDR: false-discovery rate.
Extended Data Fig. 3
Extended Data Fig. 3. Distribution of differential features among various group comparisons pre- and post- deconfounding.
(a) Venn diagrams showing the comparative shift in the number of gut microbiome and metabolome features that remain differentially abundant (FDR < 0.1) in various group comparisons when healthy individuals (HC) and drug-treated IHD cases are compared to untreated metabolically matched controls (UMMC) or (b) drug-treated metabolically matched controls (MMC) without any adjustments for potential confounders followed by (c) drug-deconfounding. Two-sided MWU tests were used for assessing the significance of group-wise comparisons using HC (n = 275), MMC (n = 372), UMMC (n = 222) and IHD (n = 372) groups. Multiple testing corrections were done using Benjamini-Hochberg method and FDR < = 0.1 was considered significant. IHD: ischemic heart disease patients, MWU: Mann-Whitney-U tests, FDR: false-discovery rate.
Extended Data Fig. 4
Extended Data Fig. 4. Operational classification of microbiome and metabolome features from the perspective of IHD pathology.
A classification tree was constructed based on significance and alignment of effect size and directionality of microbiome and metabolome features in the various group comparisons leading to the identification of: Features that reflect metabolic dysregulation in the individual but are not associated with diagnosed IHD: dysmetabolism features (DMF). Features that are significantly associated with IHD but are also significantly altered in metabolically dysregulated individuals in the same direction; we suggest that these features are early markers of IHD pathogenesis in individuals with metabolic dysregulation: IHD escalation features (ESCF). Features that are significantly associated with IHD but are also significantly altered in metabolically dysregulated individuals in the reverse direction; we suggest that these features are early markers of IHD seen in metabolically dysregulated individuals. However, they exhibit reversibility. This may plausibly be due to 1) long-term drug-treatment and improvement in overall lifestyle of the IHD individuals, 2) a compensatory response to the initiation of disease or 3) a trajectory-associated differential response to disease development. We propose that some of these features contribute to the stabilization of IHD and dysmetabolism and we coin those IHD de-escalation features (DSCF). IHD-specific features (IHDF) that achieve a significant shift only under IHD diagnoses. Two-sided MWU tests were used for assessing the significance of group-wise comparisons using HC (n = 275), MMC (n = 372), UMMC (n = 222), IHD (n = 372), ACS (n = 112), CIHD (n = 158), HF (n = 102) groups. Multiple testing corrections were done using Benjamini-Hochberg method and FDR < = 0.1 was considered significant. HC: healthy controls, MMC: metabolically matched controls, UMMC unmedicated metabolically matched controls, IHD: ischemic heart disease, ACS: acute coronary syndrome, CIHD: chronic IHD, HF: heart failure due to IHD, MWU: Mann-Whitney U, FDR: false-discovery rate.
Extended Data Fig. 5
Extended Data Fig. 5. Gut microbial functional features categorization.
Gut microbial functional features (GMM and KEGG modules) categorized as escalation-, de-escalation-, and IHD-specific biomarkers when features classification scheme (as shown in Fig. 3, Extended Data Fig. 4 and described in supplementary methods) was applied to various group comparisons involving HC, MMC and IHD subjects. HC: healthy controls, MMC: metabolically matched controls, IHD: ischemic heart disease.
Extended Data Fig. 6
Extended Data Fig. 6. Features categorization for ACS subgroup.
Microbiome and metabolome features categorized as escalation-, de-escalation-, and ACS-specific biomarkers when features classification scheme (as shown in Fig. 3, Extended Data Fig. 4 and described in supplementary methods) was applied to various group comparisons involving HC, MMC and ACS groups. HC: healthy controls, MMC: metabolically matched controls, ACS: acute coronary syndrome, ESCF: escalation features, DSCF: De-escalation features. Gut microbiome features included taxonomic (prefix: Taxon) and microbiome density indices, whereas metabolome features included serum and urinary metabolites. Only features exhibiting absolute effect size > 0.1 are displayed whereas the full list is given in Supplementary Table 17).
Extended Data Fig. 7
Extended Data Fig. 7. Features categorization for CIHD subgroup.
Microbiome and metabolome features categorized as escalation-, de-escalation- and CIHD-specific biomarkers when features classification scheme (as shown in Fig. 3, Extended Data Fig. 4 and described in supplementary methods) was applied to various group comparisons involving HC, MMC and CIHD groups. HC: healthy controls, MMC: metabolically matched controls, CIHD: chronic IHD. ESCF: escalation features, DSCF: De-escalation features. Gut microbiome features included both taxonomic (prefix: Taxon) and microbiome density indices, whereas metabolome features included serum and urinary metabolites. Only features exhibiting absolute effect size > 0.1 are displayed whereas the full list is given in Supplementary Table 17).
Extended Data Fig. 8
Extended Data Fig. 8. Features categorization for HF subgroup.
Microbiome and metabolome features categorized as escalation-, de-escalation- and HF-specific biomarkers when features classification scheme (as shown in Fig. 3, Extended Data Fig. 4 and described in supplementary methods) was applied to various group comparisons involving HC, MMC and HF groups. HC: healthy controls, MMC: metabolically matched controls, HF: heart failure due to CIHD. ESCF: escalation features, DSCF: De-escalation features. Gut microbiome features included both taxonomic (prefix: Taxon) and microbiome density indices, whereas metabolome features included serum and urinary metabolites. Only features exhibiting absolute effect size > 0.1 are displayed whereas the full list is given in Supplementary Table 17).
Extended Data Fig. 9
Extended Data Fig. 9. Gut microbial functional features categorization for IHD subgroups.
Microbial functional features (GMM and KEG modules) categorized as escalation-, de-escalation- and subtype-specific biomarkers when features classification scheme (as shown in Fig. 3, Extended Data Fig. 4 and described in supplementary methods) was applied to various group comparisons involving HC, MMC and IHD subgroups (that is, ACS, CIHD and HF). HC: healthy controls, MMC: metabolically matched controls, ACS: acute coronary syndrome, CIHD: chronic IHD, HF: heart failure due to CIHD. Only features exhibiting absolute effect size > 0.1 are displayed whereas the full list is given in Supplementary Table 17).
Extended Data Fig. 10
Extended Data Fig. 10. Discriminatory potential IHD subtype-specific features.
We compared clinical variables assessed for risk prediction in the companion paper (Model 1) with our IHD subgroup-specific gut microbiome and metabolomic features (Model 2) and a combination of the two (Model 3) for their discriminatory potentials using orthogonal partial least squares- discriminant analysis (O-PLS-DA; ropls r package). Model 1 included ten variables (that is age, sex, body mass index, waist circumference, hip circumference, waist to hip ratio, systolic blood pressure, diastolic blood pressure, glycated haemoglobin (factored as > 5.7, 5.7-6.4 and < 6.4 mmol/l) and smoking status). Model 2 included each IHD subgroup-specific metagenomic species and fasting serum metabolites. Model 3 involved a combination of model 1 and 2 variables. OPLS-DA models were trained on 70% of the subgroup specific sample and then tested in 30% of the remaining subgroup sample using 1000 iterations of random sampling (bootstrapping). Boxplots represent the distribution (center line, median; box limits, upper and lower quartiles; whiskers, 1.5× interquartile range; points, outliers) of area under the receiver operating characteristic (ROC) curves derived from 1000 bootstraps based on these models in the training set (A) and test set (B) using both healthy controls (HC, n = 275) and metabolically matched controls (MMC, n = 372) relative to the IHD subtype cases (ACS, n = 112, CIHD n = 158 and HF n = 102). Models were compared using Kruskal-Wallis test and Dunn’s pairwise multiple comparisons post hoc testing with Bonferroni correction. Dunn’s test P are shown for each comparison. As expected, the model performance improves significantly for model 2 and 3 relative to model 1, respectively, when either HC or MMCs are used as controls for IHD cases in test samples. HC: healthy controls, MMC: metabolically matched controls, IHD: ischaemic heart disease. ACS: acute coronary syndrome, CIHD: chronic IHD, HF: heart failure due to CIHD.

Comment in

  • Before the heart attack.
    Blaak EE, de Vos WM. Blaak EE, et al. Nat Med. 2022 Feb;28(2):237-238. doi: 10.1038/s41591-022-01685-7. Nat Med. 2022. PMID: 35177861 No abstract available.

References

    1. Heymsfield SB, Wadden TA. Mechanisms, pathophysiology, and management of obesity. N. Engl. J. Med. 2017;376:254–266. - PubMed
    1. Rothschild D, et al. Environment dominates over host genetics in shaping human gut microbiota. Nature. 2018;555:210–215. - PubMed
    1. Cotillard A, et al. Dietary intervention impact on gut microbial gene richness. Nature. 2013;500:585–588. - PubMed
    1. Karlsson FH, et al. Gut metagenome in European women with normal, impaired and diabetic glucose control. Nature. 2013;498:99–103. - PubMed
    1. Le Chatelier E, et al. Richness of human gut microbiome correlates with metabolic markers. Nature. 2013;500:541–546. - PubMed

Publication types