. 2022 May;28(5):1050-1062.
doi: 10.1038/s41591-022-01724-3. Epub 2022 Feb 17.

Immunopathological signatures in multisystem inflammatory syndrome in children and pediatric COVID-19

Keith Sacco #  1 Riccardo Castagnoli #  1   2 Svetlana Vakkilainen #  1 Can Liu #  3   4 Ottavia M Delmonte  1 Cihan Oguz  5   6 Ian M Kaplan  7 Sara Alehashemi  1 Peter D Burbelo  8 Farzana Bhuyan  1 Adriana A de Jesus  1 Kerry Dobbs  1 Lindsey B Rosen  1 Aristine Cheng  1 Elana Shaw  1 Mikko S Vakkilainen  9 Francesca Pala  1 Justin Lack  3   5 Yu Zhang  1 Danielle L Fink  10 Vasileios Oikonomou  1 Andrew L Snow  11 Clifton L Dalgard  12   13 Jinguo Chen  14 Brian A Sellers  14 Gina A Montealegre Sanchez  15 Karyl Barron  16 Emma Rey-Jurado  17 Cecilia Vial  17 Maria Cecilia Poli  17   18 Amelia Licari  2 Daniela Montagna  2   19 Gian Luigi Marseglia  2 Francesco Licciardi  20 Ugo Ramenghi  20 Valentina Discepolo  21 Andrea Lo Vecchio  21 Alfredo Guarino  21 Eli M Eisenstein  22 Luisa Imberti  23 Alessandra Sottini  23 Andrea Biondi  24 Sayonara Mató  25 Dana Gerstbacher  26 Meng Truong  1 Michael A Stack  1 Mary Magliocco  27 Marita Bosticardo  1 Tomoki Kawai  1 Jeffrey J Danielson  1 Tyler Hulett  28 Manor Askenazi  28 Shaohui Hu  28 NIAID Immune Response to COVID GroupChile MIS-C GroupPavia Pediatric COVID-19 GroupJeffrey I Cohen  29 Helen C Su  1 Douglas B Kuhns  10 Michail S Lionakis  1 Thomas M Snyder  7 Steven M Holland  1 Raphaela Goldbach-Mansky  1 John S Tsang  3   30 Luigi D Notarangelo  31
Collaborators, Affiliations

Immunopathological signatures in multisystem inflammatory syndrome in children and pediatric COVID-19

Keith Sacco et al. Nat Med. 2022 May.

Abstract

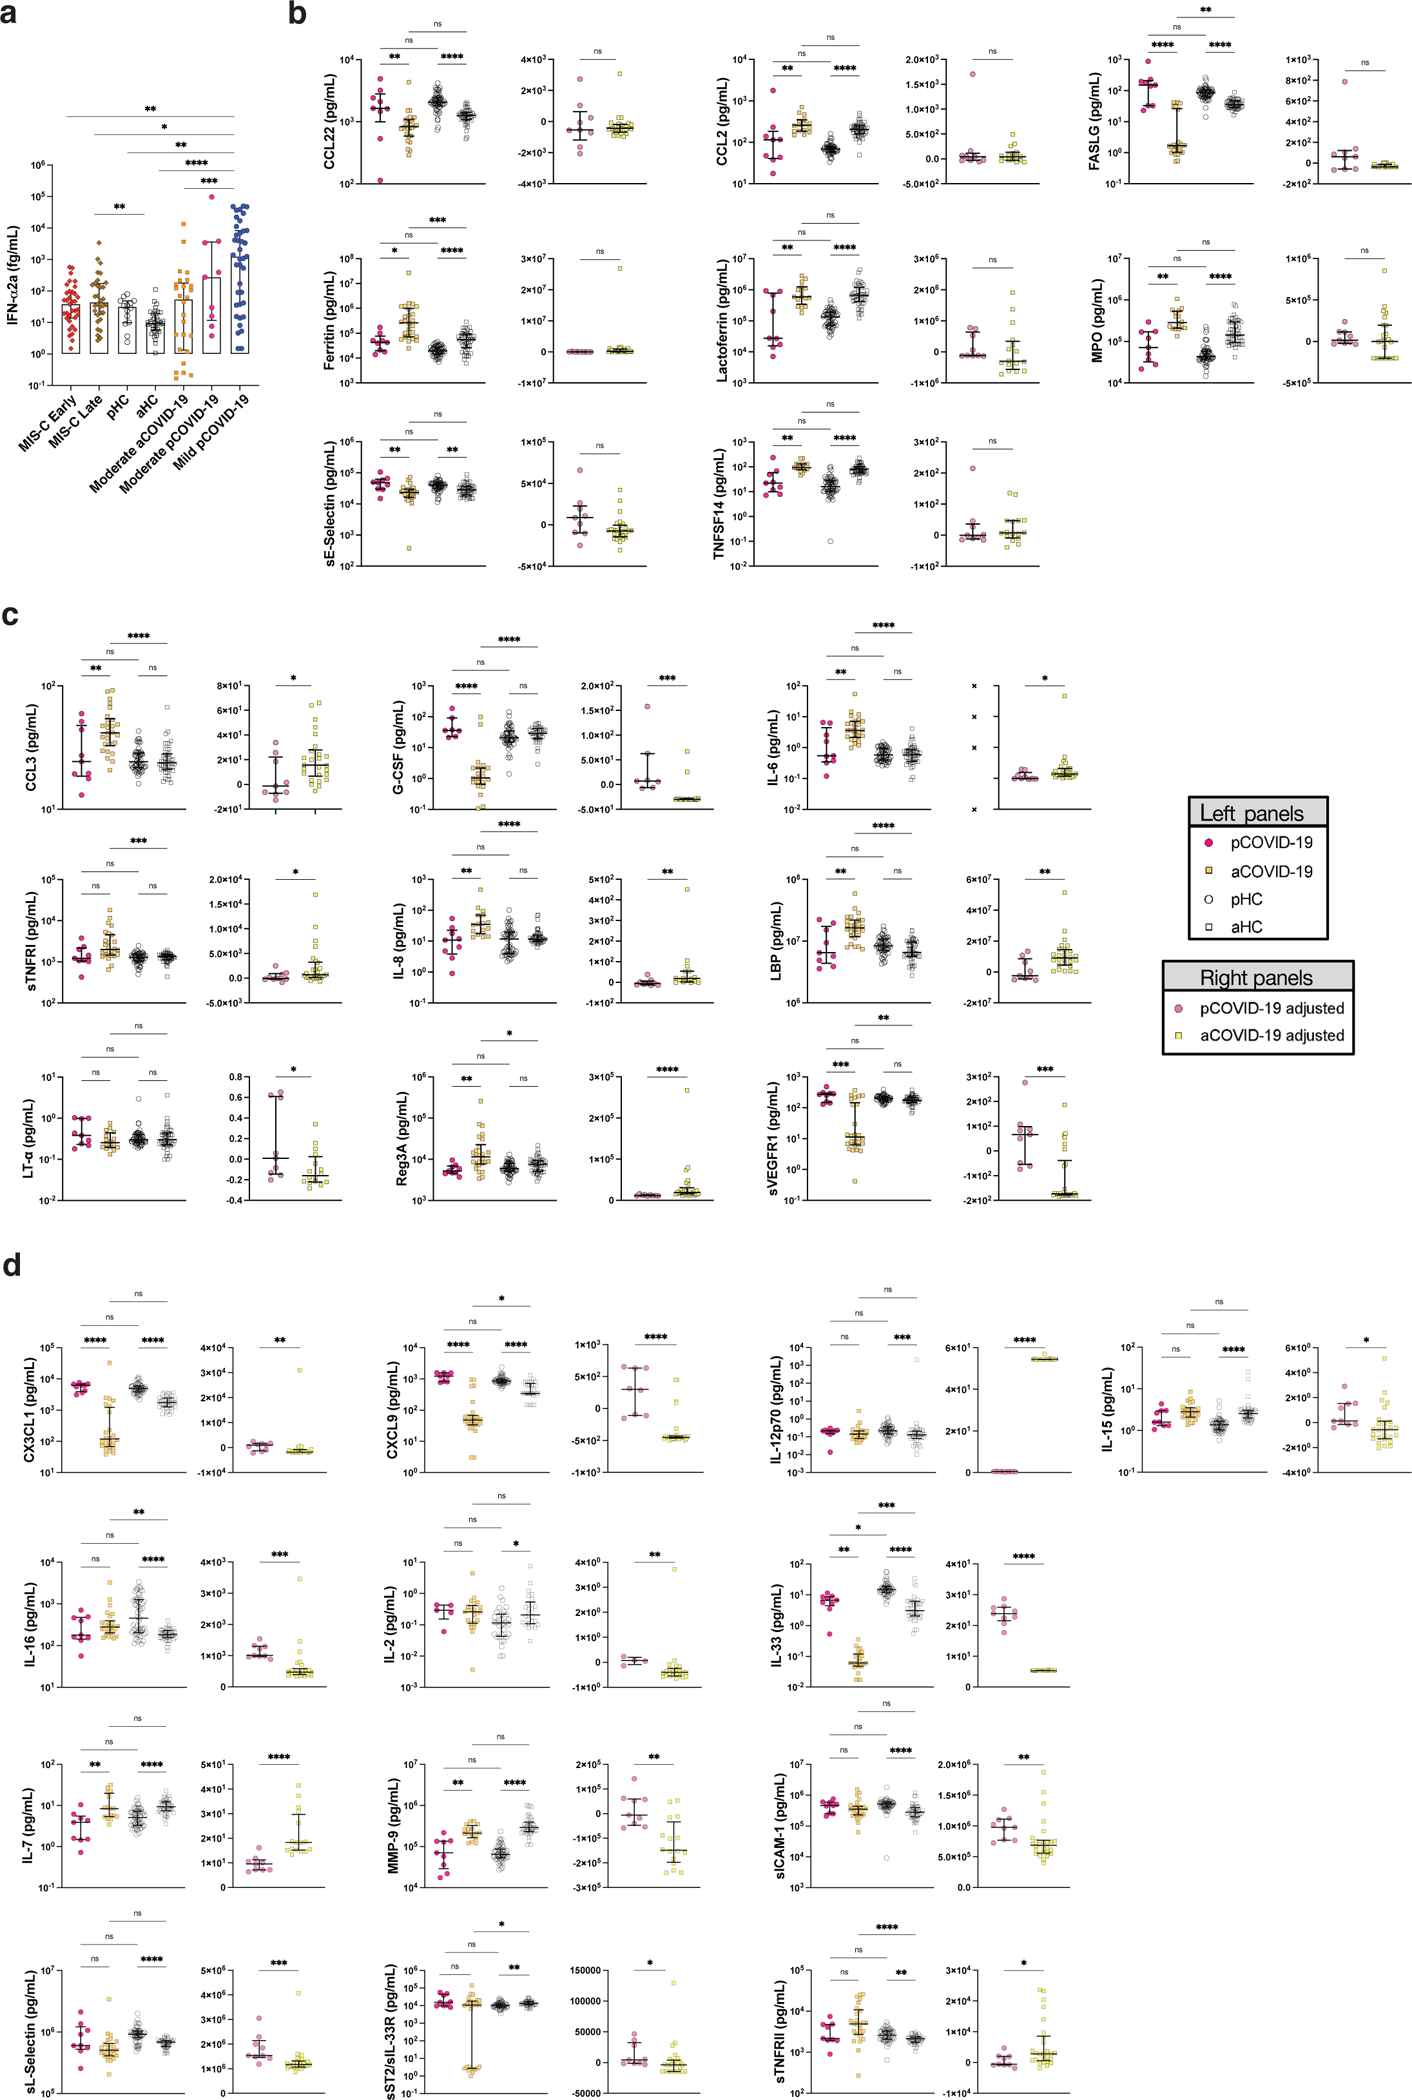
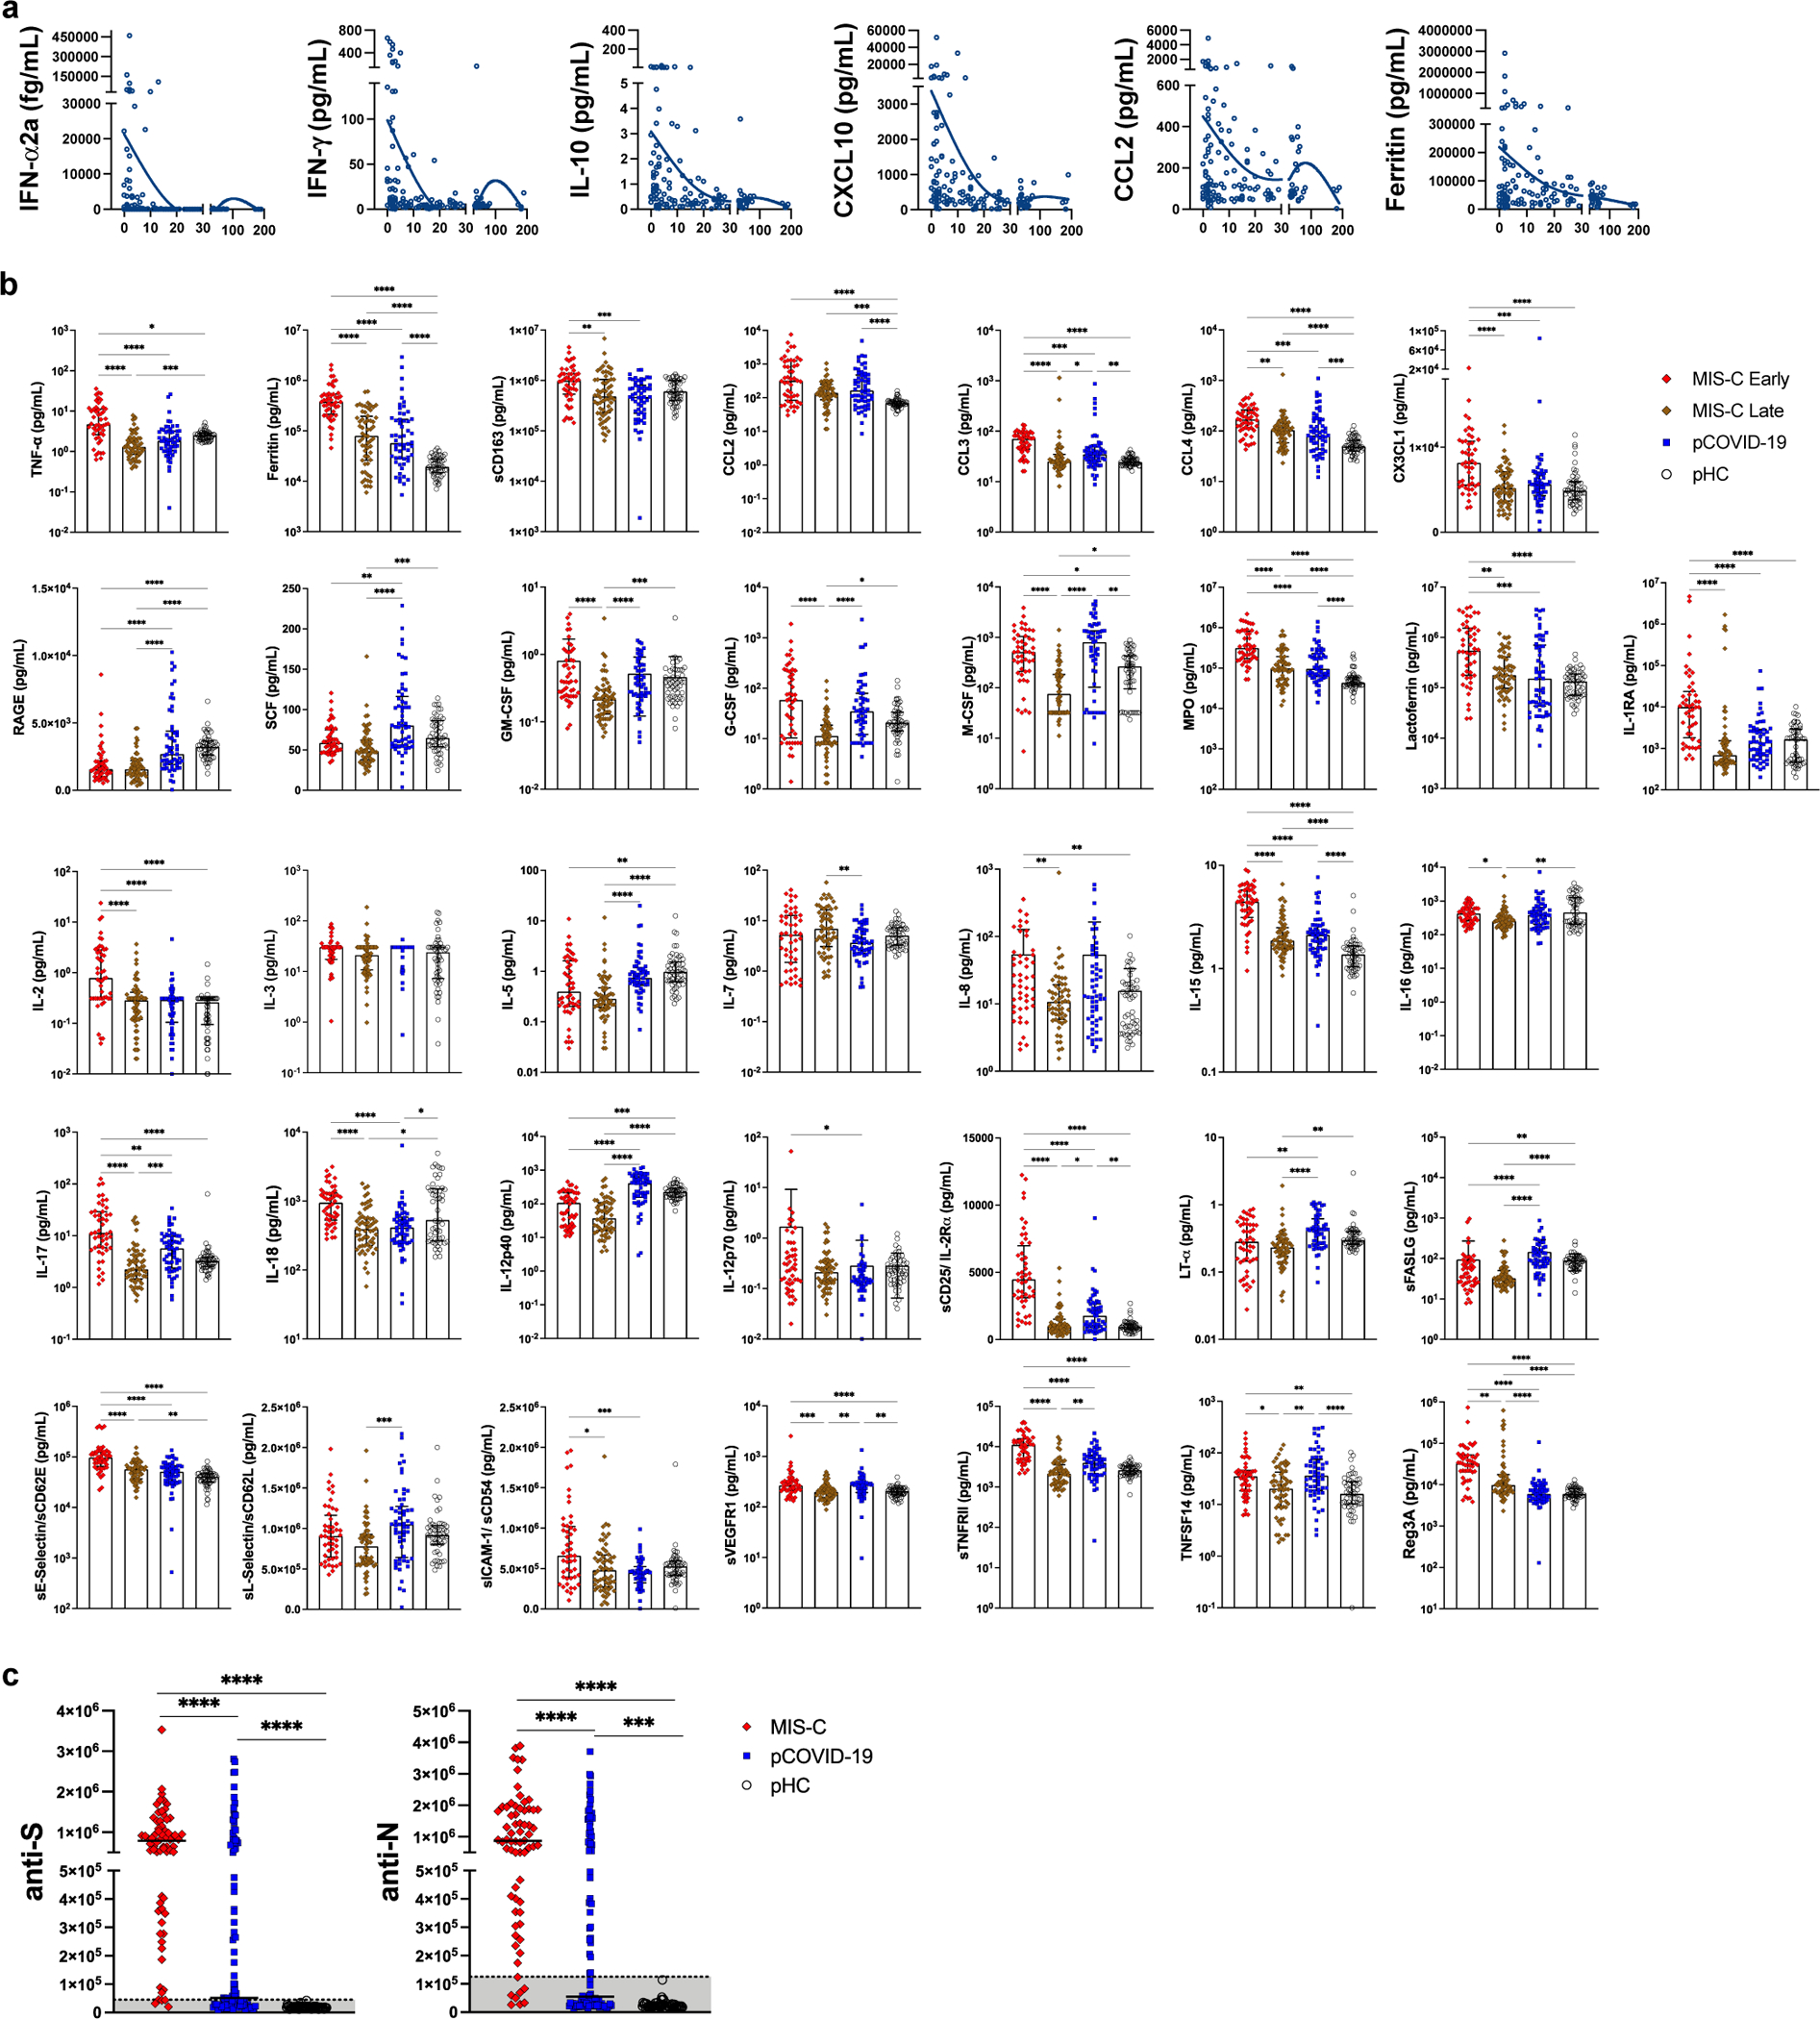
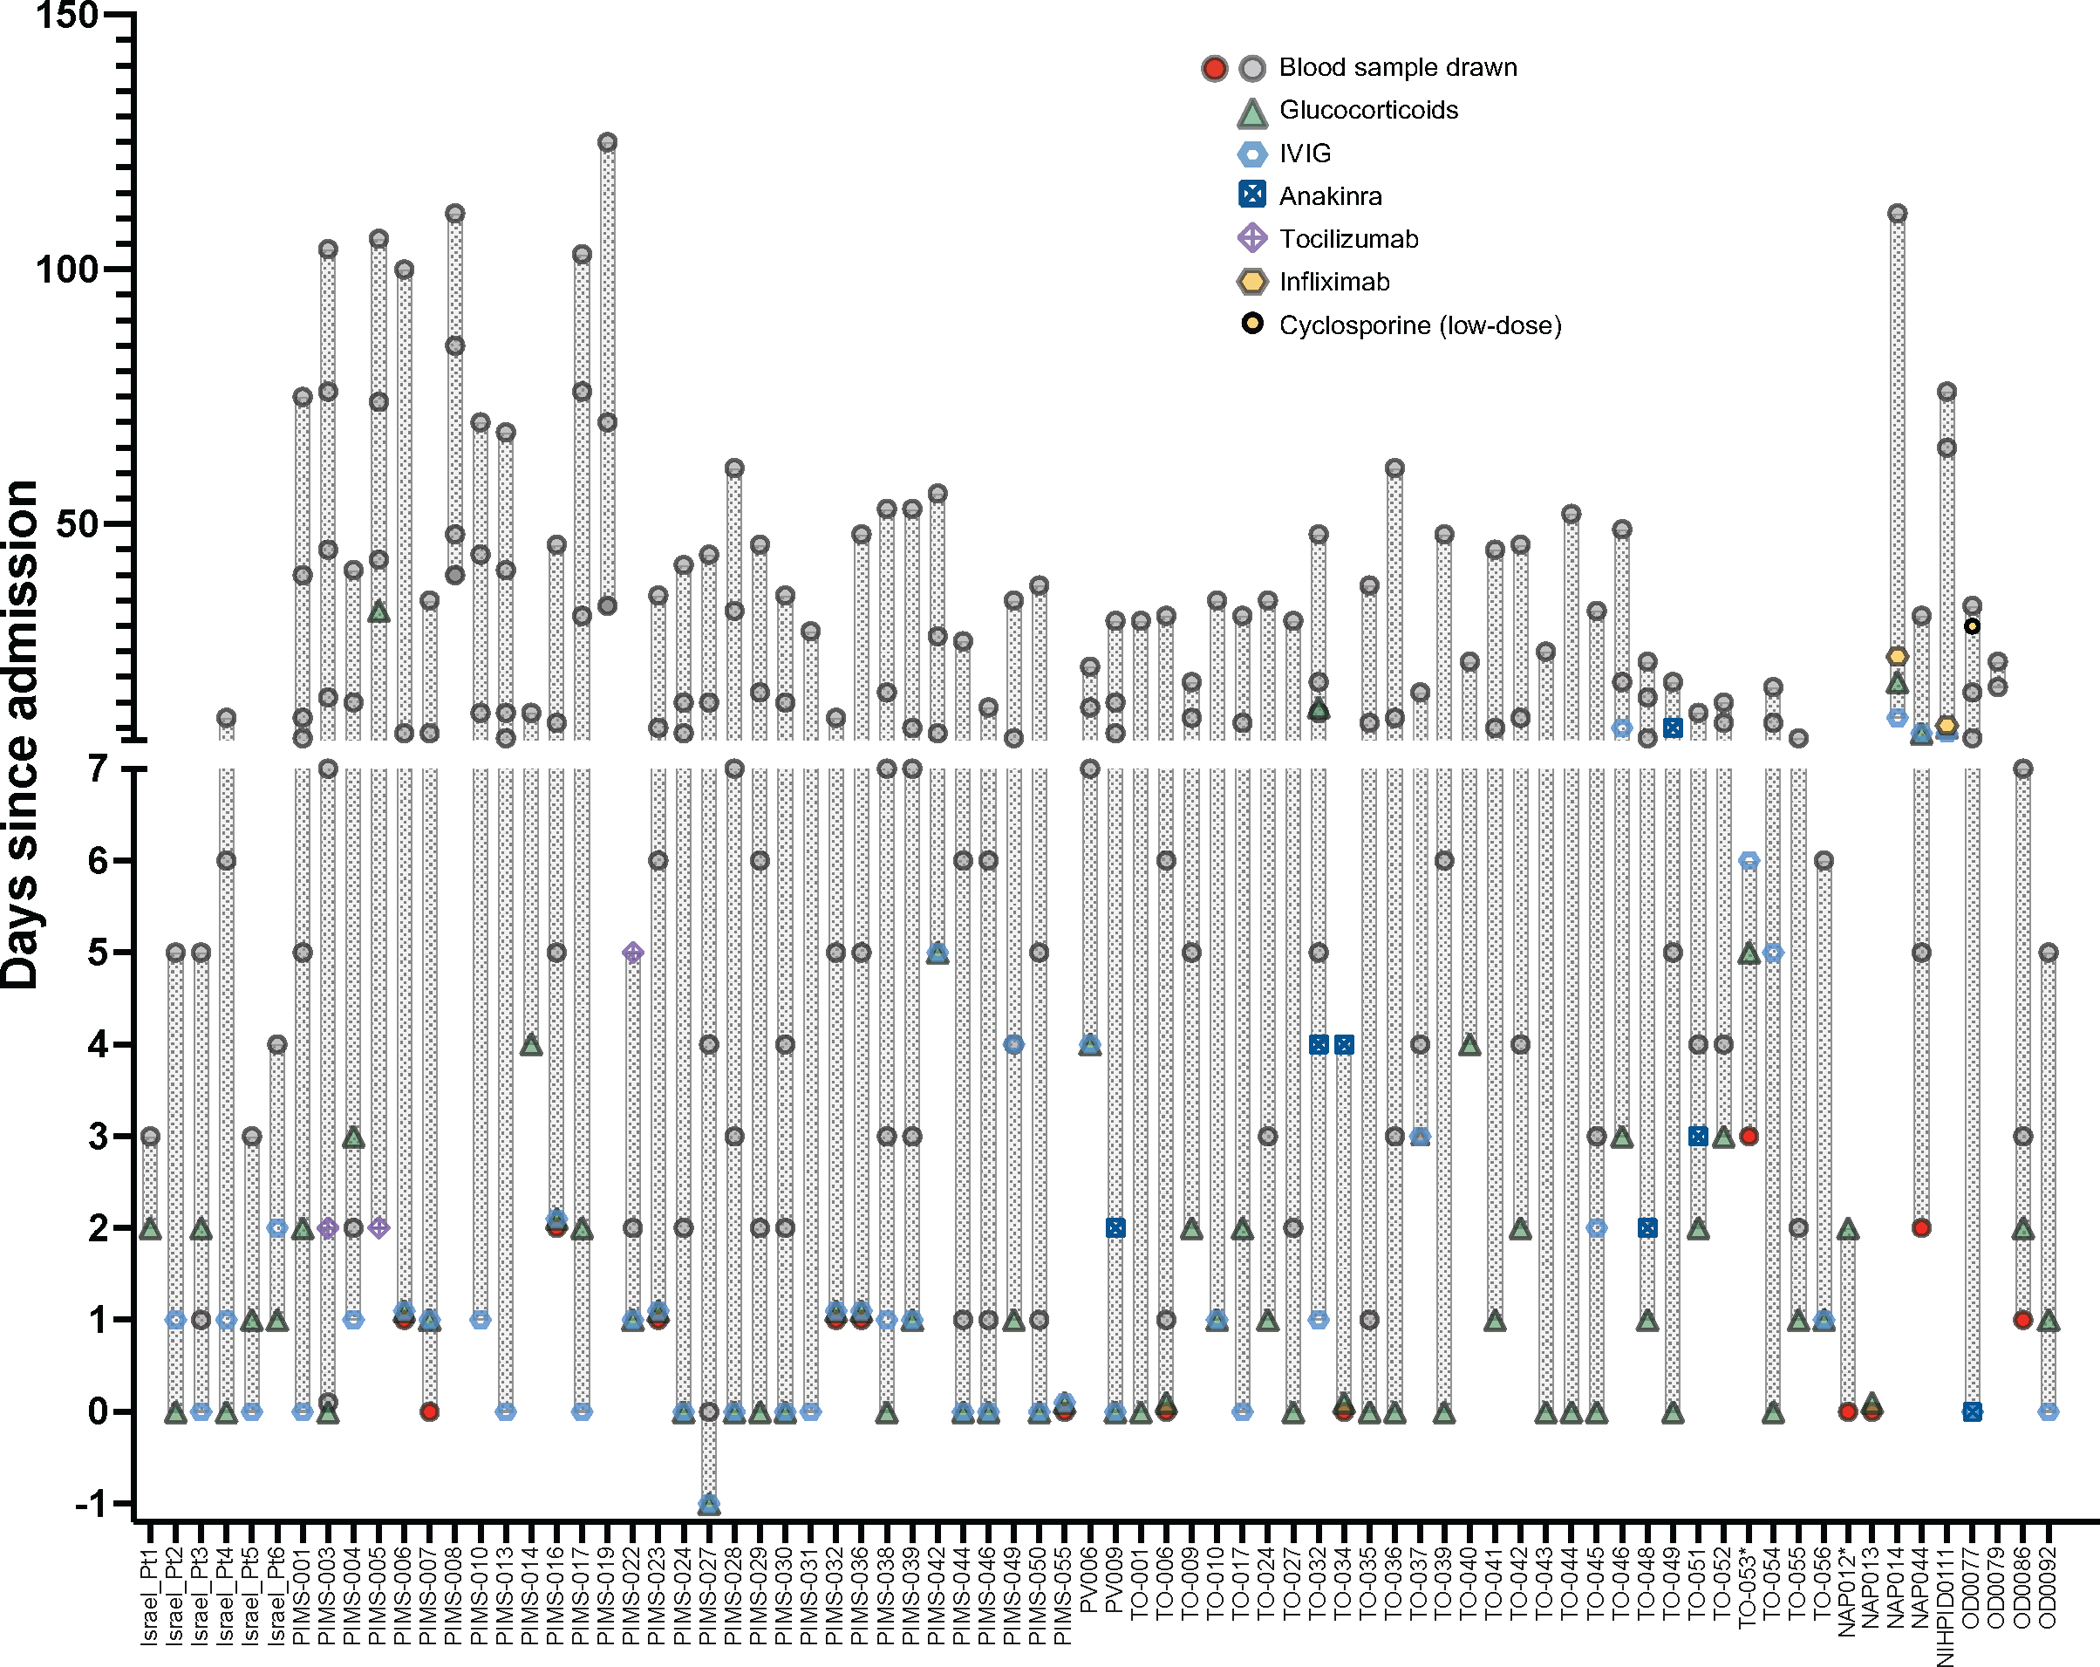
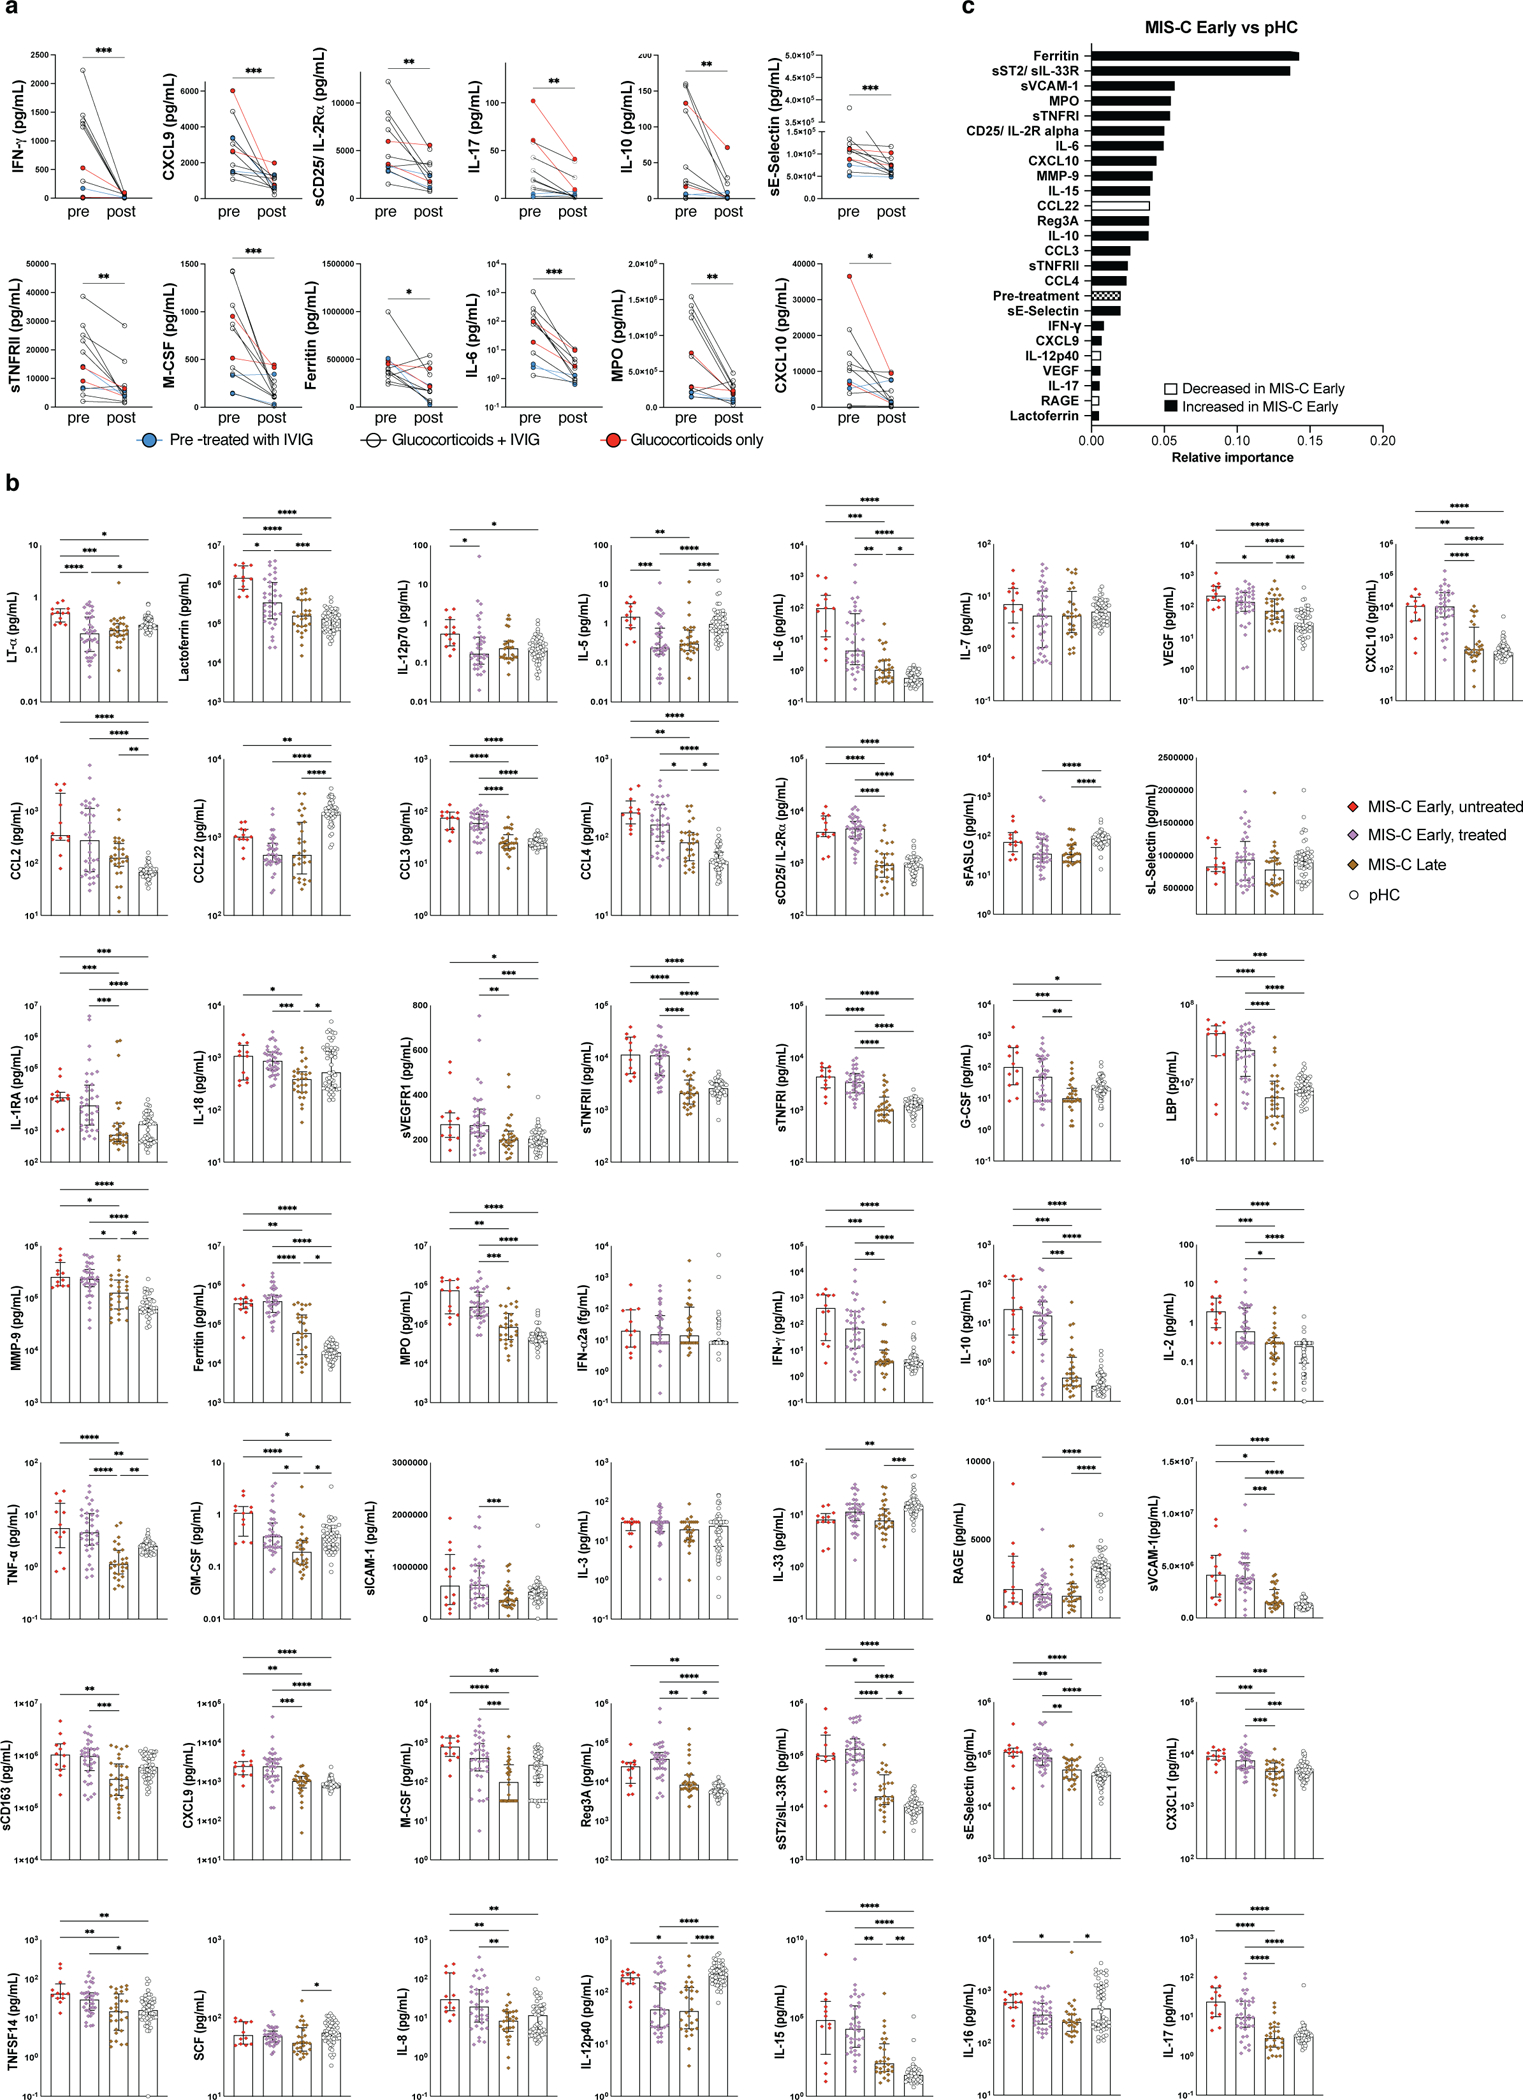
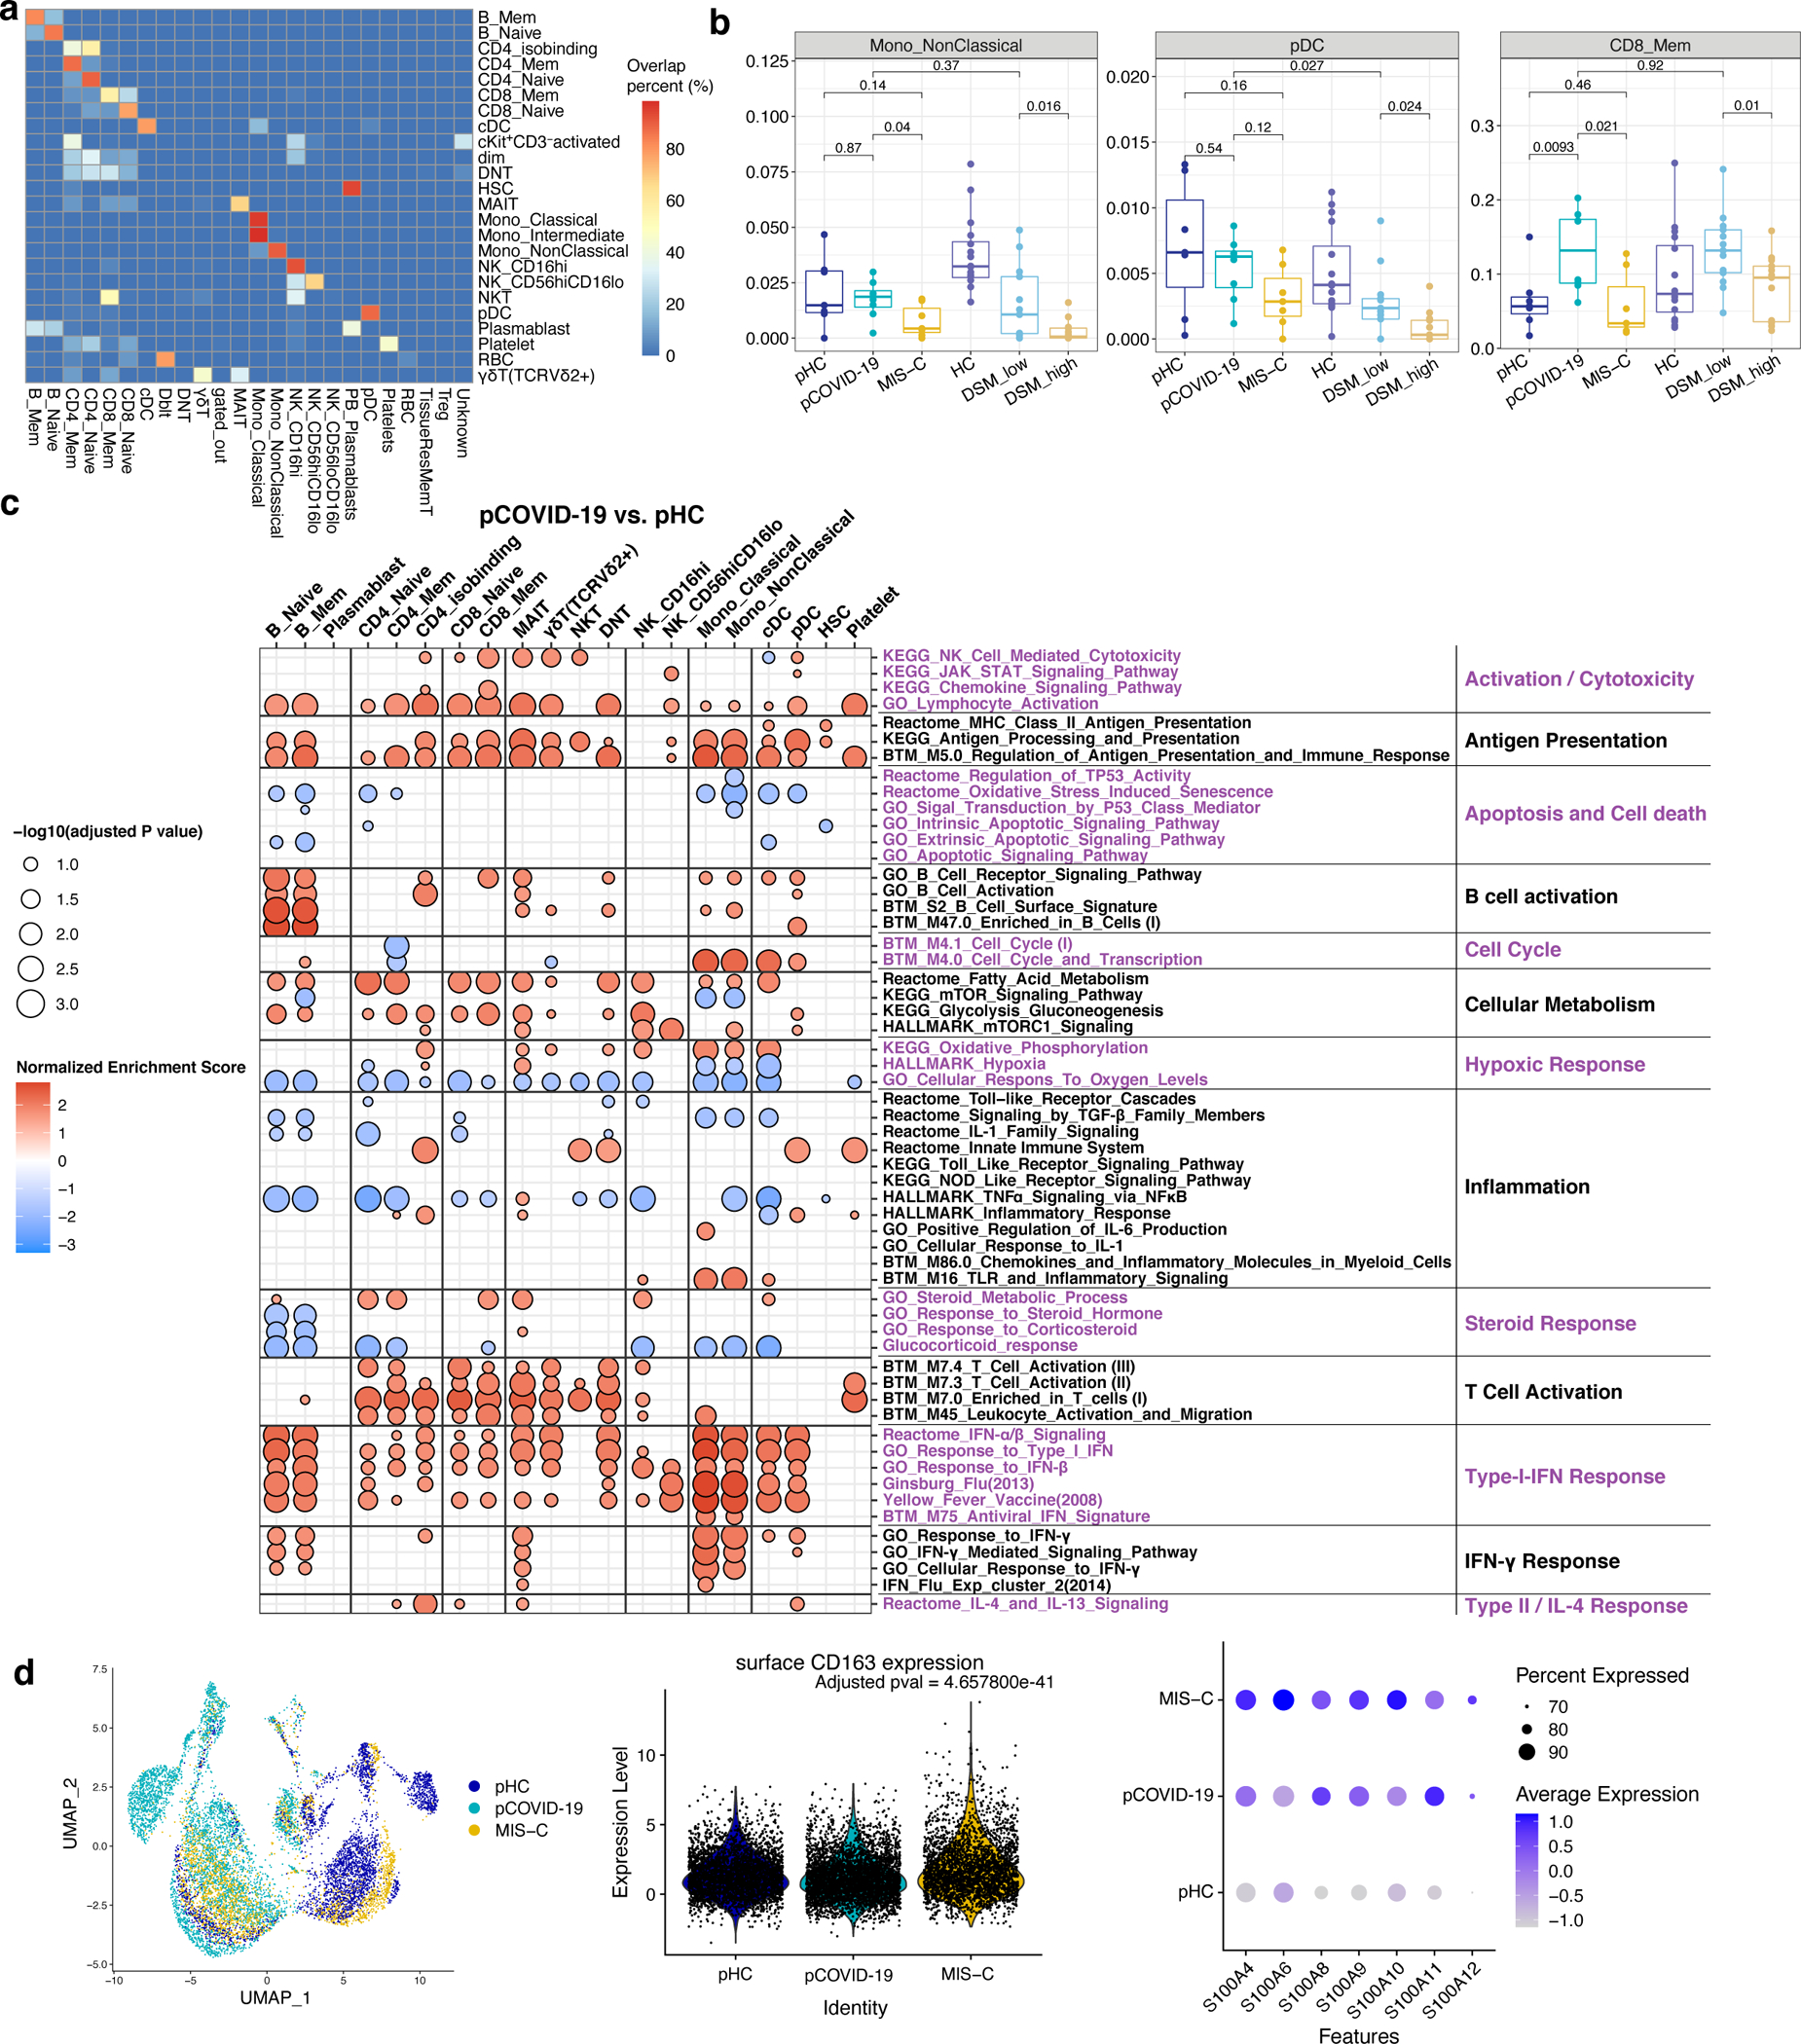
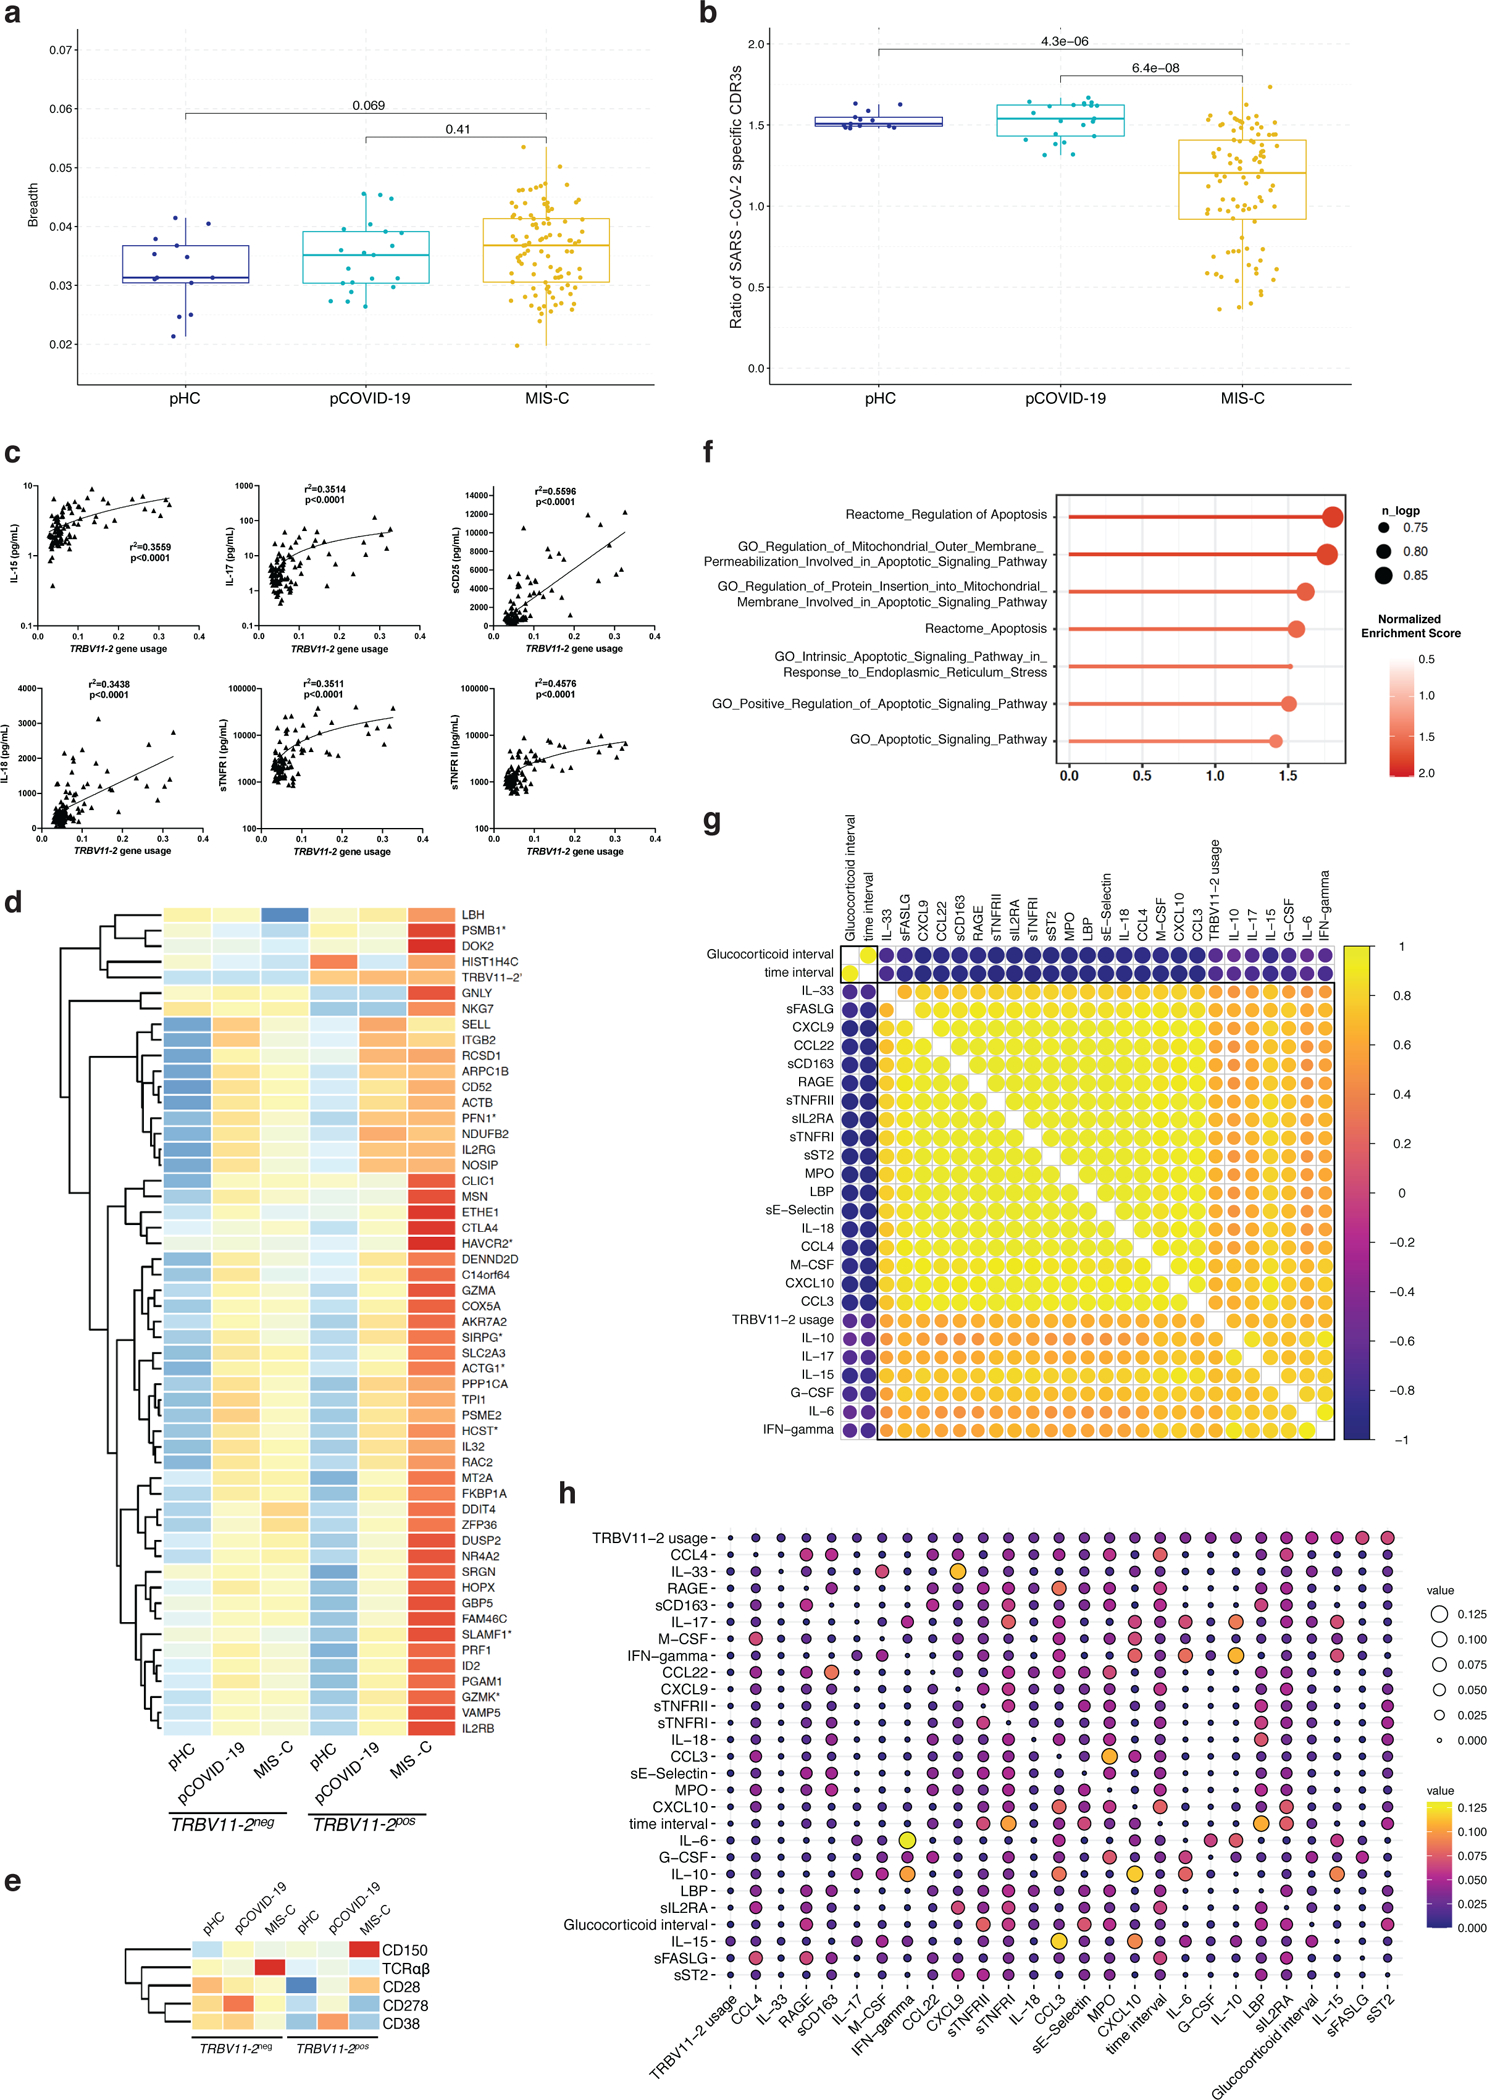
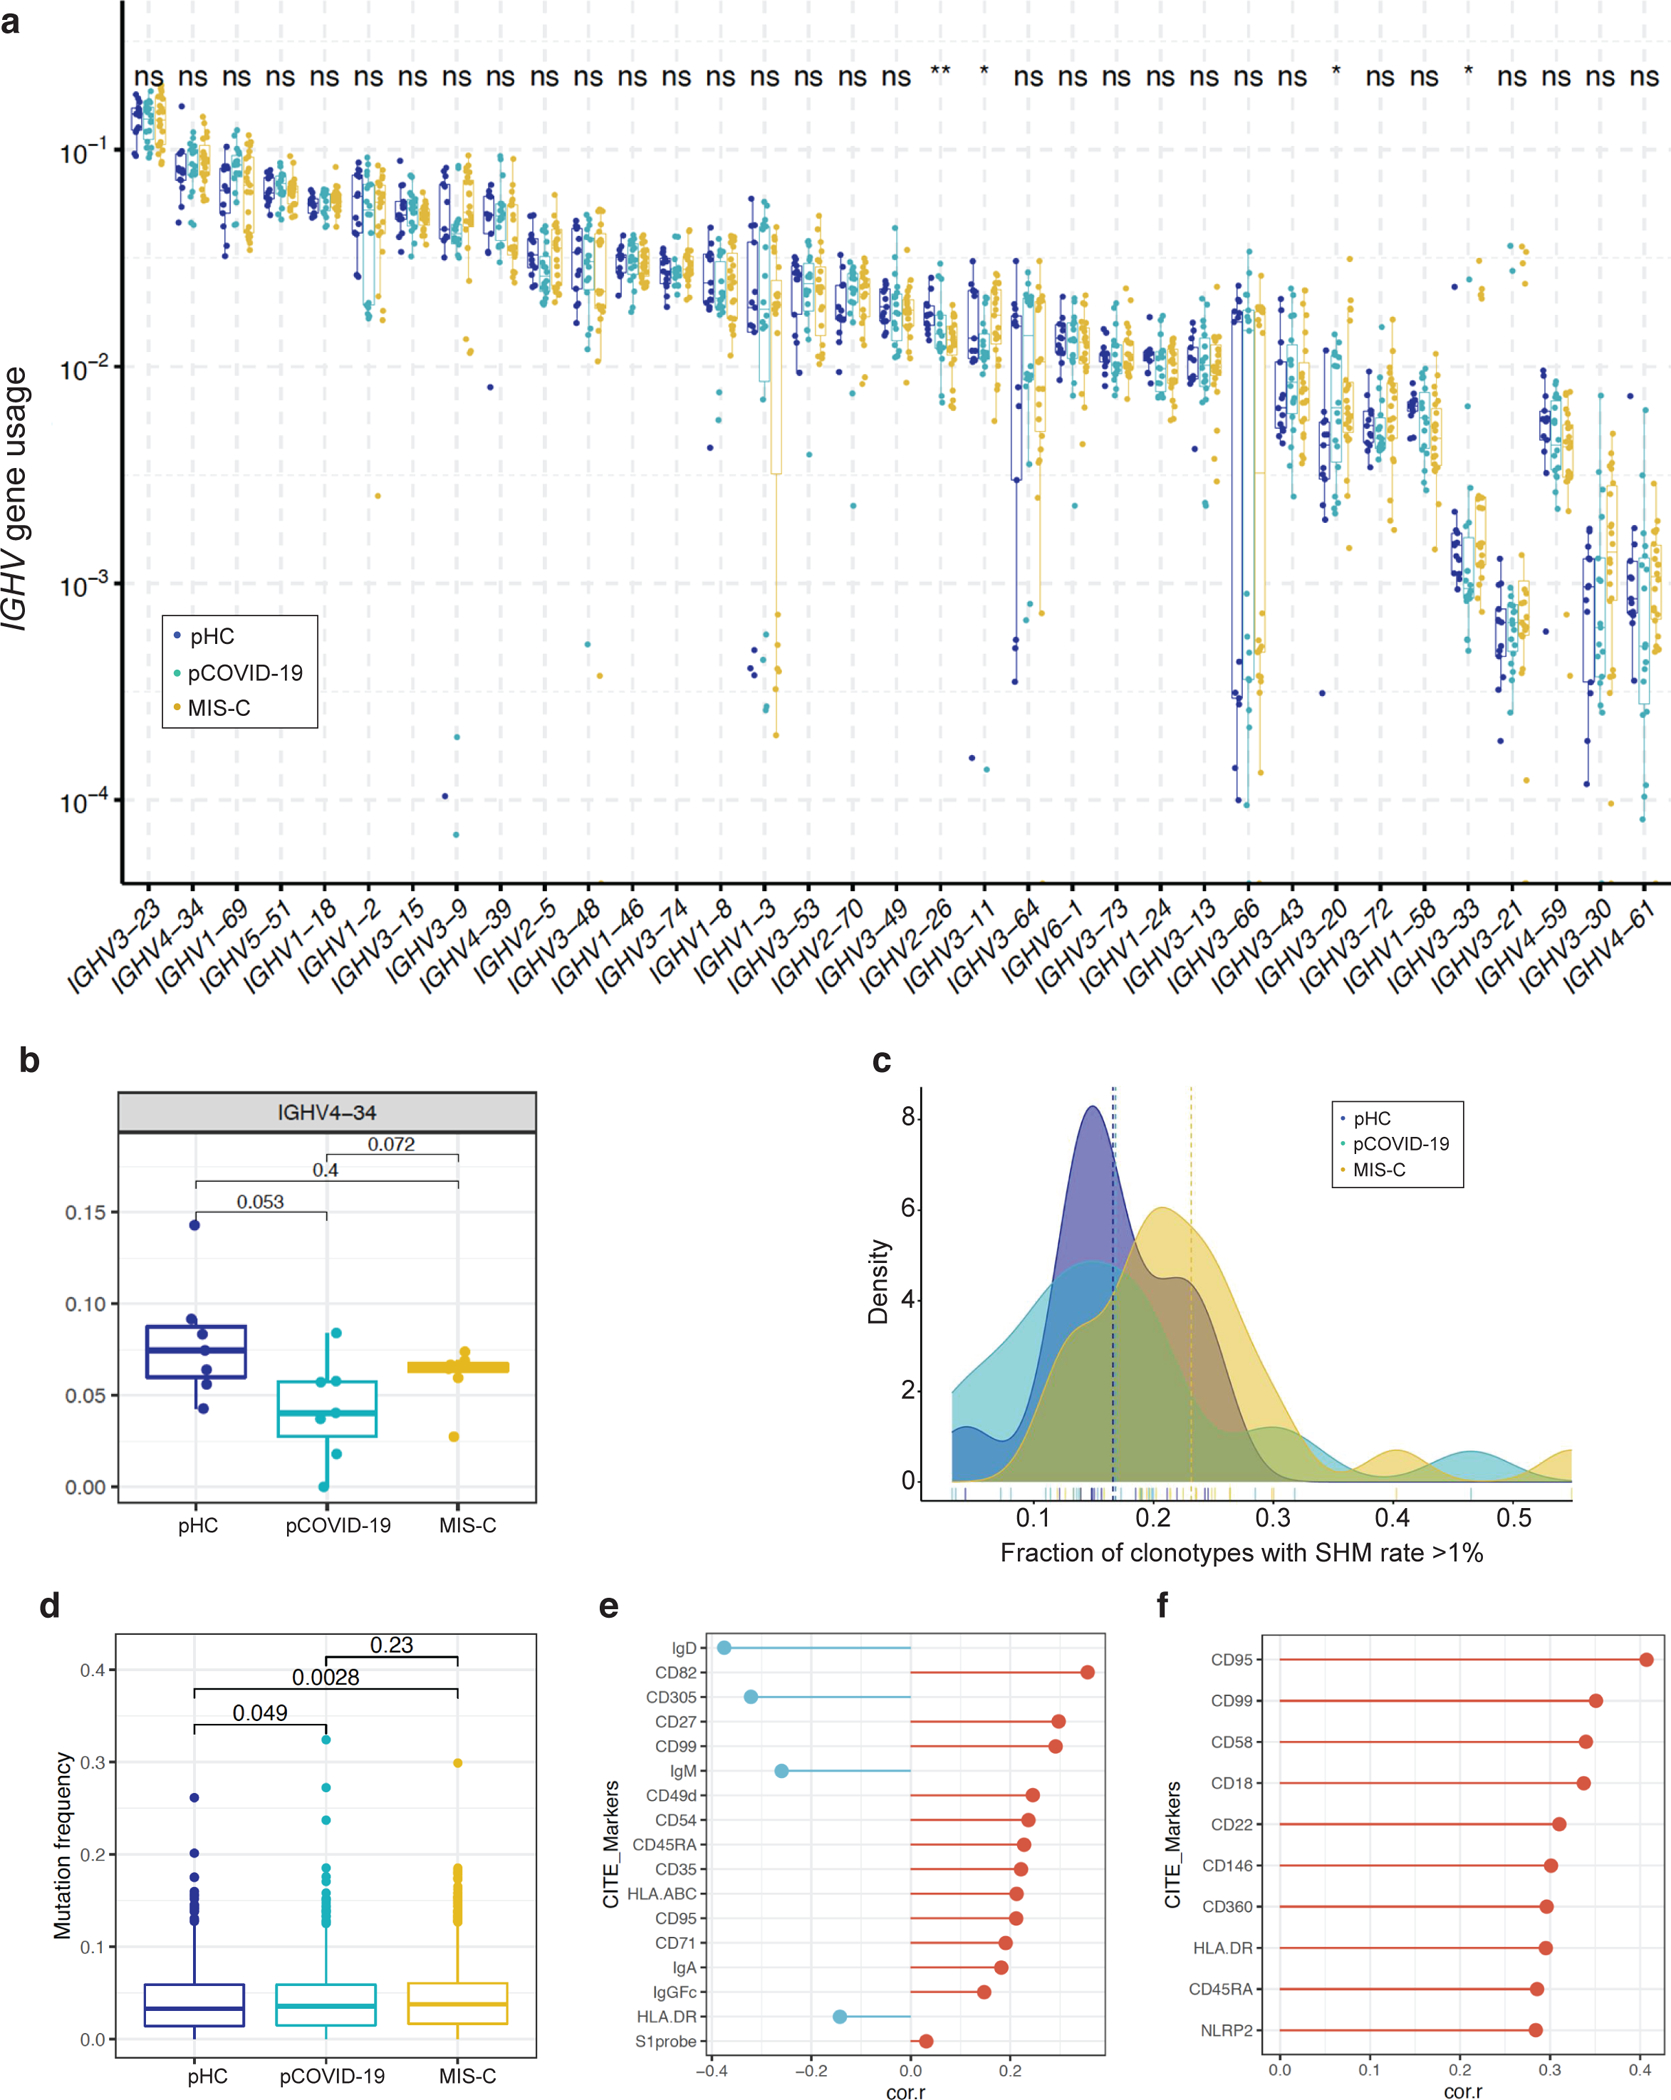
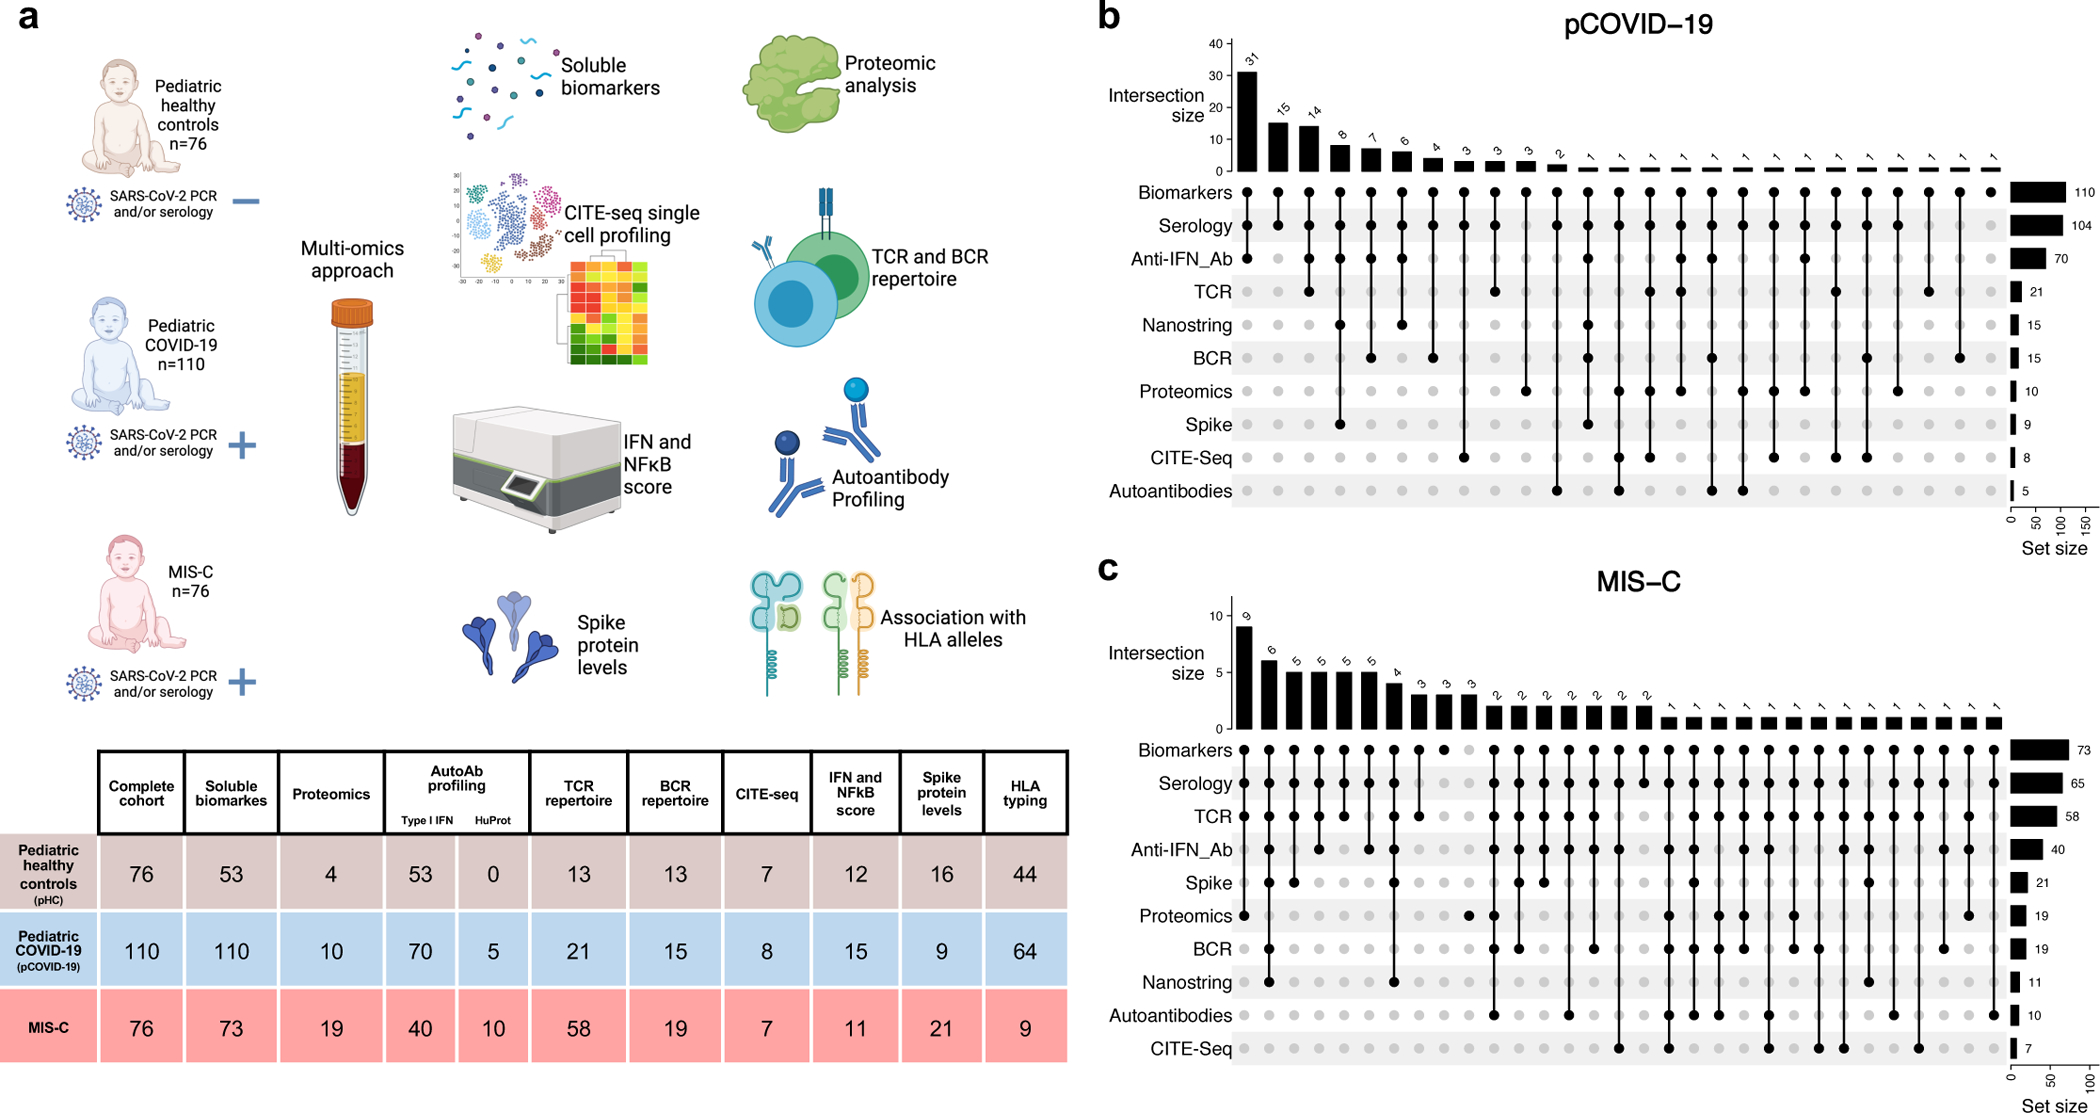
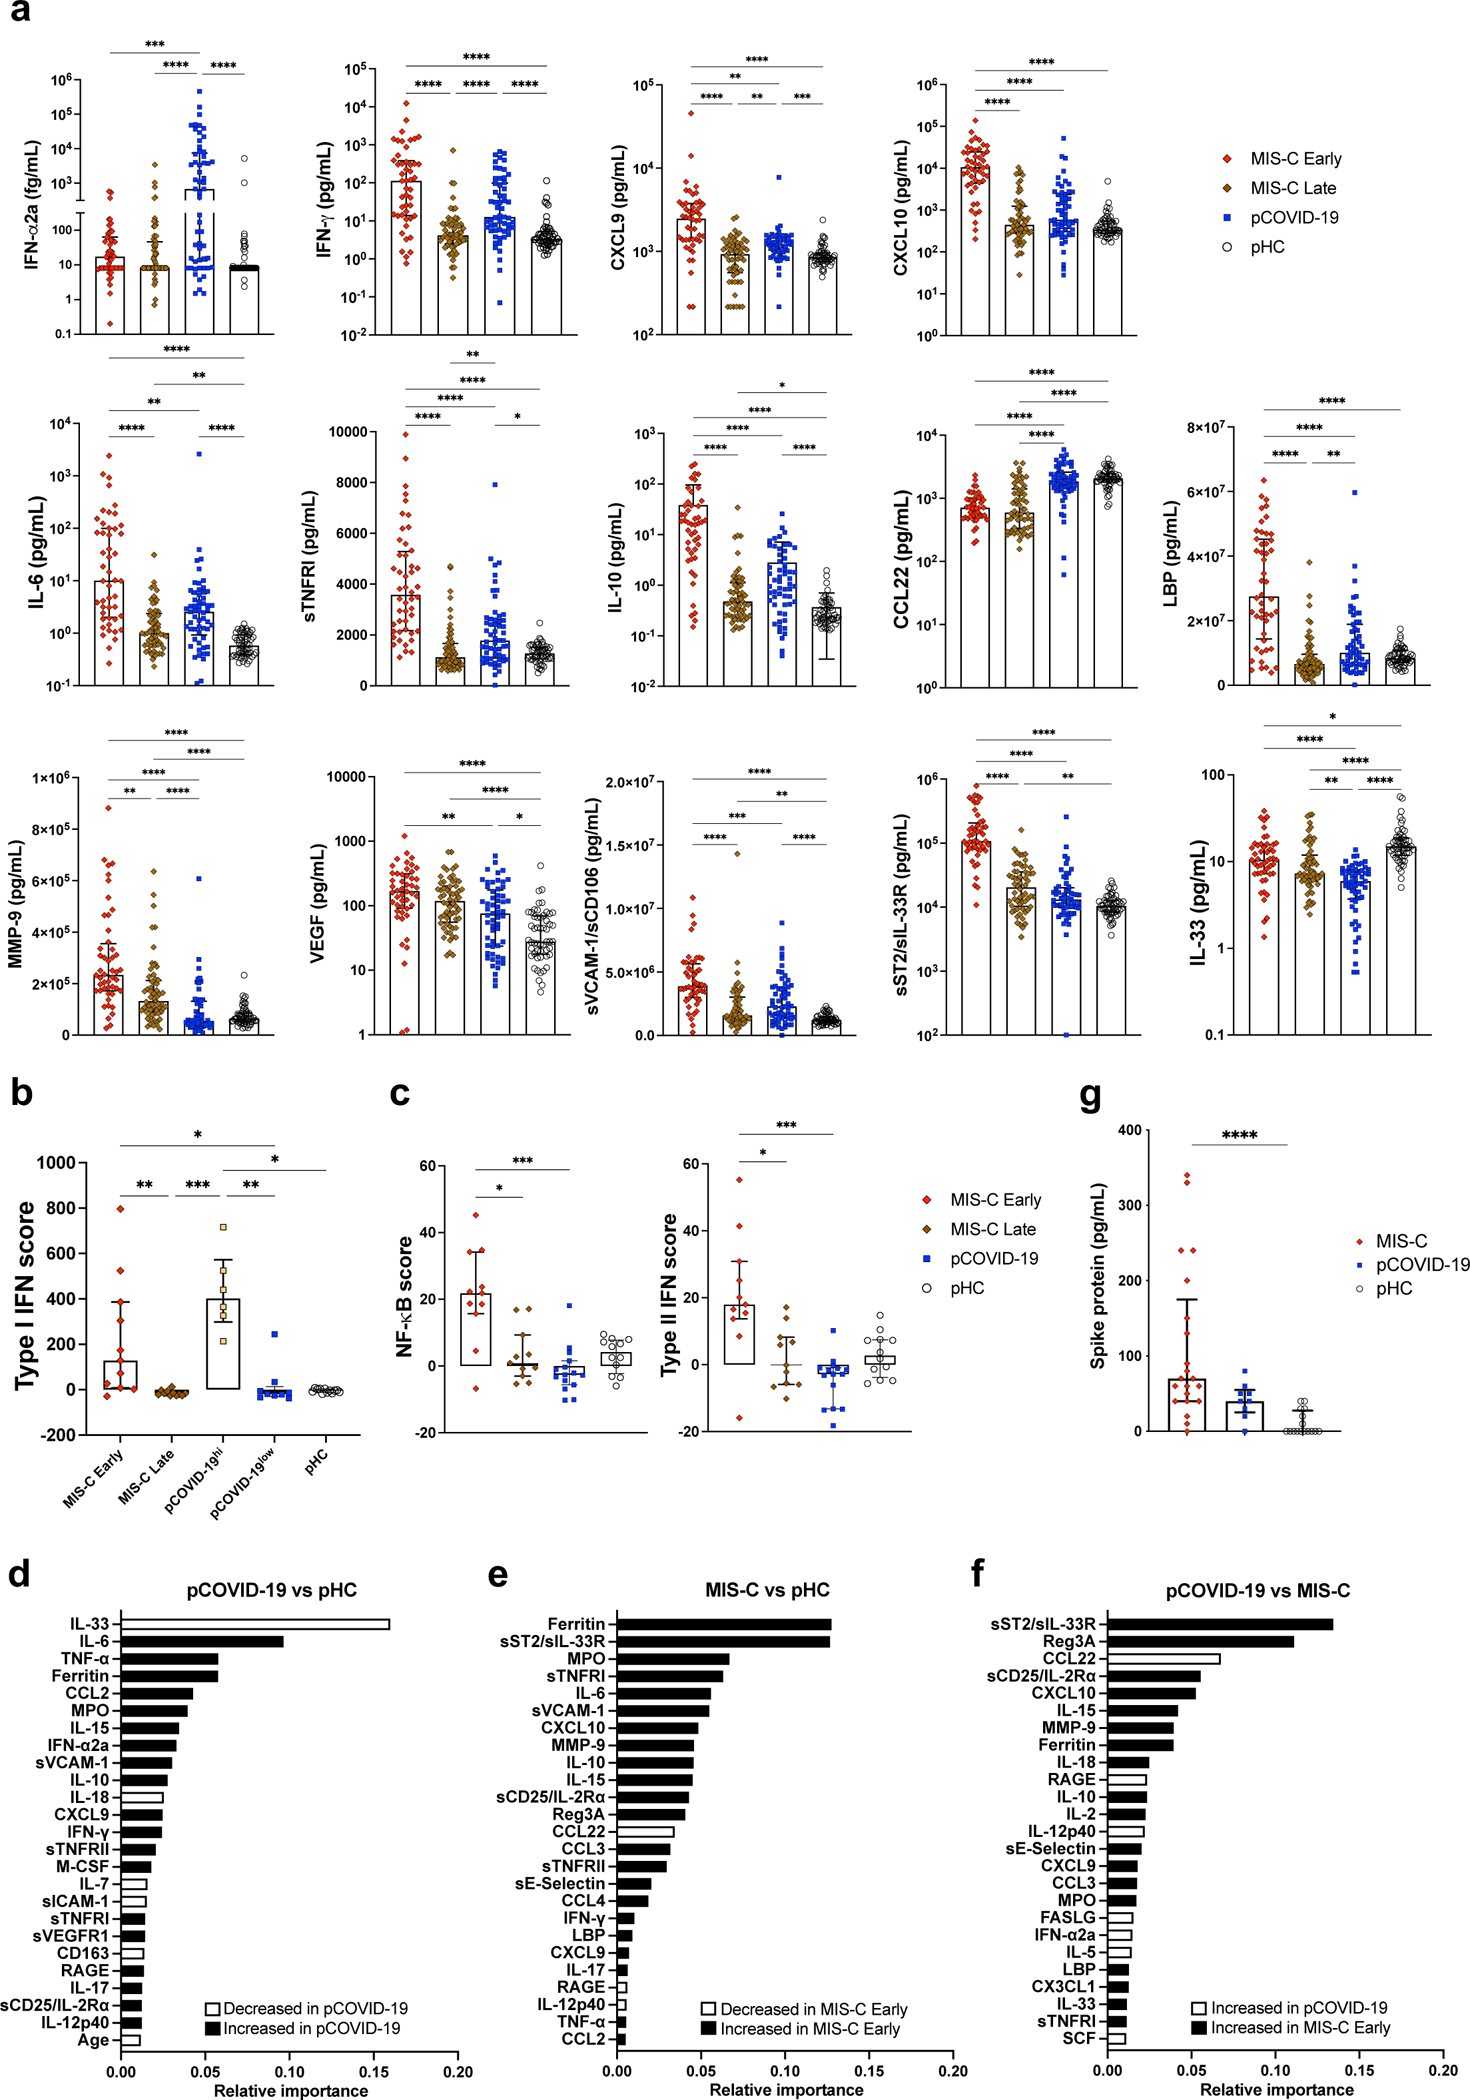
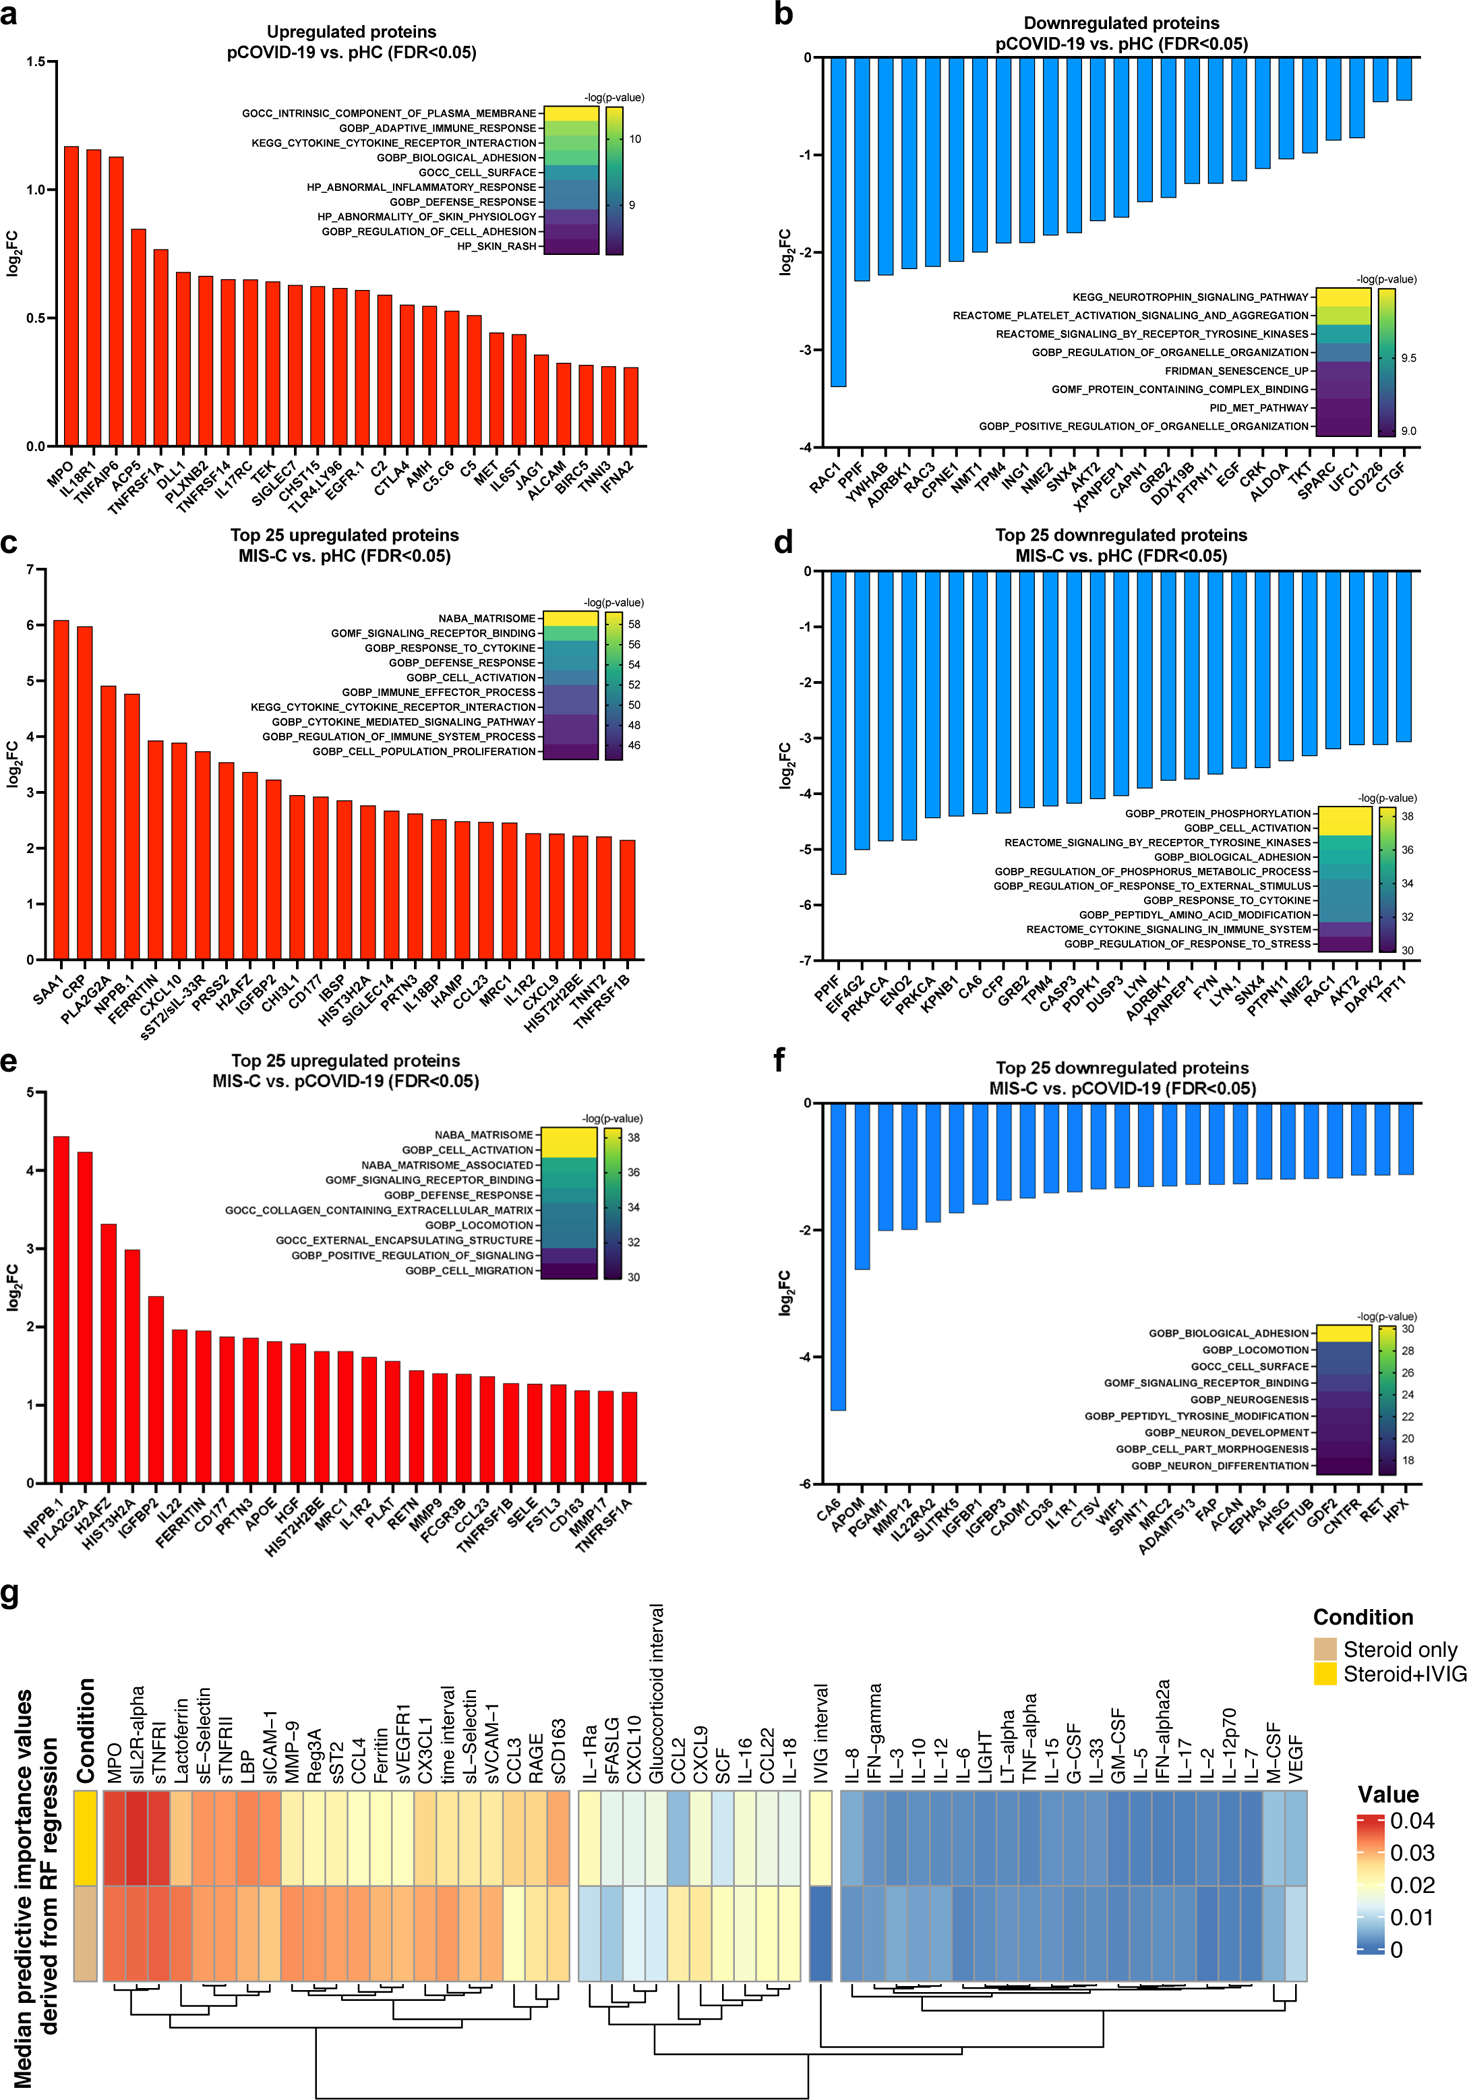
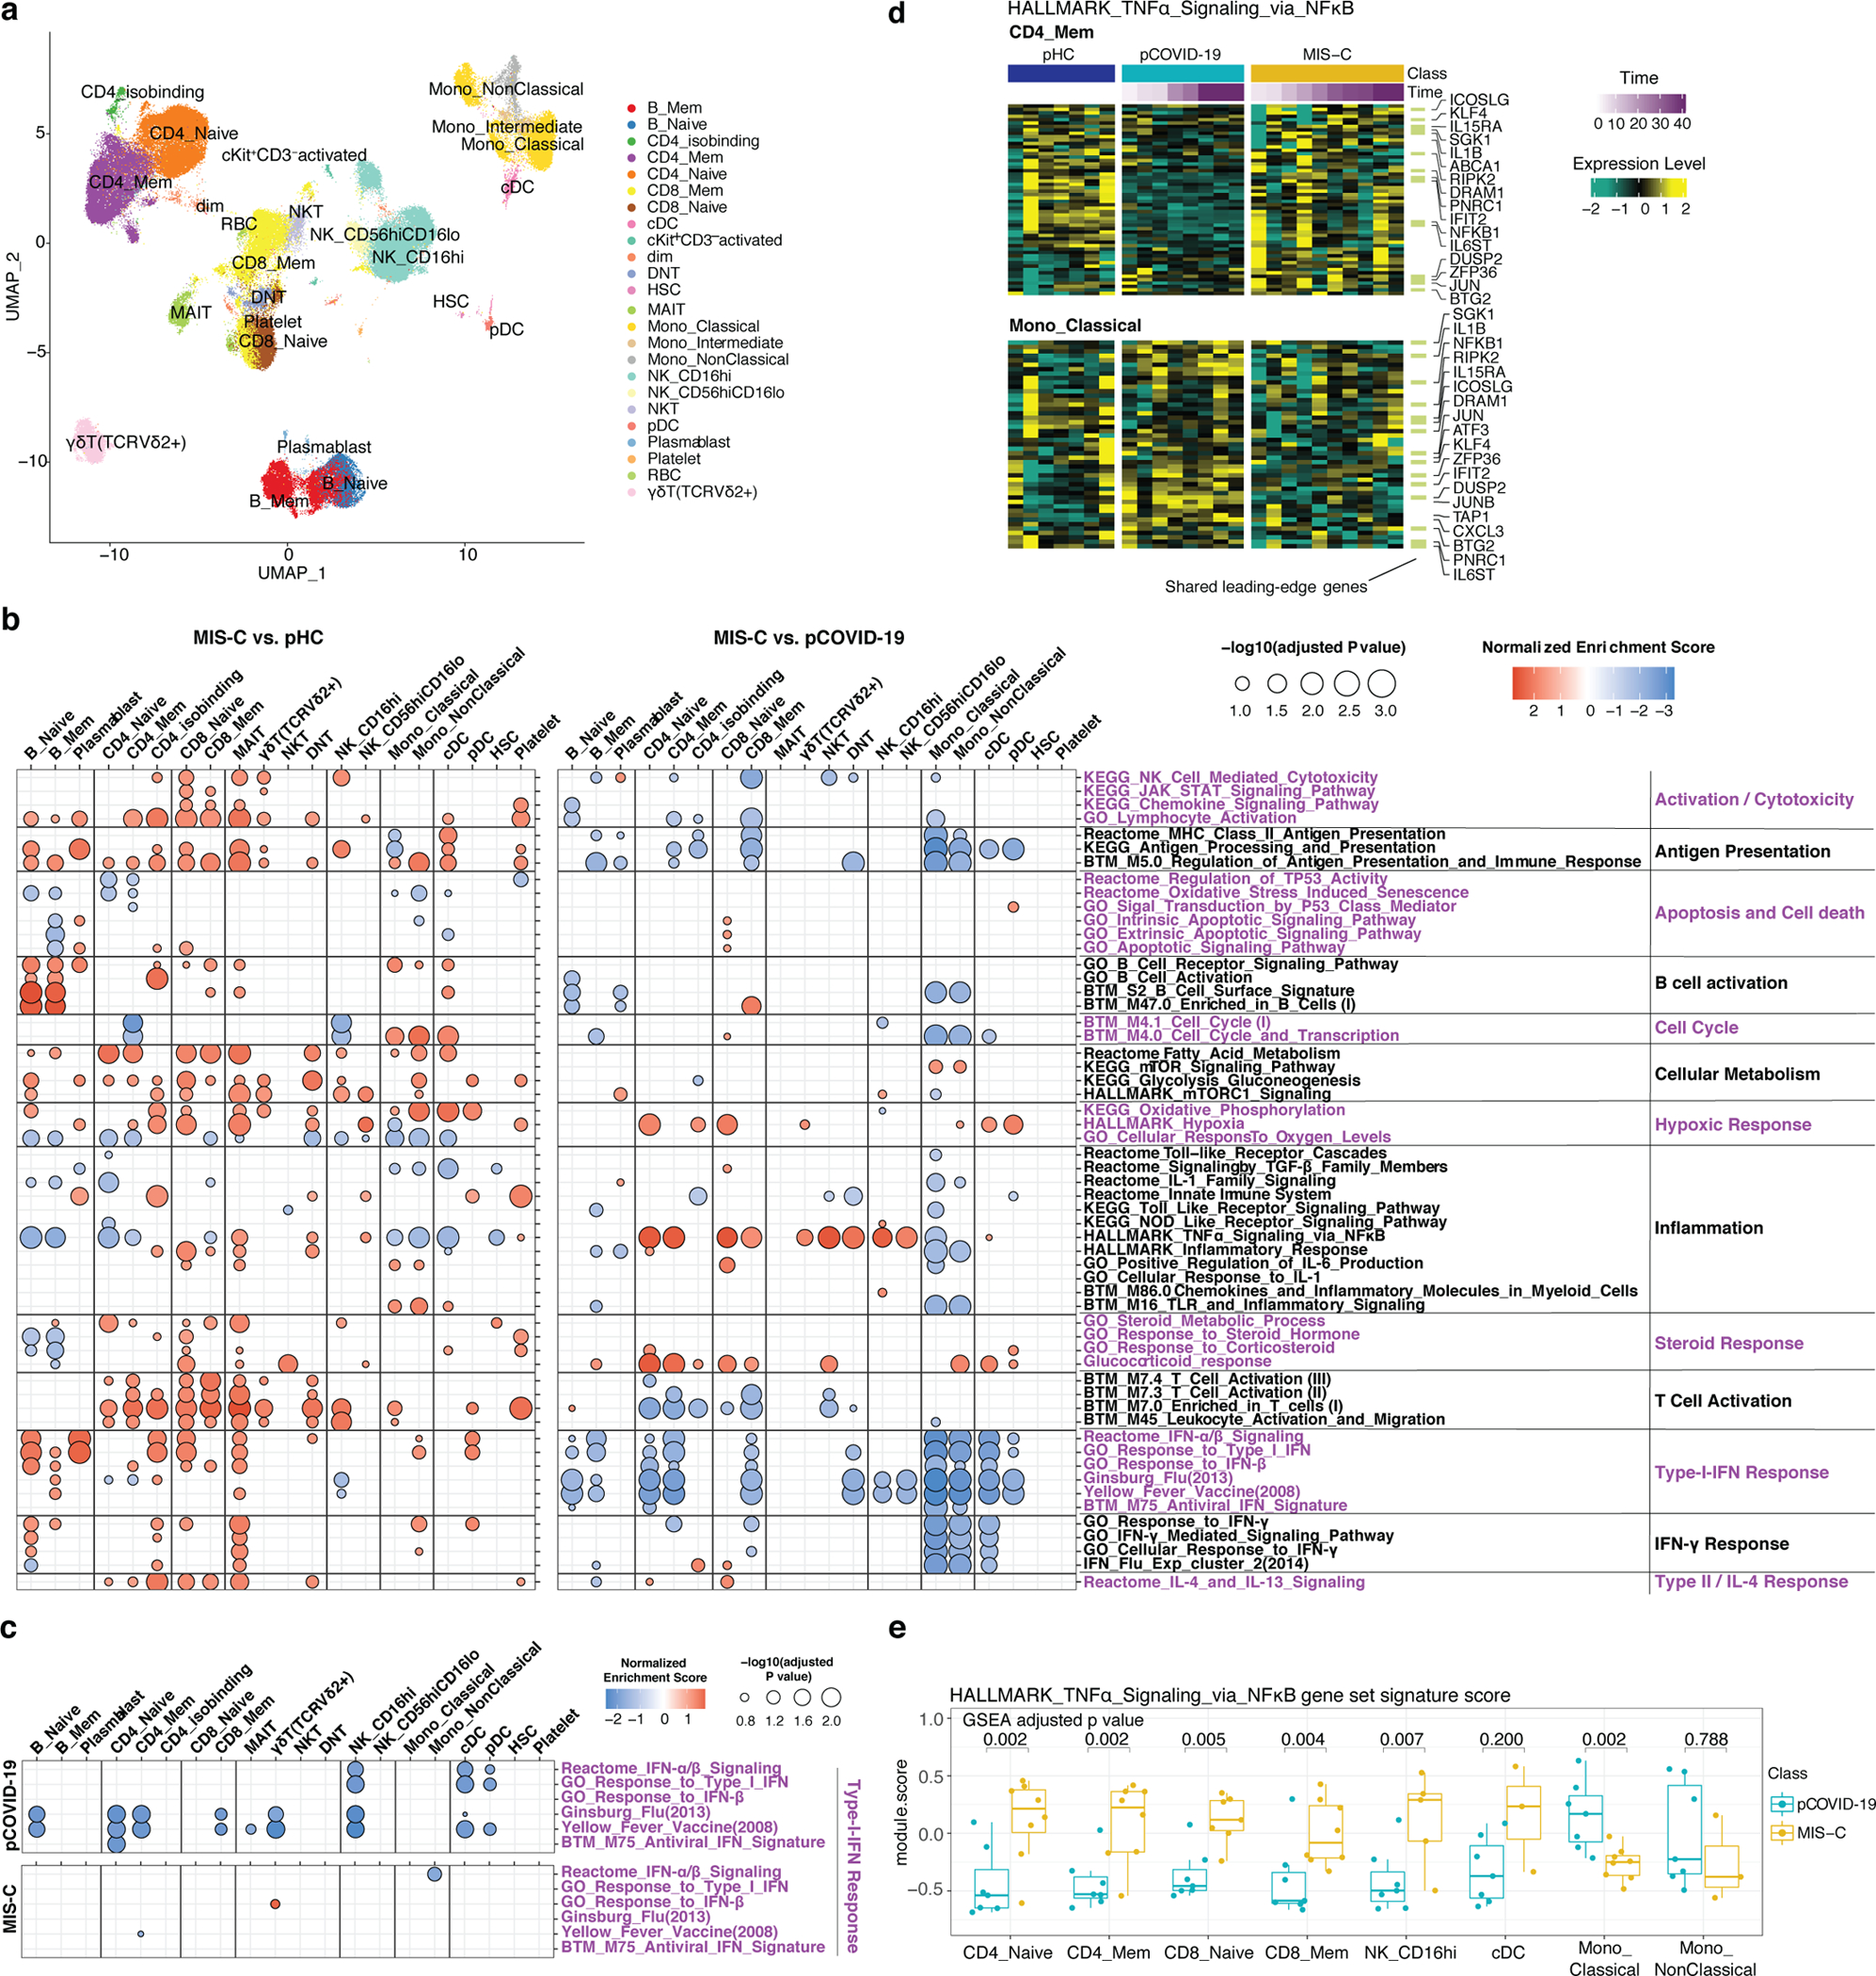
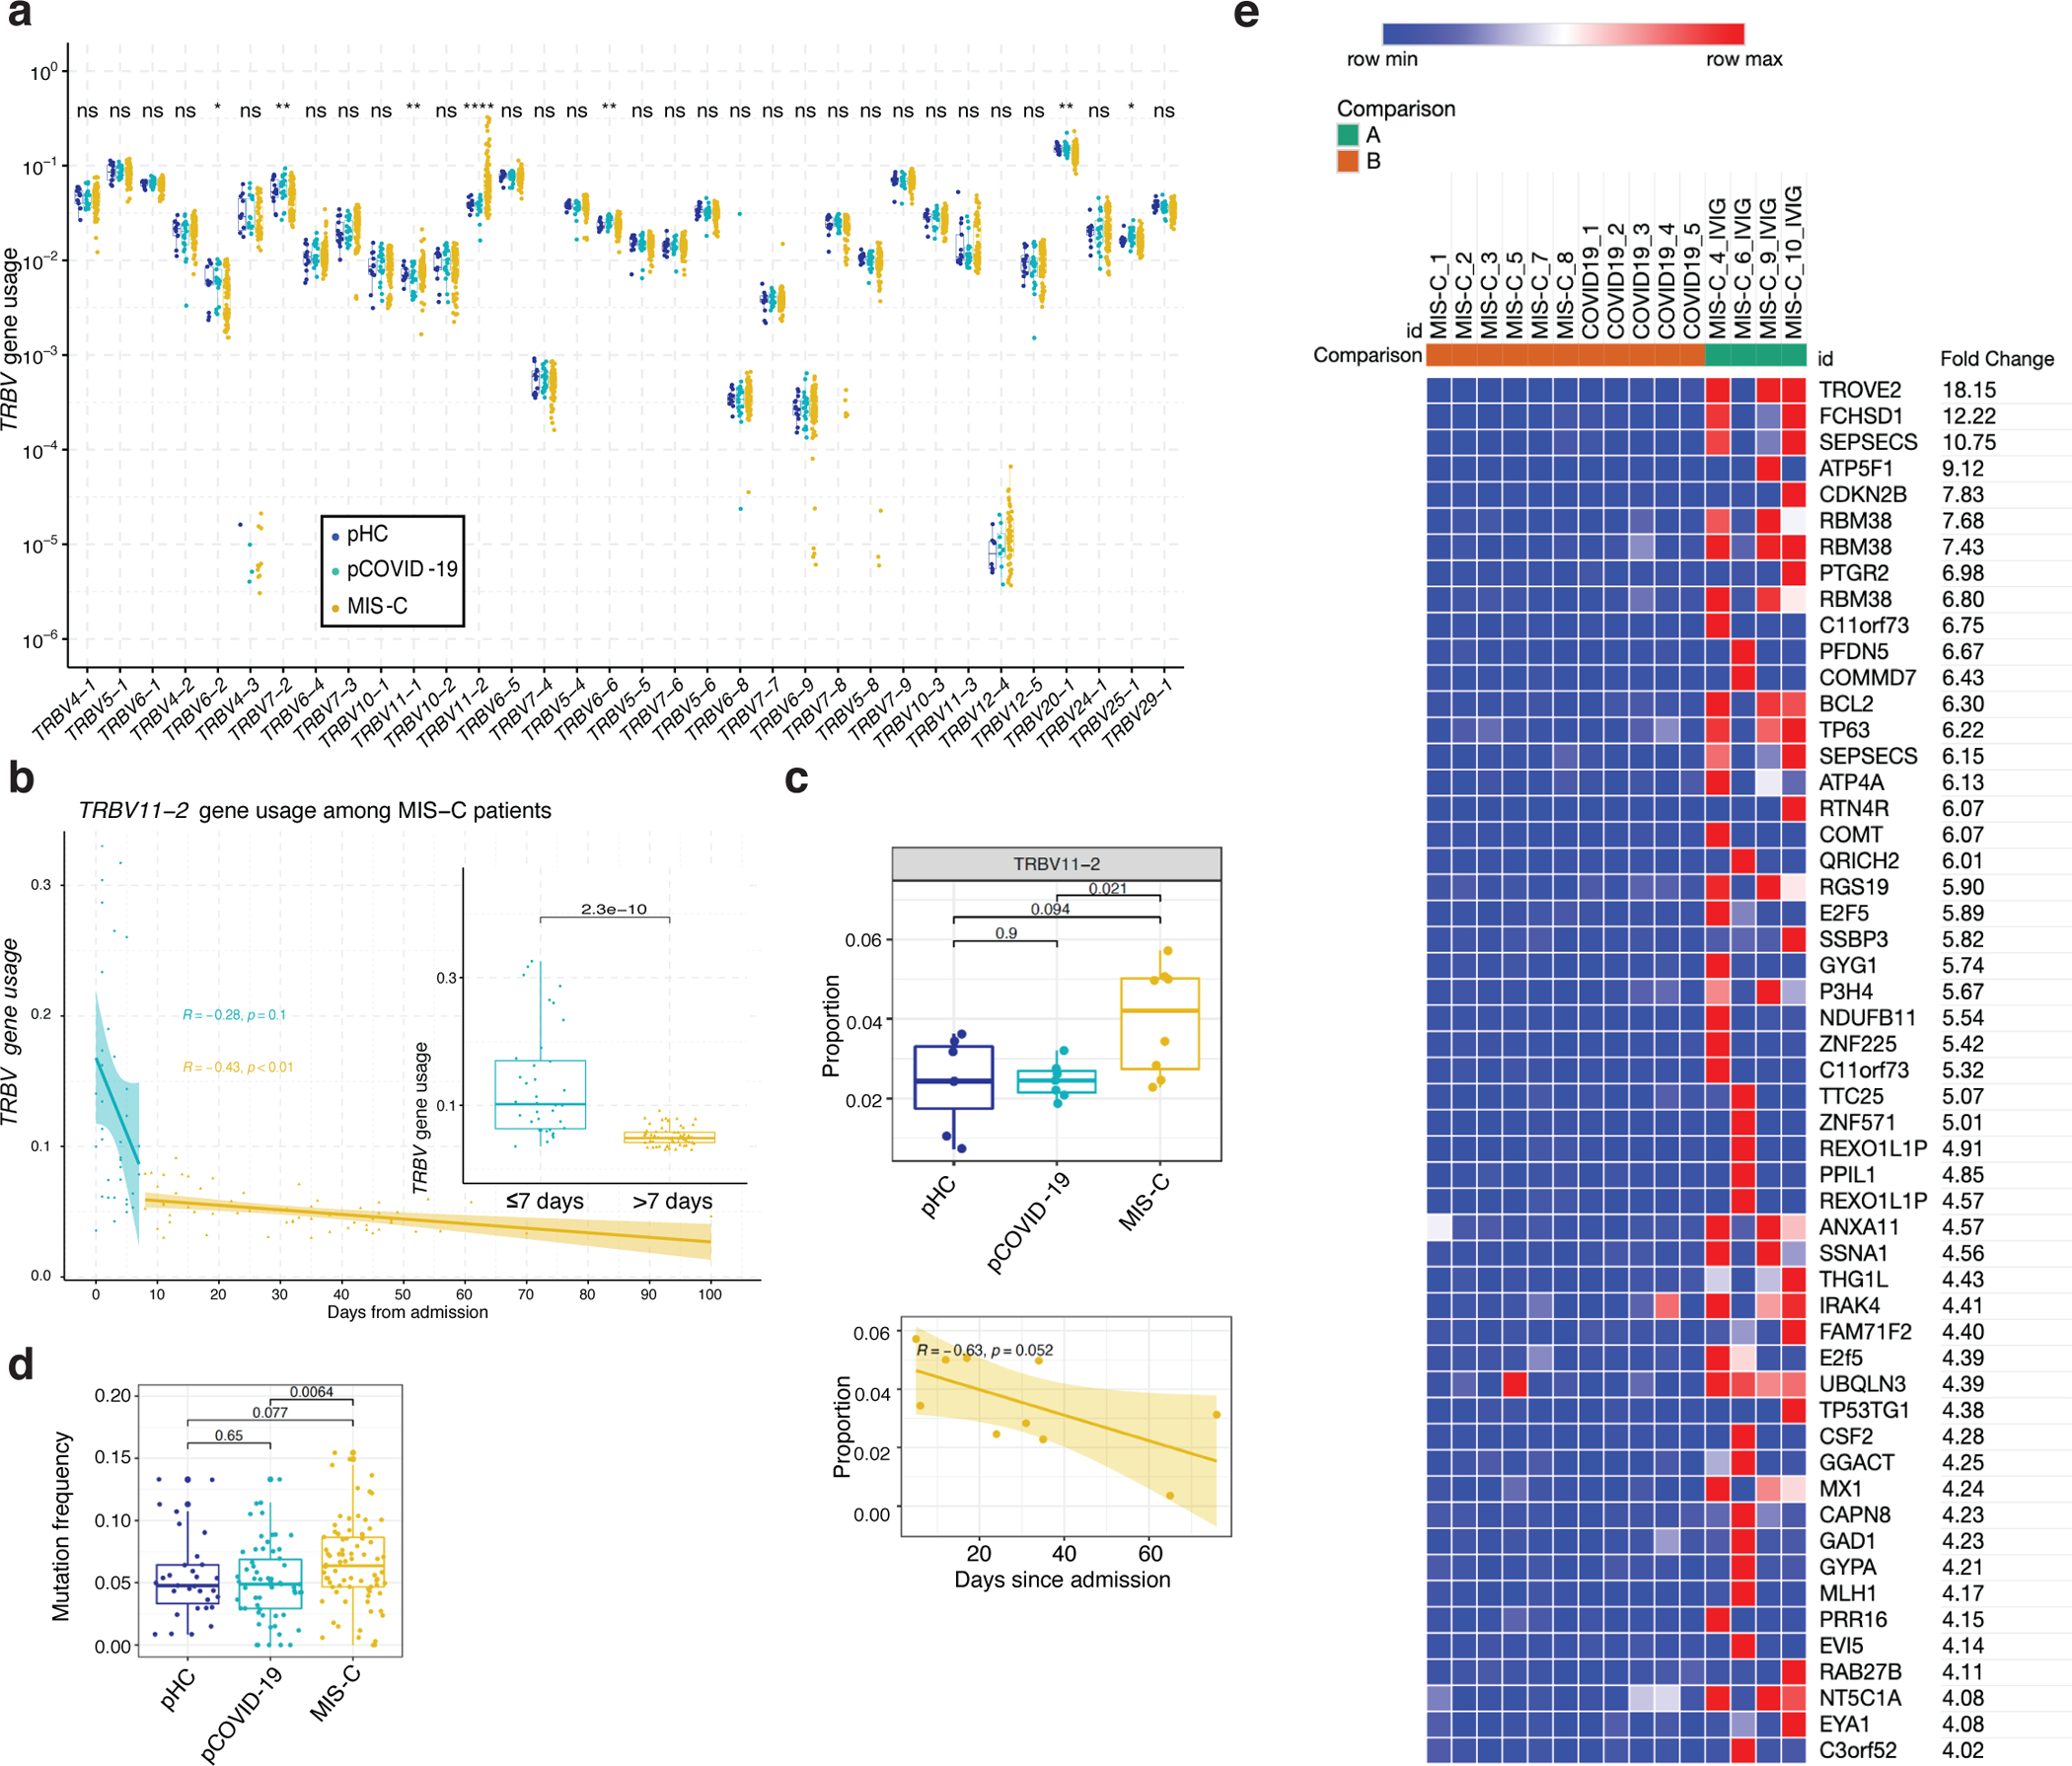
Pediatric Coronavirus Disease 2019 (pCOVID-19) is rarely severe; however, a minority of children infected with severe acute respiratory syndrome coronavirus 2 (SARS-CoV-2) might develop multisystem inflammatory syndrome in children (MIS-C), with substantial morbidity. In this longitudinal multi-institutional study, we applied multi-omics (analysis of soluble biomarkers, proteomics, single-cell gene expression and immune repertoire analysis) to profile children with COVID-19 (n = 110) and MIS-C (n = 76), along with pediatric healthy controls (pHCs; n = 76). pCOVID-19 was characterized by robust type I interferon (IFN) responses, whereas prominent type II IFN-dependent and NF-κB-dependent signatures, matrisome activation and increased levels of circulating spike protein were detected in MIS-C, with no correlation with SARS-CoV-2 PCR status around the time of admission. Transient expansion of TRBV11-2 T cell clonotypes in MIS-C was associated with signatures of inflammation and T cell activation. The association of MIS-C with the combination of HLA A*02, B*35 and C*04 alleles suggests genetic susceptibility. MIS-C B cells showed higher mutation load than pCOVID-19 and pHC. These results identify distinct immunopathological signatures in pCOVID-19 and MIS-C that might help better define the pathophysiology of these disorders and guide therapy.


Conflict of interest statement

Competing Interests Statement

TH and SH are employees and shareholders of CDI Laboratories. MA is a consultant for CDI Laboratories and the owner of Biomedical Hosting, LLC. TMS and IMK declare employment and equity ownership with Adaptive Biotechnologies. BAS is a former SomaLogic, Inc. (Boulder, CO, USA) employee and a company shareholder. The remaining authors declare no competing interests.

Figures

Extended Data Fig. 1:
Extended Data Fig. 1:. Differences in soluble biomarker levels among pediatric (pCOVID-19), adult COVID-19 (aCOVID-19), and pediatric and adult healthy controls (pHC, aHC).
a, Children with mild pCOVID-19 (n=39) in the first 7 days since symptom onset have significantly higher IFN-⍺2a levels compared to healthy pediatric controls [pHC] (n=16), healthy adult controls [aHC] (n=40), children with MIS-C (both in the first 7 days since hospitalization: MIS-C Early, n=36) and later in the course of the disease (MIS-C Late, n=32)), and adults with moderate acute COVID-19 (aCOVID-19, n=26). Maxima of box plots represent median values, and bars represent interquartile range. Statistical analysis was performed with Kruskal-Wallis test with adjustment for multiple comparisons. b-d, Comparison of soluble biomarkers measured within 7 days of symptom onset in children (n=9) and within 7 days of admission in adults (n=26) with moderate acute COVID-19, as well as pHC (n=53) and aHC (n=45), both unadjusted (left graphs, Kruskal-Wallis test) and adjusted for the baseline differences in healthy subjects of the same age group (right graphs, two-tailed Mann-Whitney test). Bars represent median values and interquartile range. b, Biomarkers whose serum levels were significantly different in pHC and aHC, but not in diseased subjects, indicating that the difference of unadjusted blood levels observed between pCOVID-19 and aCOVID-19 is probably driven by age, rather than COVID-19 itself. c, Biomarkers that differed significantly in pCOVID-19 vs. aCOVID-19, but not between pHC and aHC, suggesting that the nature and severity of inflammatory responses induced by SARS-CoV-2 infection differentially affects patients of different age. d, Biomarkers for which both age and SARS-CoV-2 infection independently contributed to differences in levels in children and adults. In all panels, significance is indicated as follows: *, P<0.05; **, P<0.01; ***, P<0.001; ****, P<0.0001.
Extended Data Fig. 2:
Extended Data Fig. 2:. Profile of soluble biomarkers and results of COVID-19 serology in pediatric COVID-19 (pCOVID-19), children with MIS-C and pediatric healthy controls (pHC).
a, Analysis of IFN-⍺2a, IFN-γ, IL-10, CXCL10, CCL2 and ferritin levels over time in 110 pCOVID-19 patients, for 34 of which more than one sample was obtained during hospitalization. The X-axis shows time from onset of symptoms or (for asymptomatic children) positive PCR. b, Comparison of serum biomarker levels in children with early (n=48, within 7 days since admission) and late (n=60, >7days) MIS-C, pCOVID-19 within 7 days from symptom onset (n=57) and pHC (n=53). Median values with IQR are shown. Univariate analysis by Kruskal-Wallis test with adjustment for multiple comparisons. P values are marked as follows: * <0.05, ** <0.01, *** <0.001, **** <0.0001. c, Levels of anti-Spike (anti-S) and anti-Nucleocapsid (anti-N) antibodies in MIS-C (n=68) and pCOVID-19 (n=104) patients and in pHC (n=53). Blood samples were obtained at a median of 4 days after hospitalization (IQR, 1.75–13 days) for MIS-C patients, and at a median of 3 days (IQR, 1–14 days) after onset of symptoms or positive PCR for pCOVID-19 patients. Values are expressed in Light Units. Positive values are shown above the grey areas. Positivity cut-off values are 45,000 for anti-S, and 125,000 for anti-N antibodies, respectively. Statistical analysis was done with Mann-Whitney test with two-tailed P values. ***, P<0.001; ****, P<0.0001.
Extended Data Fig. 3:
Extended Data Fig. 3:. Schematic diagram of timing of blood sample collection and administration of therapeutic modalities compared to day of admission (day 0) in MIS-C patients.
Red circles identify first blood samples collected prior to administration of glucocorticoids, IVIG or biologics. For PIMS-006, PIMS-016, PIMS-023, PIMS-032, PIMS-036, PIMS-055, TO-006, TO-034, NAP013, the first blood sample was obtained the same day (and immediately prior to) therapeutic interventions with glucocorticoids, IVIG and/or biologics were started. *Levels of soluble biomarkers were not measured in the first blood samples obtained from NAP012 and TO-053.
Extended Data Fig. 4:
Extended Data Fig. 4:. Effect of treatment on levels of soluble biomarkers in MIS-C.
a, Biomarker changes following systemic glucocorticoids in 12 MIS-C patients. Samples were drawn at a median of 0 days (IQR −1 to 0) prior to (left) and 5 days (IQR 4 to 7.5) after (right) treatment with glucocorticoids and IVIG (black lines) or glucocorticoids alone (red lines). Two patients (indicated by blue circles and lines) had received IVIG prior to blood sampling. Wilcoxon matched-pairs signed rank test with two-tailed P value was used for comparisons. *p<0.05, **p<0.01, ***p<0.001. b, Comparison of soluble biomarker levels in MIS-C Early children (within 7 days since admission) who had not (untreated, n=12) and in those who had (treated, n=36) received glucocorticoids and/or IVIG prior to blood sampling. Results are compared to levels in MIS-C Late (>7 days since admission) patients (n=60) and pediatric healthy controls (pHC, n=53). Maxima of box plots represent median values, and bars represent interquartile range. Statistical analysis was performed by Kruskal-Wallis test with adjustment for multiple comparisons. P values are marked as follows: * <0.05, ** <0.01, *** <0.001, **** <0.0001. c, Random forest classification comparing MIS-C Early (n=46) to pHC (n=52), with treatment prior to blood sampling included among the variables. The sample cohort is the same as in Figure 2e.
Extended Data Fig. 5:
Extended Data Fig. 5:. Immune cell atlas and cell-type specific gene expression profile of MIS-C and pediatric COVID-19 (pCOVID-19).
a, CITE-seq label transfer from previous adult COVID-19 experiments. Heatmap shows the overlap percentage of predicted markers from label transfer (x-axis) and annotated cell populations in this pediatric dataset (y-axis). b, Frequencies of immune cell clusters for non-classical monocytes, plasmacytoid dendritic cells (pDC) and CD8 memory T cells in adult healthy controls (aHC, n=13), adult patients with less severe (disease severity matrix low, DSM_low, n=13) COVID-19, adult patients with more severe (DSM_high, n=13) COVID-19, pediatric HC (pHC, n=7), pediatric COVID-19 (pCOVID-19,n=8) and MIS-C patients (n=7). P values shown were obtained using two-sided Wilcoxon test between indicated two groups. Adult COVID-19 data are from Liu et al, 2021 (ref.25). To avoid potential batch effects of independently annotated adult and pediatric populations, cell frequencies of pediatric dataset shown were obtained by label transfer from adult data (See Methods and panel a). Each dot indicates a subject. Only the first timepoint from each subject is shown. Box plot elements are the same as in Figure 4e. c, Enrichment Analysis of pCOVID-19 (n=7) vs. pHC (n=7) at timepoints within 40 days of admission. Selected gene sets are grouped into functional/pathway categories. Dot color denotes normalized gene set enrichment score and size indicates –log10(adjusted p value). P values were adjusted using the Benjamini-Hochberg method. d, From left to right: UMAP of monocyte RNA expression clusters, surface CD163 expression (FDR adjusted p value comparing surface CD163 expression of MIS-C monocytes vs. pHC and pCOVID-19 monocytes is shown) and expression of S100A family inflammatory genes which are differentially expressed in monocytes of MIS-C versus pHC. Cells from all time points are shown (pHC, n=7; pCOVID-19, n=8; MIS-C, n=10, with two timepoints included for 3 MIS-C patients).
Extended Data Fig. 6:
Extended Data Fig. 6:. SARS-CoV-2 specific clonotypes, characteristics of TRBV11–2+ clonotypes, and correlation with soluble biomarkers.
a, Breadth of SARS-CoV-2 specific TRB clonotypes in pHC, pCOVID-19 and MIS-C patients. b, Ratio of SARS-CoV-2 specific CDR3 clonotypes among unique TRBV11–2-positive versus TRBV11–2-negative clonotypes in pHC, pCOVID-19 and MIS-C. c, Simple linear regression analysis, correlating frequency of TRBV11–2 clonotypes and soluble biomarker levels. R squared goodness of fit and p values are shown. d, Gene expression of TRBV11–2 positive (TRBV11–2pos) compared to TRBV11–2 negative (TRBV11–2neg) CD4+ T cells within MIS-C samples (n=10, 3/7 patients with 2 time points). Differentially expressed genes with adjusted p value < 0.2 are marked with an asterisk (*). Scaled average gene expression level of TRBV11–2neg and TRBV11–2pos CD4+ T cells is shown in all 3 groups (pHC, pCOVID-19, and MIS-C). e, Heatmap showing the marker genes of TRBV11–2pos MIS-C CD4+ T cells compared to TRBV11–2neg CD4+ T cells. f, Gene set pathway enrichment analysis (GSEA) of apoptosis signature in TRBV11–2pos CD4+ T cells from MIS-C patients (n=7, 3/7 patients with 2 time points). Dot color denotes normalized gene set enrichment score and size indicates –log10(adjusted p value). P values were from GSEA test of the whole gene sets (see: Methods) and adjusted using the Benjamini-Hochberg method. g, Pearson correlation coefficient values between indicated variables. The top 50th percentile predictors of TRBV11–2 gene usage are shown. Analysis conducted on 92 samples collected at various timepoints after hospitalization from 56 MIS-C patients who received glucocorticoids. Time interval and glucocorticoid interval are defined as days since admission and since initiation of systemic glucocorticoids, respectively. h, Pairwise interaction strengths derived from random forest regression analysis. Columns identify predictors, and rows correspond to targets. Input data are the same as in panel f. In panels a and b, values are for 21 samples from 21 pCOVID-19, 96 samples from 58 MIS-C, and 13 samples from 13 pHC subjects. Box plots show the median, first and third quantiles (lower and upper hinges) and smallest (lower hinge - 1.5*interquartile range) and largest values (upper hinge + 1.5* interquartile range) (lower and upper whiskers). Statistical analysis was done with two-tailed Wilcoxon test. In panels d and e, average log fold change (logFC) threshold 0.2 and p value 0.2 were used for marker gene cutoff, and P values were calculated using the Wilcoxon Rank Sum test and adjusted using FDR method.
Extended Data Fig. 7:
Extended Data Fig. 7:. IGHV gene usage, mutation frequency and surface markers associated with mutation frequency.
a, Usage of IGHV genes in pediatric healthy controls (pHC, n=13 samples from 13 subjects), children with acute COVID-19 (pCOVID-19, n=18 samples from 15 patients) and MIS-C (n=23 samples from 19 patients). ns, not significant; *,p≤0.05; **p≤0.01; ***, p≤0.001; ****, p≤0.0001. Statistical analysis was done with Kruskal-Wallis test with unadjusted P values, with box plot showing the median, first and third quantiles (lower and upper hinges) and smallest (lower hinge - 1.5*interquartile range) and largest values (upper hinge + 1.5* interquartile range) (lower and upper whiskers). b, Frequency of IGHV4–34 B cell clonotypes in pHC (n=7), pCOVID-19 (n=8) and MIS-C (n=8, 2 of which with 2 timepoints) within 40 days of admission. P values shown were obtained using two-sided Wilcoxon test between indicated two groups. Each dot indicates a sample. Box plot elements are the same as Figure 4e. c, Fraction of IGHV clonotypes with a somatic hypermutation (SHM) rate >1% among unique clonotypes identified by high-throughput sequencing. Unadjusted P values (Wilcoxon rank sum test) were as follows: pHC versus pCOVID-19, P=0.514; pHC versus MIS-C, P=0.028; pCOVID-19 versus MIS-C, P=0.016. d, Quantification of somatic hypermutation in memory B cells from pHC (n=7), pCOVID-19 (n=8) and MIS-C (n=7, 3 of which with 2 timepoints) patients. P values shown were obtained by applying two-sided Wilcoxon test between indicated two groups. Each dot indicates a cell. Box plot elements are the same as Figure 4e. e, B cell surface markers correlating with mutation frequency in memory B cells from MIS-C patients. Pearson correlation values are shown (x-axis). Top 10 and a few selected significant markers are shown. S1 probe: SARS-CoV-2 spike protein probe. f, Plasmablast cell surface markers correlating with mutation frequency from MIS-C patients. Pearson correlation values are shown (x-axis). Top 10 significant markers are shown.
Figure 1 -
Figure 1 -. Study cohort and outline of the multi-omics approach.
a, Schematic representation of subject cohorts and workflow, with the number of subjects included in each analysis shown in the table. Figure created with BioRender.com. b-c, The number of patients with pCOVID-19 (panel b) and MIS-C (panel c) analyzed by various combination of assays is shown by vertical bars on the top of the diagrams. The total number of patients analyzed with each assay is indicated by horizontal bars on the right of each panel.
Figure 2 -
Figure 2 -. Blood biomarkers analysis in pCOVID-19 and MIS-C.
a, Comparison of serum biomarker levels in children with multi-system inflammatory syndrome in children (MIS-C Early, n=48) (within 7 days since admission) and MIS-C Late (>7days, n=60), pediatric COVID-19 (pCOVID-19, n=57) within 7 days from symptom onset, and pediatric healthy controls (pHC, n=53). b, Comparison of type I interferon (IFN) score in paired MIS-C Early and MIS-C Late (n=11), pHC (n=12), pCOVID-19 (n=15) with elevated (pCOVID-19hi, n=6) and lower (pCOVID-19low, n=9) IFN-α2a levels. c, Comparison of NF-κB score and type II IFN score in paired MIS-C Early and MIS-C Late (n=11), pCOVID-19 (n=15), and pHC (n=12). d, Random forest classification comparing pCOVID-19 within 7 days from symptom onset (n=57) to pHC (n=53). e, Random forest classification comparing MIS-C Early (n=48) to pHC (n=53). f, Random forest classification comparing MIS-C Early (n=48) to pCOVID-19 within 7 days from symptom onset (n=57). g, Serum Spike protein levels in MIS-C (n=21), pCOVID-19 (n=9) and pHC (n=16). Maxima of box plots in panels a, b, c and g represent median values, and bars represent interquartile range. Statistical analysis in panels a-c and g was performed by Kruskal-Wallis test with adjustment for multiple comparisons. P values are marked as follows: * <0.05, ** <0.01, *** <0.001, and **** <0.0001.
Figure 3 -
Figure 3 -. Proteomic analysis in MIS-C compared to pCOVID-19.
a, b, Upregulated (panel a) and downregulated (panel b) plasma proteins obtained from the comparison between pCOVID-19 (n=10) and pHC (n=4). c, d, Top 25 up- and down-regulated plasma proteins obtained from the comparison between MIS-C (within the first 7 days of hospitalization, n=16) and pHC (n=4). e, f, Top 25 up- and down-regulated plasma proteins obtained from the comparison between MIS-C (within the first 7 days of hospitalization, n=16) and pCOVID-19 (n=10). g, Median predictive importance values derived from random forest regression of soluble biomarker values in a group of 101 samples obtained at various time points after hospitalization from 38 MIS-C patients who received both systemic glucocorticoids and IVIG, and in another group of 57 samples from 25 MIS-C patients who received systemic glucocorticoids only. In each random forest regression model (composed of 1000 decision trees with one model per target), predictive importance value for each predictor-target pair is computed using the algorithm described in ref.. In panels a-f, top up- and down-regulated proteins were identified by selecting all proteins with false discovery rate (FDR) <0.05 and p value <0.05 (two-tailed t-test), and then ordering them according to increased or decreased fold-changes expressed in a log2 scale. Heatmaps show the most significantly enriched pathways for the group comparison and the statistical significance is expressed as -log(p value).
Figure 4 -
Figure 4 -. Multimodal single cell profiling of MIS-C and pCOVID-19
a, UMAP visualization of single cell clusters based on protein expression profiles (see: Methods for cell type acronyms). b, Gene set enrichment analysis (GSEA) of MIS-C versus pHC (left), and MIS-C versus pCOVID-19 (right), at timepoints within 40 days of admission. Selected gene sets are grouped into functional/pathway categories. Dot color denotes normalized gene set enrichment score and size indicates –log10(adjusted p value). P values were from GSEA test of the whole gene sets (see: Methods) and adjusted using the Benjamini-Hochberg method. The sample size for each group MIS-C n=8 (2 subjects with two timepoints), pCOVID-19 n=7, pHC n=7. Further details for statistical analysis are described in the Methods. c, Gene set enrichment analysis (GSEA) result of pCOVID-19 (top) and MIS-C (bottom) based on the association with time (days since admission), only showing the type I IFN related response signatures. The sample size for each group MIS-C n=10 (3 subjects with two timepoints), pCOVID-19 n=8, pHC n=7. d, Heatmap of HALLMARK_TNFa_Signaling_via_NFkB gene set in CD4+ Memory T cells and Classical Monocytes. Heatmap showing the scaled average mRNA expression (row z-score) of leading-edge (LE) genes from the GSEA analysis of MIS-C versus pCOVID-19. Shared LE genes and selected top LE from both cell types are labeled by gene symbol. The shared LE genes are annotated on the right column. Each column represents a sample. Subjects are grouped by pHC, pCOVID-19 and MIS-C classes, and columns are ordered by days since admission; also shown are the days since admission of each sample (top of the heatmaps). e, Per-sample gene set signature scores of the HALLMARK_TNFα_Signaling_via_NFκB gene set in selected cell populations. Gene set scores were calculated using the gene set variation analysis of leading-edge genes from the MIS-C versus pCOVID-19 model (See Methods). P values shown are adjusted p values from GSEA result in (b). Box plot showing the median, first and third quantiles (lower and upper hinges) and smallest (lower hinge - 1.5*interquartile range) and largest values (upper hinge + 1.5* interquartile range) (lower and upper whiskers). Sample size was as follows: MIS-C, n=8 (2 subjects with two timepoints); pCOVID-19, n=7. See Methods for details of some low representative populations.
Figure 5 –
Figure 5 –. High-throughput sequencing and CITE-Seq analysis of T- and B-cell repertoire
a, TRBV gene usage in MIS-C (n=96 samples from 58 patients), pCOVID-19 (n=21 samples from 21 patients), and pHC (n=13 samples from 13 subjects). Clonotypes with ambiguous gene assignments are excluded from the figure. For each gene, non-parametric Kruskal-Wallis test with unadjusted P values was used to compare the three groups. ns: p > 0.05 (not significant), *: p<=0.05, **: p<=0.01, ***: p<=0.001, ****: p<=0.0001. b, TRBV11−2 gene usage observed in MIS−C patients within the first 7 days (in blue, n=36 samples from 35 patients) and at later time points (in yellow, n=59 samples from 44 patients) during hospitalization. Pearson correlation coefficient (number of days from admission versus TRBV11−2 gene usage) and its p value are shown for both time intervals. The inset plot in the figure provides a comparison between the TRBV11−2 gene usage distributions in these two-time intervals and a p value derived from two-tailed Wilcoxon rank sum test. Box plots show the median, first and third quantiles (lower and upper hinges) and smallest (lower hinge - 1.5*interquartile range) and largest values (upper hinge + 1.5* interquartile range) (lower and upper whiskers). c, Upper panel: TRBV11–2 usage (TRBV11–2 ratio among each sample) in CD4+ T cells among three groups (pHC, n=7; pCOVID-19, n=7 and MIS-C, n=8 [2 subjects with two timepoints]) within 40 days of admission. P values shown are from two-sided Wilcoxon test between indicated two groups. Lower panel: TRBV11–2 usage frequency in MIS-C CD4+ T cells over time (days since admission, n=10). Pearson correlation (R) and associated p values are shown. The shaded area represents standard error. Each dot indicates a sample. Box plot elements are the same as Figure 4e. d, Mutation quantification of plasmablasts in the three groups (pHC, n=7; pCOVID-19, n=8 and MIS-C, n=7). P values shown were obtained using two-sided Wilcoxon test between indicated two groups. Each dot indicates a cell. Box plot elements are the same as Figure 4b. e, Heatmap showing autoantibodies with the highest variance ordered by fold change, using a cut-off of four-fold change (see Methods). Comparisons were made between pCOVID-19 (n=5), MIS-C that did not receive IVIG (n=6), and MIS-C post-IVIG administration (MIS-C_IVIG, n=4).

References

    1. Castagnoli R, et al. Severe Acute Respiratory Syndrome Coronavirus 2 (SARS-CoV-2) Infection in Children and Adolescents: A Systematic Review. JAMA Pediatr 174, 882–889 (2020). - PubMed
    1. Shekerdemian LS, et al. Characteristics and Outcomes of Children With Coronavirus Disease 2019 (COVID-19) Infection Admitted to US and Canadian Pediatric Intensive Care Units. JAMA Pediatr 174, 868–873 (2020). - PMC - PubMed
    1. Verdoni L, et al. An outbreak of severe Kawasaki-like disease at the Italian epicentre of the SARS-CoV-2 epidemic: an observational cohort study. Lancet 395, 1771–1778 (2020). - PMC - PubMed
    1. Riphagen S, Gomez X, Gonzalez-Martinez C, Wilkinson N & Theocharis P Hyperinflammatory shock in children during COVID-19 pandemic. Lancet 395, 1607–1608 (2020). - PMC - PubMed
    1. CDC Health Advisory Panel. Multisystem Inflammatory Syndrome in Children (MIS-C) Associated with Coronavirus Disease 2019 (COVID-19). Centers for Disease Control and Prevention. Available at https://emergency.cdc.gov/han/2020/han00432.asp. Accessed 28 June 2021.

Methods-only References

    1. COVID-19 Treatment Guidelines Panel. Coronavirus Disease 2019 (COVID-19) Treatment Guidelines. National Institutes of Health. Available at https://www.covid19treatmentguidelines.nih.gov/. Accessed 28 June 2021. - PubMed
    1. Burbelo PD, et al. Sensitivity in Detection of Antibodies to Nucleocapsid and Spike Proteins of Severe Acute Respiratory Syndrome Coronavirus 2 in Patients With Coronavirus Disease 2019. J Infect Dis 222, 206–213 (2020). - PMC - PubMed
    1. Liu SY, Sanchez DJ, Aliyari R, Lu S & Cheng G Systematic identification of type I and type II interferon-induced antiviral factors. Proc Natl Acad Sci U S A 109, 4239–4244 (2012). - PMC - PubMed
    1. Webtool For Basic Data Plotting And Analysis. An interactive open source software tool for a rapid first pass analysis. Available at https://foocheung.shinyapps.io/FFSv011/. Accessed on 01 July 2021.
    1. Huynh-Thu VA, Irrthum A, Wehenkel L & Geurts P Inferring regulatory networks from expression data using tree-based methods. PLoS One 5(2010). - PMC - PubMed

Publication types

Supplementary concepts