. 2022 Apr;21(2):95-129.
doi: 10.1177/14738716211045354. Epub 2021 Sep 22.

Which emphasis technique to use? Perception of emphasis techniques with varying distractors, backgrounds, and visualization types

Affiliations

Which emphasis technique to use? Perception of emphasis techniques with varying distractors, backgrounds, and visualization types

Aristides Mairena et al. Inf Vis. 2022 Apr.

Abstract

Emphasis effects are visual changes that make data elements distinct from their surroundings. Designers may use computational saliency models to predict how a viewer's attention will be guided by a specific effect; however, although saliency models provide a foundational understanding of emphasis perception, they only cover specific visual effects in abstract conditions. To address these limitations, we carried out crowdsourced studies that evaluate emphasis perception in a wider range of conditions than previously studied. We varied effect magnitude, distractor number and type, background, and visualization type, and measured the perceived emphasis of 12 visual effects. Our results show that there are perceptual commonalities of emphasis across a wide range of environments, but also that there are limitations on perceptibility for some effects, dependent on a visualization's background or type. We developed a model of emphasis predictability based on simple scatterplots that can be extended to other viewing conditions. Our studies provide designers with new understanding of how viewers experience emphasis in realistic visualization settings.

Keywords: Data visualization; empirical evaluation; experimental studies; human-computer interaction; perception.


Figures

Figure 1
Figure 1
Participant view of the object field in Study 1; target showing size emphasis effect is at lower right. .
Figure 2.
Figure 2.
Example distractors (D), stimuli, and their magnitude ranges.
Figure 3.
Figure 3.
Shapes and QTONS used in our studies.
Figure 4.
Figure 4.
Experiment 1, mean trial time (±SE) per variable. Empirical means (solid lines) and log curve (dashed lines).
Figure 5.
Figure 5.
Experiment 1, mean accuracy (±SE) per variable. Empirical means (solid lines) and log curve (dashed lines).
Figure 6.
Figure 6.
Experiment 1, mean rating (±SE) per variable. Empirical means (solid lines) and log curve (dashed lines).
Figure 7.
Figure 7.
Experiment 2, mean search times (±SE) per variable with multiple distractor amounts. Level 1 (solid lines), levels 2–3 (dashed lines).
Figure 8
Figure 8
Experiment 2, mean accuracy (±SE) per variable with multiple distractor amounts. Level 1 (solid lines), levels 2–3 (dashed lines). .
Figure 9.
Figure 9.
Experiment 2, mean rating (±SE) per variable with multiple distractor amounts. Level 1 (solid lines), levels 2–3 (dashed lines).
Figure 10.
Figure 10.
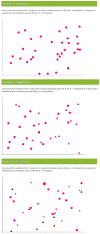
Example trials with multiple distractor types. Top (one distractor), middle (two distractors), and bottom (three distractors).
Figure 11.
Figure 11.
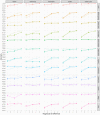
Experiment 3, mean search times (±SE) per variable with multiple distractor types. Level 1 (solid lines), levels 2–3 (dashed lines).
Figure 12.
Figure 12.
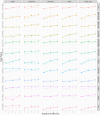
Experiment 3, mean accuracy (±SE) per variable with multiple distractor types. Level 1 (solid lines), levels 2–3 (dashed lines).
Figure 13.
Figure 13.
Experiment 3, mean rating (±SE) per variable with multiple distractor types. Level 1 (solid lines), levels 2–3 (dashed lines).
Figure 14.
Figure 14.
Additional visualization types and backgrounds: (a) Hexbin, with target shown using size in lower left quadrant, (b) HexbinMap, with target shown using color in lower left, (c) Infographic, with target shown using color in the top-left quadrant, and (d) dark-mode scatterplot, with target shown using color in lower middle. We also included the baseline scatterplot from Study 1 (see Figure 1).
Figure 15.
Figure 15.
Mean search times (±SE) per variable and visualization type. Dashed lines show predictions from our model.
Figure 16.
Figure 16.
Mean accuracy (±SE) per variable and visualization type. Dashed lines show predictions from our model. .
Figure 17.
Figure 17.
Mean rating (±SE) per variable and visualization type. Dashed lines show predictions from our model.
Figure 18.
Figure 18.
Overlaping and crowding among distractor items in Hexbin increase difficulty for emphasis effects. Shape (unfilled star) is present near the arrow (added through photo-editing software).

References

    1. Segel E, Heer J. Narrative visualization: telling stories with data. IEEE Trans Vis Comput Graph 2010; 16(6): 1139–1148. - PubMed
    1. Bradbury JD, Guadagno RE. Documentary narrative visualization: features and modes of documentary film in narrative visualization. Inf Vis 2020; 19(4): 339–352.
    1. Healey CG, Enns JT. Attention and visual memory in visualization and computer graphics. IEEE Trans Vis Comput Graph 2012; 18(7): 1170–1188. - PubMed
    1. Gutwin C, Cockburn A, Coveney A. Peripheral popout: the influence of visual angle and stimulus intensity on popout effects. In: Proceedings of the 2017 CHI conference on human factors in computing systems, Denver, CO, 6–11 May 2011, pp.208–219. New York, NY: ACM.
    1. Treisman AM, Gelade G. A feature-integration theory of attention. Cogn Psychol 1980; 12(1): 97–136. - PubMed

LinkOut - more resources