. 2022 Feb 1:13:816640.
doi: 10.3389/fimmu.2022.816640. eCollection 2022.

Periodontal Infection Aggravates C1q-Mediated Microglial Activation and Synapse Pruning in Alzheimer's Mice

Affiliations

Periodontal Infection Aggravates C1q-Mediated Microglial Activation and Synapse Pruning in Alzheimer's Mice

Xiaoxiao Hao et al. Front Immunol. .

Abstract

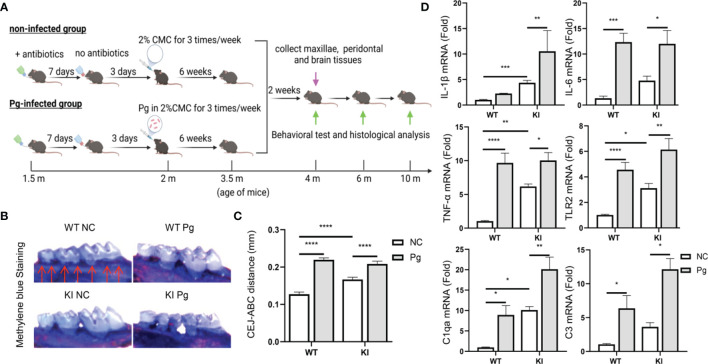
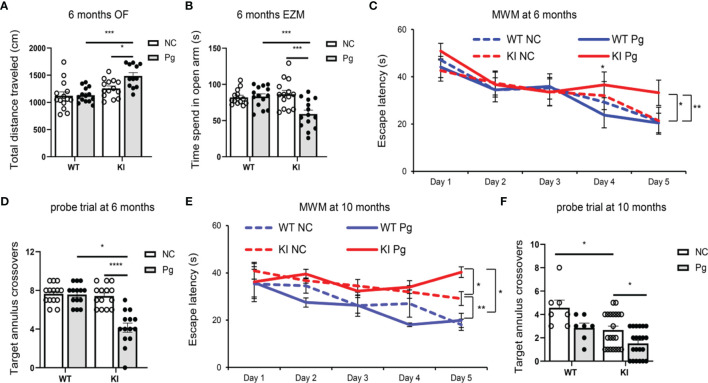
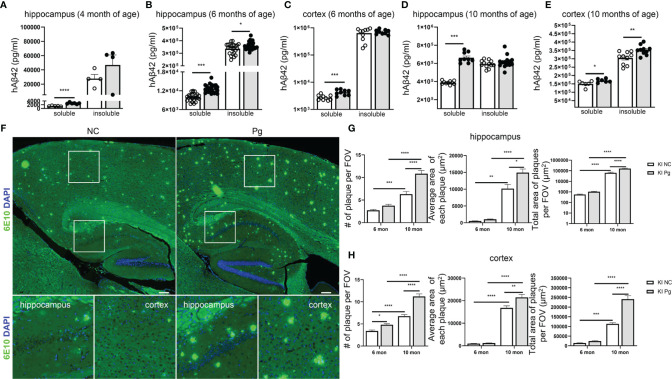
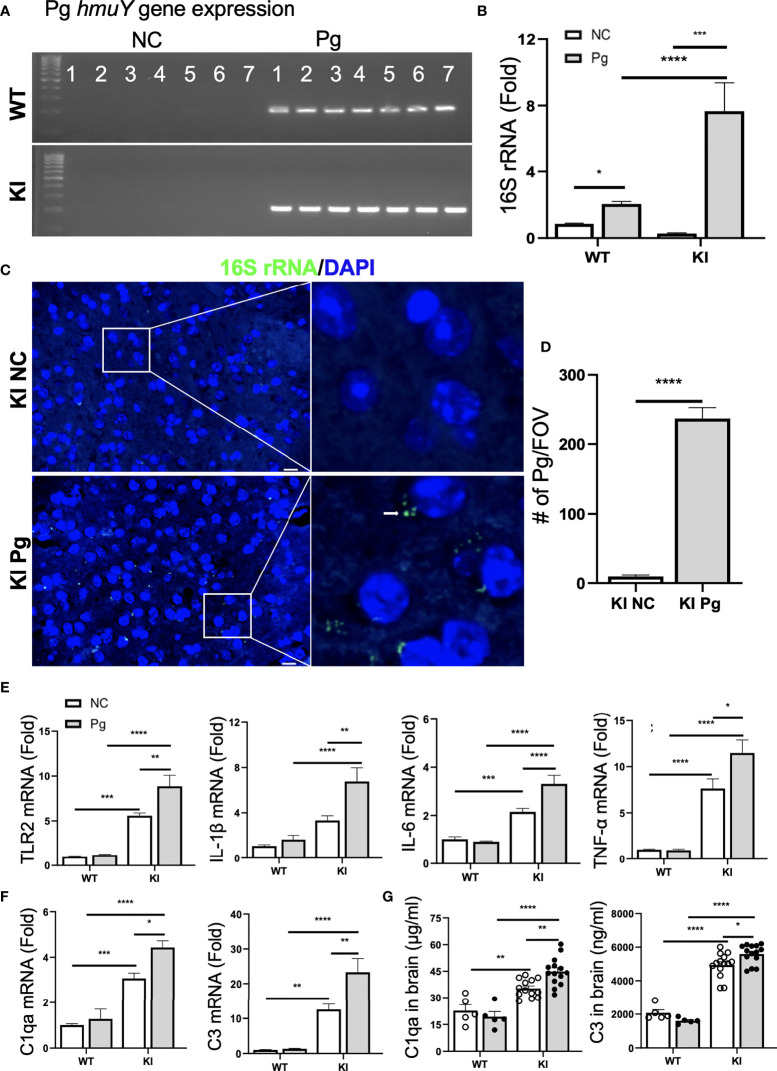
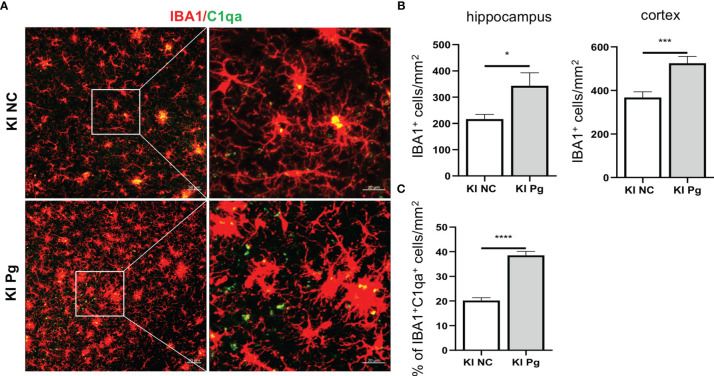
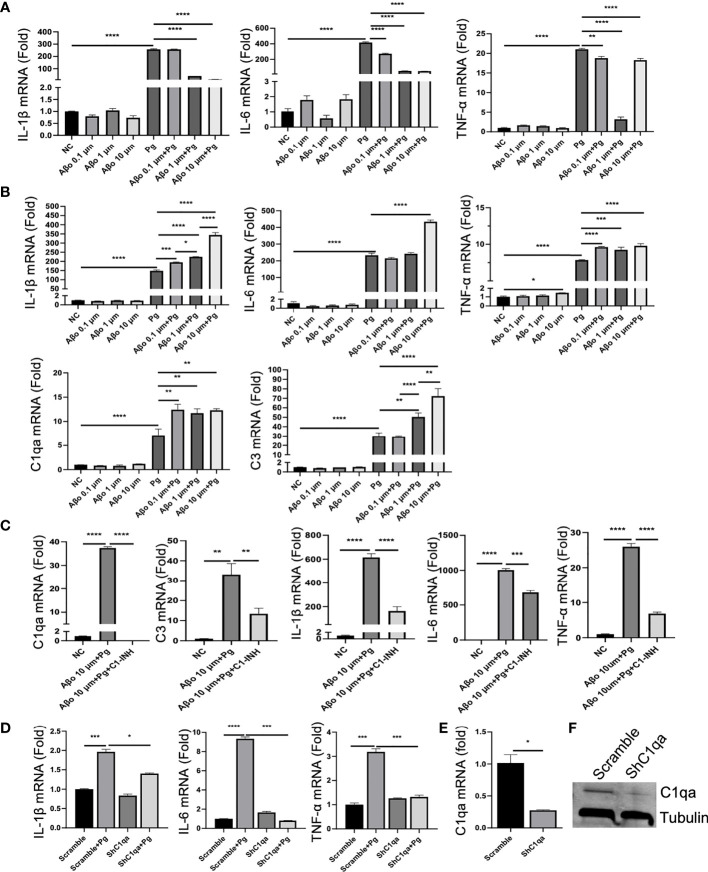
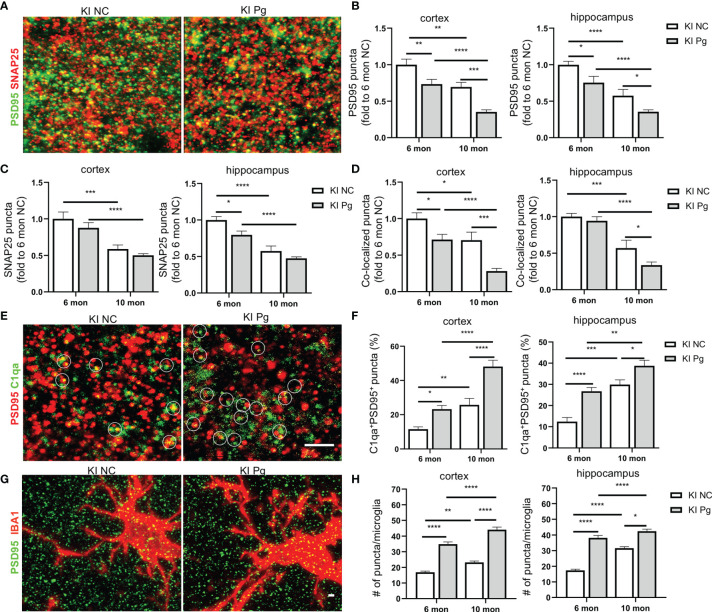
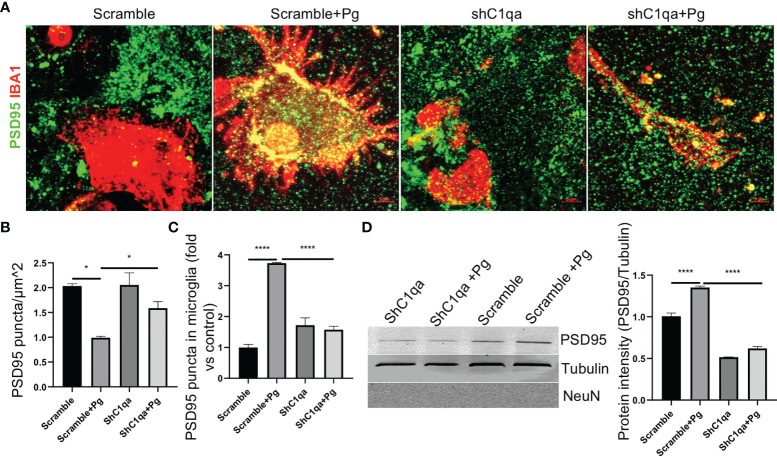
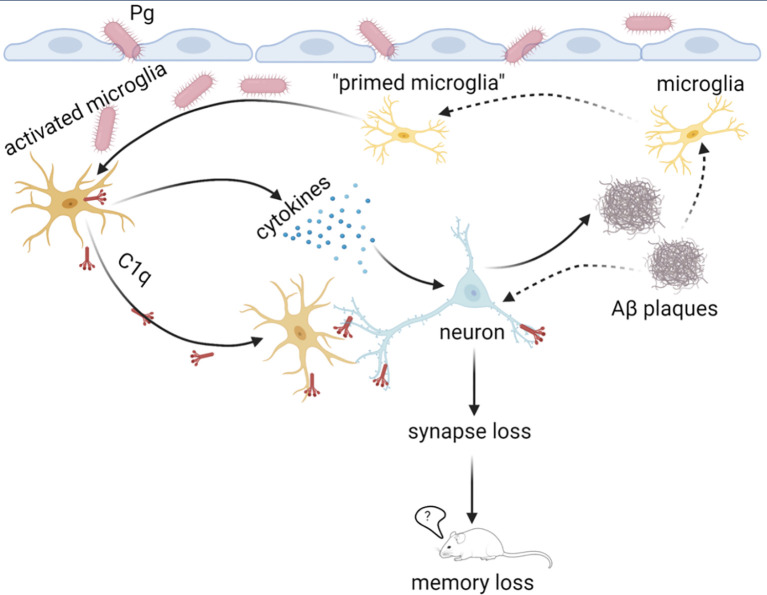
Periodontitis is a dysbiotic infectious disease that leads to the destruction of tooth supporting tissues. There is increasing evidence that periodontitis may affect the development and severity of Alzheimer's disease (AD). However, the mechanism(s) by which periodontal infection impacts the neurodegenerative process in AD remains unclear. In the present study, using an amyloid precursor protein (APP) knock-in (App KI) AD mouse model, we showed that oral infection with Porphyromonas gingivalis (Pg), a keystone pathogen of periodontitis, worsened behavioral and cognitive impairment and accelerated amyloid beta (Aβ) accumulation in AD mice, thus unquestionably and significantly aggravating AD. We also provide new evidence that the neuroinflammatory status established by AD, is greatly complicated by periodontal infection and the consequential entry of Pg into the brain via Aβ-primed microglial activation, and that Pg-induced brain overactivation of complement C1q is critical for periodontitis-associated acceleration of AD progression by amplifying microglial activation, neuroinflammation, and tagging synapses for microglial engulfment. Our study renders support for the importance of periodontal infection in the innate immune regulation of AD and the possibility of targeting microbial etiology and periodontal treatment to ameliorate the clinical manifestation of AD and lower AD prevalence.

Keywords: Alzheimer’s disease; Periodontitis; Porphyromonas gingivalis; complement C1q; microglia; synapse loss.


Conflict of interest statement

SB is the CSO & Co-Founder of CNine Biosolutions, LLC. The remaining authors declare that the research was conducted in the absence of any commercial or financial relationships that could be construed as a potential conflict of interest.

Figures

Figure 1
Figure 1
Pg-induced alveolar bone loss and periodontal inflammation in App KI and WT mice following oral infection. (A) Schematic of the experimental design used in this study. m, month. (B) Representative methylene blue-stained maxillae from non-infected (NC) and Pg-infected WT and App KI mice (n=9 mice/group). Bone loss was assessed in a total of 7 buccal sites (red arrows) per mouse. (C) Alveolar bone loss in Pg-infected and non-infected WT and App KI mice; mm, millimeter; CEJ-ABC, cemento-enamel junction-alveolar bone crest. (D) Inflammatory cytokine and complement gene expression in gingival tissues from non-infected and Pg-infected WT and App KI mice. Gene expression was normalized to GAPDH and expressed as fold changes. Samples were done in duplicate (n=7 mice/group). Data are expressed as mean ± SEM. *P < 0.05, **P < 0.01, ***P < 0.001, ****P < 0.0001, by two-way ANOVA followed with Tukey correction.
Figure 2
Figure 2
Pg infection worsens cognitive and behavior impairment in App KI mice. (A) Total distance traveled in open field (OF) tests at 6 months of age. cm, centimeter. (B) Time spent in open arm in elevated zero maze (EZM) tests at 6 months of age. s, second. (C, E) Escape latency in Morris water maze (MWM) tests at 6 (C) and 10 (E) months of age. (D, F) Target annulus crossovers in probe trial tests at 6 (D) and 10 (F) months of age. A-D, n=14/group; E-F, n=21/group (App KI mice), n=7/group (WT mice). Data are expressed as mean ± SEM. *P < 0.05, **P < 0.01, ***P < 0.001, ****P < 0.0001 by two-way ANOVA followed with Tukey correction.
Figure 3
Figure 3
Pg infection accelerates Aβ production and plaque formation in App KI mice. (A–E) Levels of soluble and insoluble hAβ42 in the brains of control and Pg-infected App KI mice at 4, 6 and 10 months of age. A, n=4-6/group; B, n=24/group; C-E, n=6-10/group. Samples were run in duplicate in ELISA. (F) Representative micrographs showing Aβ plaques formation in App KI mice at 10 months of age. Whole brain images were stitched with 30 series micrographs captured at 10 x objective using a KEYENCE BZ-800 microscope. Boxed areas were further enlarged. Aβ plaques were labeled with 6E10 (green) and cell nuclei were labeled with DAPI (blue). (G, H) Quantification of the number of Aβ plaques, average plaque size, and total plaque-occupied area per field of view (FOV) in the hippocampus (G) and cortex (H) of App KI mice at 6 and 10 months of age. Five representative regions of the cortex and hippocampus were captured at 40x objective from each brain section and quantified (n=5-7/group). Data are expressed as mean ± SEM. *P < 0.05, **P < 0.01, ***P < 0.001, ****P < 0.0001 by unpaired Student t-test (A–E), or by two-way ANOVA followed with Tukey correction (G, H).
Figure 4
Figure 4
Pg invades the brain and induces neuroinflammation and complement activation. (A) Pg-specific hmuY gene expression in brains from WT and App KI mice. (B) Pg-specific 16S rRNA expression in brains from WT and App KI mice. The levels of gene expression were normalized to GAPDH and shown as fold changes. Samples were run in duplicates (n=7/group). (C) Representative micrographs depicting intracellular localization of Pg in the cortex of brains from App KI mice. Pg were probed with 16S rRNA with FITC (green, arrowhead) and nuclei were labeled with DAPI (blue). Boxed areas were further enlarged. Scale bar, 10 µm. (D) Quantification of Pg in brain sections from non-infected and Pg-infected App KI mice. Five representative regions were captured at 40 x objective from each brain section and quantified (n=5-7/group); FOV, field of view. (E) The relative gene expression of inflammatory cytokines and TLR2 in brain tissues from WT and App KI mice. Samples were done in duplicates (n=5-7/group). (F) The relative gene expression of C1qa and C3 in brain tissues from WT and App KI mice. Samples were run in duplicates (n=5-7/group). (G) The levels of C1qa and C3 in the brains of WT and App KI mice. Samples were run in duplicates (WT mice, n=5-7/group; App KI mice, n=10-12/group). Data are expressed as mean ± SEM; *P < 0.05, **P < 0.01, ***P < 0.001, ****P < 0.0001 by two-way ANOVA followed with Tukey correction (B, E–G) or by unpaired Student t-test (D).
Figure 5
Figure 5
Pg activates microglia in App KI mice and co-localize with complement C1q. Brain sections from 6-month-old non-infected and Pg-infected App KI mice were immune-stained with antibodies against IBA1and C1qa. (A) Representative Z-stack images of brain sections depicting the spatial association between microglia (red) and C1qa (green). (B) Quantification of IBA1+ cells in the hippocampus and cortex regions. n=6-7 mice/group. (C) Percentage of IBA1+C1qa+ microglia in non-infected and Pg-infected App KI mice. Five representative micrographs of the cortex and hippocampus regions from each mouse were analyzed (n=5-7 mice/group). Data are expressed as mean ± SEM. *P < 0.05, ***P < 0.001, ****P < 0.0001 by unpaired Students t-test.
Figure 6
Figure 6
Effect of Aβo and complement activation on Pg-induced microglial inflammatory responses. (A, B) Aβo on Pg-induced cytokine production and complement activation. Primary microglia were treated with Aβo (0.1, 1 or 10 µM), Pg (MOI=50), or co-stimulated with Aβo and Pg for 24 h (A), or pretreated with Aβo for 6 h followed by Pg stimulation for 24 h (B). Relative gene expression of IL-1β, IL-6, TNF-α, C1qa, and C3 was analyzed by RT-qPCR. (C) C1 inhibition on Pg-induced inflammatory gene expression by microglia. Primary microglia were untreated or pretreated with C1-INH for 4 h, and then treated with Aβo (10 µM) for 6 h followed by Pg (MOI=50) for 24 h. Relative gene expression of C1qa, C3, IL-1β, IL-6, and TNF-α in microglia were analyzed by RT-PCR. (D) Effect of C1qa depletion on Pg-induced cytokine gene expression by microglia. Primary microglia cells expressing scramble or C1qa shRNA vectors were treated with Pg (MOI=50) for 24 h. Relative gene expression of IL-1β, IL-6, TNF-α in microglia were analyzed by RT-PCR. Expression of C1qa mRNA (E) and protein (F) in primary microglia verified by RT-PCR and Western blot. Samples were run in duplicates. Data are expressed as mean ± SEM of three independent experiments; *P < 0.05, **P < 0.01, ***P < 0.001, ****P < 0.0001 by one-way ANOVA followed with Tukey correction.
Figure 7
Figure 7
Pg infection enhances microglial elimination of synapses in App KI mice. (A) Representative high magnification Z-stack images showing SNAP 25 (presynaptic marker, red) and PSD95 (postsynaptic marker, green) synaptic terminals in the cortex and hippocampus from non-infected and Pg-infected App KI mice at 10 months of age. (B–D) Quantification of PSD95 puncta (B), SNAP25 puncta (C), and the co-localized PSD95 and SNAP25 puncta (D) in the cortex and hippocampus CA1 regions from non-infected and Pg-infected App KI mice at 6 and 10 months of age. Scale bar: 2 µm. (E) Representative high magnification Z-stack images of C1qa (green) and PSD95 (red) co-stained puncta in the cortex and hippocampus of the brains from non-infected and Pg-infected App KI mice at 10 months of age. Circles show examples of C1qa puncta co-localized with PSD95 puncta. Scale bar: 4 µm. (F) Quantification of co-stained C1qa and PSD95 in the cortex and hippocampus CA1 regions from non-infected and Pg-infected App KI mice at 6 and 10 months of age. (G) Representative high magnification Z-stack images of subicular microglia (IBA1+, red) co-stained with PSD95 (green) from non-infected and Pg-infected App KI mice at the 10 months of age, displaying elimination of synapses by microglia. Scale bar, 5 µm. (H) Quantification of engulfed PSD95 puncta density in microglia in the cortex and hippocampus CA1 regions of the brains from non-infected and Pg-infected App KI mice at 6 and 10 months of age. Data are expressed as mean ± SEM (n=4-7 mice/group). *P < 0.05, **P < 0.01, ***P < 0.001, ****P < 0.0001 by two-way ANOVA followed with Tukey correction.
Figure 8
Figure 8
Depletion of C1qa prevents Pg-induced synapse loss by microglia in vitro. (A) Representative Z-stack images of neuro-microglia (expressing shC1q or scramble vector) co-cultures in the presence or absence of Pg (MOI=50). Cultures were stained with IBA1 (red) and PSD95 (green). Scale bar: 5 µm. (B, C) Quantification of PSD95 puncta in the co-cultures (B) and in microglial cell bodies (C). (D) Western blot analysis of PSD95 puncta in FACS-sorted IBA1+ microglia lysates from the co-cultures. NeuN, neuronal marker. Densitometric analysis was performed using ImageJ software, and normalized to tubulin and expressed as fold changes over scramble control. Data are expressed as mean ± SEM of three independent experiments. *P < 0.05, ****P < 0.0001 by one-way ANOVA followed with Tukey correction.
Figure 9
Figure 9
Proposed “two-hit” model of AD progression in the presence of periodontitis. The accumulation of Aβ in the brain with AD may serve as the first “hit” to prime microglia and induce low levels of complement activation and neuroinflammation. In the presence of periodontitis, periodontal pathogens may invade the brain and serve as the second “hit” to amplify neuroinflammation of the Aβ-primed microglia and facilitate synapse loss. Complement C1q is critical for Pg-mediated acceleration of AD progression by tagging synapses for microglia engulfment. This image was created by Biorender.com.

Similar articles

Cited by

References

    1. Bateman R. Alzheimer’s Disease and Other Dementias: Advances in 2014. Lancet Neurol (2015) 14(1):4–6. doi: 10.1016/S1474-4422(14)70301-1 - DOI - PubMed
    1. Chen Y, Dang M, Zhang Z. Brain Mechanisms Underlying Neuropsychiatric Symptoms in Alzheimer’s Disease: A Systematic Review of Symptom-General and -Specific Lesion Patterns. Mol Neurodegener (2021) 16(1):38. doi: 10.1186/s13024-021-00456-1 - DOI - PMC - PubMed
    1. Norton S, Matthews FE, Barnes DE, Yaffe K, Brayne C. Potential for Primary Prevention of Alzheimer’s Disease: An Analysis of Population-Based Data. Lancet Neurol (2014) 13(8):788–94. doi: 10.1016/S1474-4422(14)70136-X - DOI - PubMed
    1. Association . As. 2020 Alzheimer’s Disease Facts and Figures. Alzheimers Dement (2020) 16:391–460. doi: 10.1002/alz.12068 - DOI
    1. Lamont RJ, Hajishengallis G. Polymicrobial Synergy and Dysbiosis in Inflammatory Disease. Trends Mol Med (2015) 21(3):172–83. doi: 10.1016/j.molmed.2014.11.004 - DOI - PMC - PubMed

Publication types

Substances