. 2022 Feb 7:2022:2900875.
doi: 10.1155/2022/2900875. eCollection 2022.

Presynaptic NMDA Receptors Influence Ca2+ Dynamics by Interacting with Voltage-Dependent Calcium Channels during the Induction of Long-Term Depression

Affiliations

Presynaptic NMDA Receptors Influence Ca2+ Dynamics by Interacting with Voltage-Dependent Calcium Channels during the Induction of Long-Term Depression

Florian B Neubauer et al. Neural Plast. .

Abstract

Spike-timing-dependent long-term depression (t-LTD) of glutamatergic layer (L)4-L2/3 synapses in developing neocortex requires activation of astrocytes by endocannabinoids (eCBs), which release glutamate onto presynaptic NMDA receptors (preNMDARs). The exact function of preNMDARs in this context is still elusive and strongly debated. To elucidate their function, we show that bath application of the eCB 2-arachidonylglycerol (2-AG) induces a preNMDAR-dependent form of chemically induced LTD (eCB-LTD) in L2/3 pyramidal neurons in the juvenile somatosensory cortex of rats. Presynaptic Ca2+ imaging from L4 spiny stellate axons revealed that action potential (AP) evoked Ca2+ transients show a preNMDAR-dependent broadening during eCB-LTD induction. However, blockade of voltage-dependent Ca2+ channels (VDCCs) did not uncover direct preNMDAR-mediated Ca2+ transients in the axon. This suggests that astrocyte-mediated glutamate release onto preNMDARs does not result in a direct Ca2+ influx, but that it instead leads to an indirect interaction with presynaptic VDCCs, boosting axonal Ca2+ influx. These results reveal one of the main remaining missing pieces in the signaling cascade of t-LTD at developing cortical synapses.


Conflict of interest statement

The authors declare no competing financial interests.

Figures

Figure 1
Figure 1
2-AG mediated LTD requires astrocyte Ca2+ signaling and preNMDARs. (a) Time course of normalized and averaged EPSP slope measured in L2/3 pyramidal neurons before, during (0–20 min, shaded area) and after bath application of 2-AG (n = 13). Inset, representative average EPSP during baseline (black) and after 2-AG (grey). (b) Relative change of coefficient of variation of EPSP slope after bath application of 2-AG as a function of corresponding changes in EPSP slope. The relation is almost linear, indicating a presynaptic locus of eCB-LTD expression. Open circles represent individual experiments, and filled circle represents the average (n = 13). (c) Two-photon fluorescence image of an astrocyte in L2/3 of the somatosensory cortex loaded with the Ca2+ indicator Rhod-2. Traces to the right show Ca2+ fluctuations in the astrocyte before, during, and after bath application of 2-AG (shaded area). (d) Summary of the average number of Ca2+ transients during the time course of the experiment (n = 12). p < 0.05 for the effect of time on Ca2+ transient number by Student's paired t-test. (e) Normalized and averaged EPSP slope over time in L2/3 pyramidal neurons, while an adjacent astrocyte was infused in the whole-cell recording configuration with either a control (Ctrl, n = 8) and or Ca2+ clamp solution (n = 9). Inset, representative average EPSP during baseline (black) and after 2-AG in control (light green) or Ca2+ clamp (dark green) conditions. (f) Normalized and averaged EPSP slope over time during bath application of APV (n = 13) or intracellular infusion of MK801 (n = 24) into the pyramidal neuron (iMK801). Inset, representative average EPSP during baseline (black) and after 2-AG in the presence of APV (purple) or iMK801 (blue). (g) Normalized and averaged EPSP slope in the presence of the calcineurin inhibitors FK506 and cyclosporin-A (n = 2). Inset, representative average EPSP during baseline (black) and after 2-AG (orange). (h) Bar graph summary of experiments shown in (e) and (f). In the astrocyte Ca2+ clamp condition, eCB-LTD was abolished. APV blocked eCB-LTD, while intracellular block of postsynaptic NMDARs with MK801 had no effect. #p < 0.05 by one-way ANOVA. All data are represented as mean ± SEM. All scale bars for average EPSPs represent 40 ms and 2 mV, respectively.
Figure 2
Figure 2
Presynaptic Ca2+ imaging in L4 spiny stellate axons. (a) Two-photon fluorescence image of a spiny stellate neuron in L4 of the somatosensory cortex loaded with OGB-1 and Alexa-594. (b) Imaged axon segment in L2/3 indicated in (a) by the dashed box. (c) Consecutive fluorescence traces of 1 min duration repeated every 5 min before, during (shaded area) and after bath application of 2-AG. An arrowhead indicates the time point of a somatically evoked AP. (d) Spontaneous axonal Ca2+ transient marked by a cross in (c) on an expanded scale. The Ca2+ transient was unrelated to somatic activity. (e) AP-evoked Ca2+ transient in the presence of 2-AG marked by an asterisk in (c) on an expanded scale (black) compared to an AP-evoked Ca2+ transient during baseline (grey). Dashed lines present single exponential fits to the decay of the Ca2+ transients.
Figure 3
Figure 3
Iontophoresis of glutamate does not evoke Ca2+ signals in boutons. (a) Two-photon fluorescence image of a dendrite of a spiny stellate neuron loaded with the Ca2+ indicator OGB-1 (200 μM) and the morphological dye Alexa 594 (50 μM). The position of the iontophoresis pipette for glutamate application is indicated. To the right, three fluorescence images taken before, 1 s after and 5 s after glutamate application, are shown. Below, the time-course of the fluorescence change in the region of interest indicated by the red, dashed circle (upper trace) and the somatic membrane potential (lower trace) are presented. Grey bar represents time of glutamate application. (b) Left, line-scan through a spine of another cell and the corresponding Ca2+ transient evoked by a burst of 5 APs at 50 Hz. Right, line-scan through the same spine during iontophoresis of glutamate. A clear increase in Ca2+ can be seen upon iontophoresis. (c) Two-photon fluorescence image of an axon of a spiny stellate neuron located in L2/3 loaded with the Ca2+ indicator OGB-1 (200 μM) and the morphological dye Alexa 594 (50 μM). The position of the iontophoresis pipette for glutamate application is indicated. To the right, three fluorescence images taken before, 1 s after and 3 s after glutamate application, are shown. Below, the time-course of the fluorescence change in the region of interest indicated by the red, dashed circle (upper trace) and the somatic membrane potential (lower trace) is presented. Grey bar represents time of glutamate application. No increase in Ca2+ is apparent upon iontophoresis of glutamate onto the axon. (d) Left, line-scan through a bouton of another cell and the corresponding Ca2+ transient evoked by a burst of 5 APs at 50 Hz. Right, line-scan through the same bouton during iontophoresis of glutamate. An increase in Ca2+ is evoked by the APs, but not by iontophoresis of glutamate.
Figure 4
Figure 4
APV has no influence on presynaptic AP-evoked Ca2+ transients. (a) Axonal Ca2+ transients evoked by a single AP in a spiny stellate axon recorded in L2/3 during baseline (black) and in the presence of the NMDAR blocker APV (purple). Dashed lines represent single exponential fits to the decay of the Ca2+ transients. Lower trace represents the difference between the baseline and APV Ca2+ transients. Dashed line indicates zero and light shaded area indicates the baseline noise level (±SD). (b) Bar graph summary of the peak Ca2+ transient amplitudes (left) and decay time constants (right) for baseline and in the presence of APV. All data are represented as mean ± SEM.
Figure 5
Figure 5
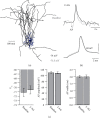
2-AG broadens AP-evoked Ca2+ transients in L4 axons. (a) Neurolucida reconstruction of a spiny stellate neuron. Dendrites are represented in blue and the axonal arborization in black. Inset, two-photon fluorescence image of the axon segment imaged in L2/3 indicated by the dashed box. (b) Left, averaged and normalized AP-evoked Ca2+ transients during baseline (grey) and after bath application of 2-AG (black). Upper trace represents the difference between the baseline and 2-AG Ca2+ transients. Dashed line indicates zero, and light-shaded area indicates the baseline noise level (±SD). Dashed lines represent single exponential fits to the decay of the Ca2+ transients. There is an apparent difference between the two transients. Inset shows somatic APs before and after bath application of 2-AG. Right, experiment in which the NMDAR-blocker APV was present in the bath. No difference between the two transients was observed in this condition. (c) Normalized decay time constant in the presence of 2-AG for different conditions. 2-AG significantly broadened the Ca2+ transients (n = 15). ##p < 0.01 for the effect of time on τ by paired Student's t-test. In contrast, no broadening was observed in the presence of APV (n = 11), AM251 (n = 5), or in control conditions without application of any drug (Ctrl, n = 4). APV had a significant effect on τ in the presence of 2-AG. p < 0.05 by one-way ANOVA. All data are represented as mean ± SEM. (d) Distribution of normalized decay time constants in the presence of 2-AG. Solid black lines represent Gaussian fits to the subsets that showed either no (light grey) or significant (dark grey) broadening of the Ca2+ transients.
Figure 6
Figure 6
AP properties are unaffected by 2-AG. (a) Neurolucida reconstruction of a spiny stellate neuron. Dendrites are represented in blue and the axonal arborization in black. (b) Upper traces, averaged and normalized AP-evoked Ca2+ transients during baseline (grey) and after bath application of 2-AG (black). Dashed lines represent single exponential fits to the decay of the Ca2+ transients. Lower traces, corresponding somatic APs before (grey) and after (black) bath application of 2-AG. (c) Average bar graphs of resting membrane potential, AP amplitude, and AP width before and after bath application of 2-AG (n = 12). None of the parameters changed significantly (p > 0.1 by paired Student's t-test). All data are represented as mean ± SEM.
Figure 7
Figure 7
Presynaptic burst patterns evoke an APV-sensitive Ca2+ transient component. (a) Example of the AP burst patterns that were used to evoke presynaptic Ca2+ transients in L4 spiny stellate axons. Left, 3 APs at 100 Hz. Right, 3 APs at 100 Hz followed 50 ms later by a single AP. (b) Axonal Ca2+ transients evoked by the activity patterns shown in (a) during baseline (black) and after bath application of APV (purple). Lower traces show the difference between the corresponding transients. (c) Comparison of the peak difference between the Ca2+ transients before and after bath application of APV (n = 6). The 3AP + 1AP activity pattern showed a significant effect of APV on the evoked Ca2+ transients, while the Ca2+ transients evoked by a burst of 3 APs alone were unaffected by APV. #p < 0.05 by paired Student's t-test. p < 0.05 by one-way ANOVA. All data are represented as mean ± SEM.
Figure 8
Figure 8
Block of VDCCs does not uncover preNMDAR-dependent Ca2+ transients. (a) Axonal Ca2+ transients evoked by a single AP in a spiny stellate axon recorded in L2/3 during baseline (black) and in the presence of the VDCC blockers Cd2+ and Ni+ (blue). Subsequent bath application of 2-AG did not result in an AP-evoked Ca2+ transient (green). Shaded areas represent ±SEM and dashed lines ±SD of the basal fluorescence before stimulation. (b) Bar graph summary of the peak Ca2+ transient amplitudes in the different conditions (n = 4). ∗∗p < 0.01 by Student's paired t-test with Bonferroni correction for multiple comparisons. All data are represented as mean ± SEM.

References

    1. Bouvier G., Bidoret C., Casado M., Paoletti P. Presynaptic NMDA receptors: roles and rules. Neuroscience . 2015;311:322–340. - PubMed
    1. Banerjee A., Larsen R. S., Philpot B. D., Paulsen O. Roles of presynaptic NMDA receptors in neurotransmission and plasticity. Trends in Neurosciences . 2016;39(1):26–39. - PMC - PubMed
    1. Wong H. H., Rannio S., Jones V., Thomazeau A., Sjöström P. J. NMDA receptors in axons: there's no coincidence. The Journal of Physiology . 2021;599(2):367–387. doi: 10.1113/JP280059. - DOI - PubMed
    1. Sjostrom P. J., Turrigiano G. G., Nelson S. B. Neocortical LTD via coincident activation of presynaptic NMDA and cannabinoid receptors. Neuron . 2003;39(4):641–664. - PubMed
    1. Rodriguez-Moreno A., Paulsen O. Spike timing-dependent long-term depression requires presynaptic NMDA receptors. Nature Neuroscience . 2008;11(7):744–745. - PubMed

Publication types