

Differences in muscle energy metabolism and metabolic flexibility between sarcopenic and nonsarcopenic older adults
- PMID: 35178889
- PMCID: PMC8978004
- DOI: 10.1002/jcsm.12932
Differences in muscle energy metabolism and metabolic flexibility between sarcopenic and nonsarcopenic older adults
Abstract
Background: Metabolic flexibility is the ability of skeletal muscle to adapt fuel utilization to the demand for fuel sources [carbohydrates (CHO) and fats (FAT)]. The purpose of this study was to explore muscle energy metabolism and metabolic flexibility under various conditions in sarcopenic (S) versus nonsarcopenic (NS) older adults.
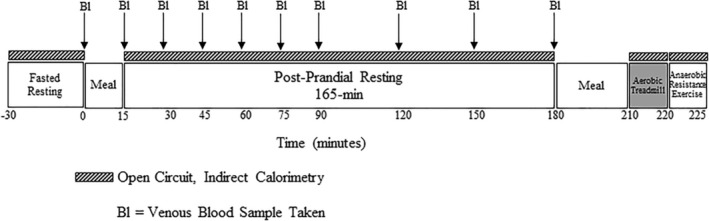
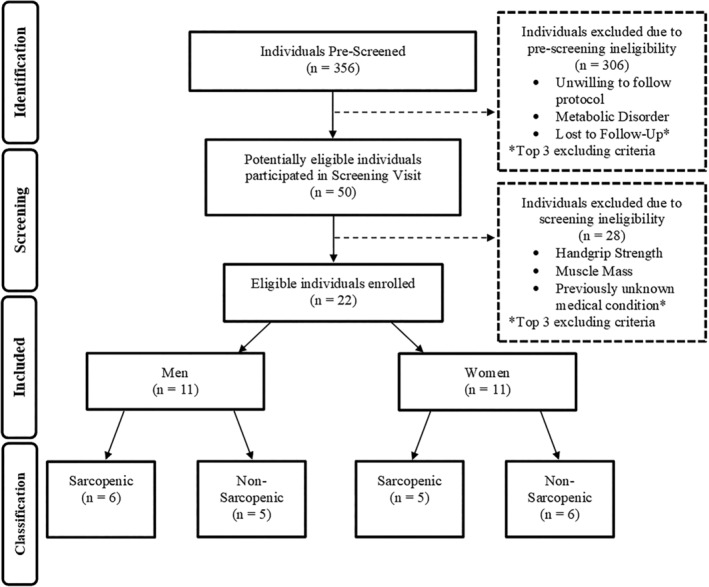
Methods: Twenty-two older adults aged 65 years or older were categorized as NS [n = 11; mean ± standard deviation (SD); age = 73.5 ± 6.0 years (males, n = 5; females, n = 6)] or S [n = 11; 81.2 ± 10.5 years (males, n = 6; females, n = 5) based on handgrip strength, body composition and physical performance. Indirect calorimetry was recorded before and after consumption of a high-CHO meal and during aerobic and anaerobic exercise. Respiratory quotient (RQ), CHO and FAT oxidation were assessed. Venous blood samples were collected for glucose and insulin concentrations.
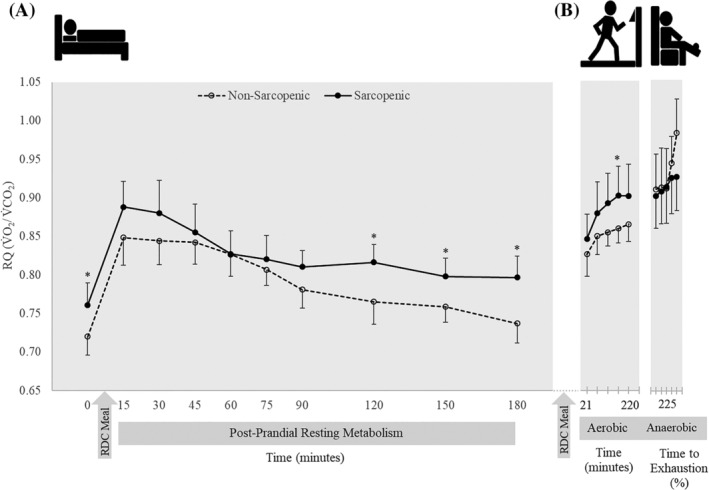
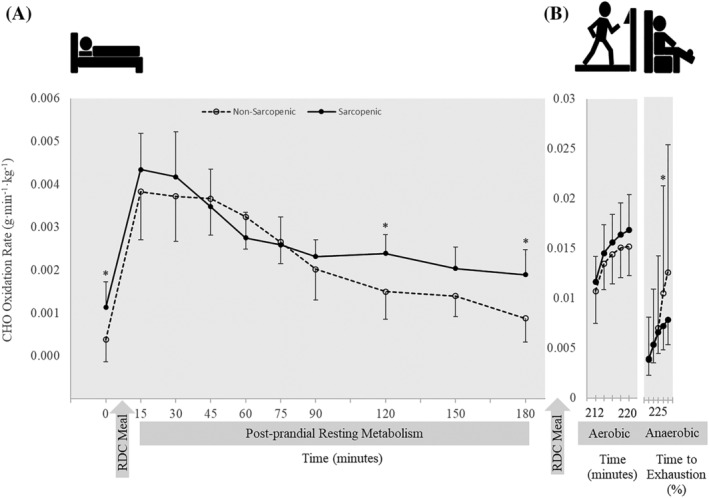
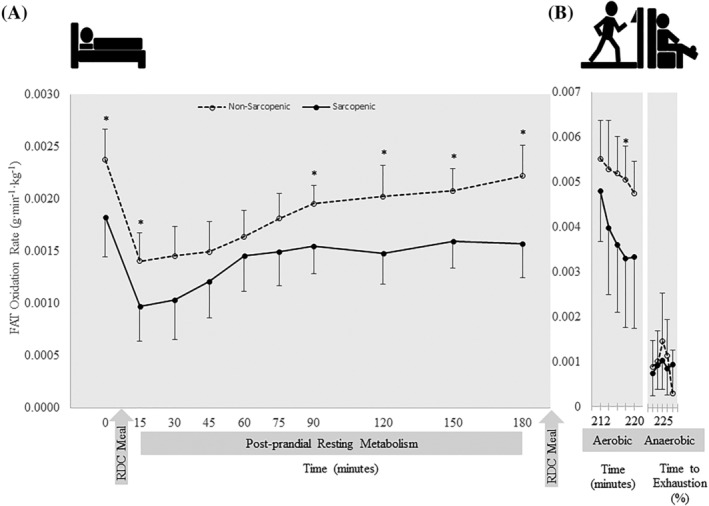
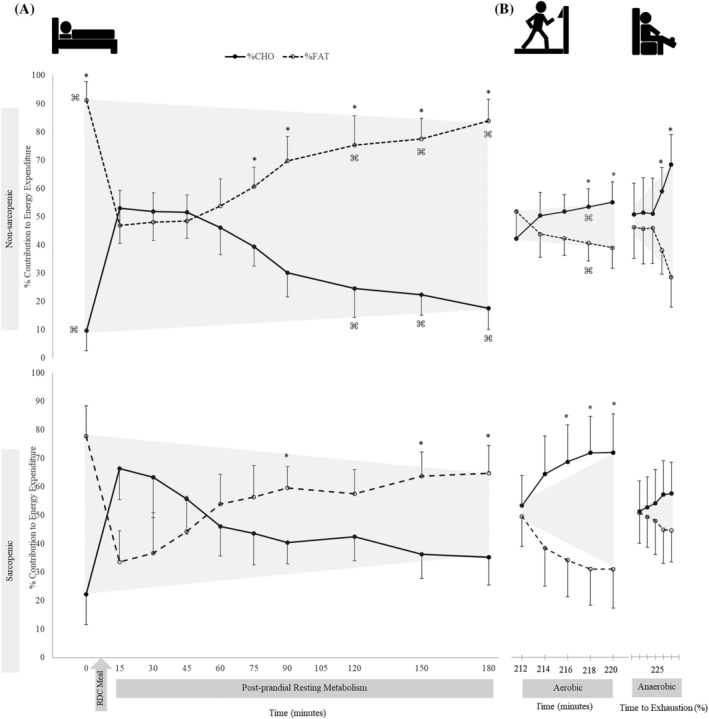
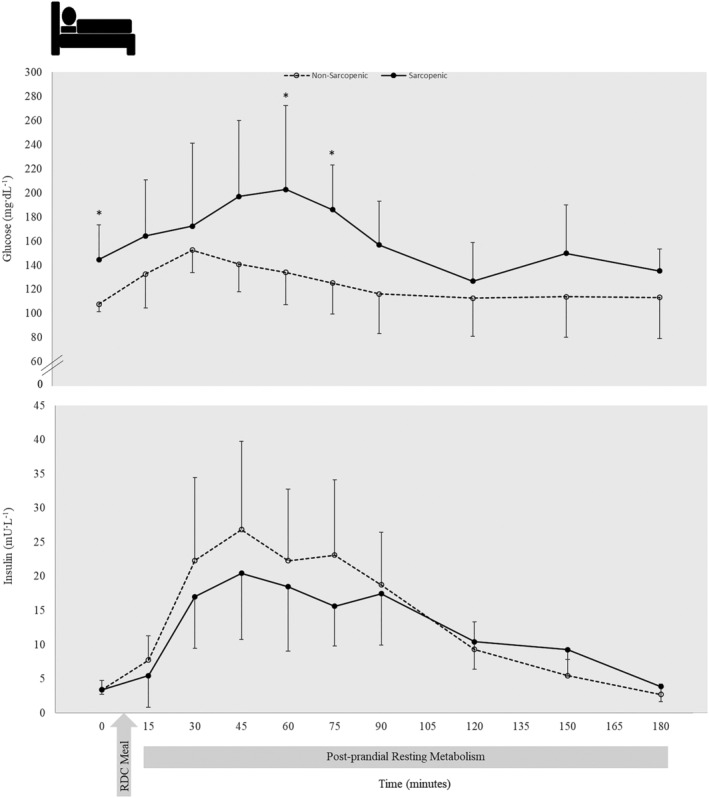
Results: At rest, compared with NS, S exhibited a 5-8% higher RQ at 0 (0.72 vs. 0.76) and 120 (0.77 vs. 0.82), 150 (0.76 vs. 0.80), and 180 min (0.74 vs. 0.80) (P = 0.002-0.025); 59-195% higher CHO oxidation at 0, 120, and 180 min (0.0004-0.002 vs. 0.001-0.002 g·min-1 ·kg-1) (P = 0.010-0.047); and 20-31% lower FAT oxidation at 0, 15, and 90-180 min (0.0009-0.0022 vs. 0.0011-0.002 g·min-1 ·kg-1 ) (P = 0.004-0.038). Glucose levels were significantly elevated in S versus NS at 0, 60 and 75 min (144.64-202.78 vs. 107.70-134.20 mg·dL-1 ) but not insulin. During aerobic exercise, RQ was 5% greater (0.90 vs. 0.86) (P = 0.039), and FAT oxidation was 35% lower at 6-8 min (0.003 vs. 0.005 g·min-1 ·kg-1 ) (P = 0.033) in S versus NS. During anaerobic exercise, CHO oxidation was 31% greater in NS versus S at 60-80% time to exhaustion (0.011 vs. 0.007 g·min-1 ·kg-1 ) (P = 0.015). Per cent contribution to energy expenditure was greater in S for CHO but lower for FAT at 0 (CHO: 22% vs. 10%; FAT: 78% vs. 91%) and 120-180 min (CHO: 35-42% vs. 17-25%; FAT: 58-65% vs. 75%-84%) (P = 0.003-0.046) at rest and 6-8 min during aerobic exercise (CHO: 70% vs. 57%; FAT: 30% vs. 45%) (P = 0.046).
Conclusions: The data show differences in skeletal muscle energy metabolism and substrate utilization between S and NS at rest, transitioning from fasted to fed state, and during exercise. Compared with NS, S displayed a diminished ability to adapt fuel utilization in response to feeding and exercise, reflecting metabolic inflexibility. Impaired metabolic flexibility could be a mechanism underlying the losses of strength and physical function accompanying sarcopenia.
Trial registration: ClinicalTrials.gov NCT03701867.
Keywords: Ageing; Carbohydrate oxidation; Exercise; Fat oxidation; Metabolic flexibility; Metabolism; Sarcopenia.
© 2022 The Authors. Journal of Cachexia, Sarcopenia and Muscle published by John Wiley & Sons Ltd on behalf of Society on Sarcopenia, Cachexia and Wasting Disorders.
Conflict of interest statement
SLP, JMLP and RR are employees and stock holders of Abbott. VAM is a former employee of Abbott. Since 2004, the laboratory directed by JTC has received research grants from Abbott Nutrition, National Cattlemen's Beef Association, Nebraska Beef Council, Nebraska Extension, Stepan Lipid Nutrition, Rock Creek Pharmaceuticals, General Nutrition Corporation, Experimental & Applied Sciences, Nutricia, and/or the USDA National Institute for Food and Agriculture. Between 2008 and 2018, JTC served intermittently as a paid consultant for Regeneron Pharmaceuticals, Abbott Nutrition, General Nutrition Corporation, ErgoGenix/ErgoPharm, or Corr‐Jensen Labs.
Figures
Similar articles
-
Decreased PDH activation and glycogenolysis during exercise following fat adaptation with carbohydrate restoration.Am J Physiol Endocrinol Metab. 2006 Feb;290(2):E380-8. doi: 10.1152/ajpendo.00268.2005. Epub 2005 Sep 27. Am J Physiol Endocrinol Metab. 2006. PMID: 16188909 Clinical Trial.
-
Impact of slow versus rapid digesting carbohydrates on substrate oxidation in pre-pubertal children: A randomized crossover trial.Clin Nutr. 2021 Jun;40(6):3718-3728. doi: 10.1016/j.clnu.2021.05.004. Epub 2021 May 11. Clin Nutr. 2021. PMID: 34130017 Clinical Trial.
-
Whole-body substrate metabolism is associated with disease severity in patients with non-alcoholic fatty liver disease.Gut. 2013 Nov;62(11):1625-33. doi: 10.1136/gutjnl-2012-302789. Epub 2012 Oct 17. Gut. 2013. PMID: 23077135
-
Sedentary behaviour is a key determinant of metabolic inflexibility.J Physiol. 2018 Apr 15;596(8):1319-1330. doi: 10.1113/JP273282. Epub 2017 Jul 4. J Physiol. 2018. PMID: 28543022 Free PMC article. Review.
-
Regulatory mechanisms in the interaction between carbohydrate and lipid oxidation during exercise.Acta Physiol Scand. 2003 Aug;178(4):443-52. doi: 10.1046/j.1365-201X.2003.01152.x. Acta Physiol Scand. 2003. PMID: 12864750 Review.
Cited by
-
Metabolic dysfunction and the development of physical frailty: an aging war of attrition.Geroscience. 2024 Aug;46(4):3711-3721. doi: 10.1007/s11357-024-01101-7. Epub 2024 Feb 24. Geroscience. 2024. PMID: 38400874 Free PMC article. Review.
-
Sarcopenic obesity in older adults: a clinical overview.Nat Rev Endocrinol. 2024 May;20(5):261-277. doi: 10.1038/s41574-023-00943-z. Epub 2024 Feb 6. Nat Rev Endocrinol. 2024. PMID: 38321142 Review.
-
Prehabilitation: Do We Need Metabolic Flexibility?Ann Nutr Metab. 2025;81(4):223-233. doi: 10.1159/000545266. Epub 2025 Mar 21. Ann Nutr Metab. 2025. PMID: 40122036 Free PMC article. Review.
-
Exercise Testing for Metabolic Flexibility: Time for Protocol Standardization.Sports Med Open. 2025 Mar 31;11(1):31. doi: 10.1186/s40798-025-00825-w. Sports Med Open. 2025. PMID: 40164840 Free PMC article.
-
Aging-Related Sarcopenia: Metabolic Characteristics and Therapeutic Strategies.Aging Dis. 2024 Apr 7;16(2):1003-1022. doi: 10.14336/AD.2024.0407. Aging Dis. 2024. PMID: 38739945 Free PMC article. Review.
References
-
- Wolfe RR. The underappreciated role of muscle in health and disease. Am J Clin Nutr 2006;84:475–482. - PubMed
-
- Feher J. Muscle energetics, fatigue and training. In Quantitative Human Physiology. Academic Press; 2012. p 270–280.
Publication types
MeSH terms
Associated data
Grants and funding
LinkOut - more resources
Full Text Sources
Medical
Miscellaneous
