. 2022 Feb 18:11:e73775.
doi: 10.7554/eLife.73775.

Visualizing cellular and tissue ultrastructure using Ten-fold Robust Expansion Microscopy (TREx)

Affiliations

Visualizing cellular and tissue ultrastructure using Ten-fold Robust Expansion Microscopy (TREx)

Hugo G J Damstra et al. Elife. .

Erratum in

Abstract

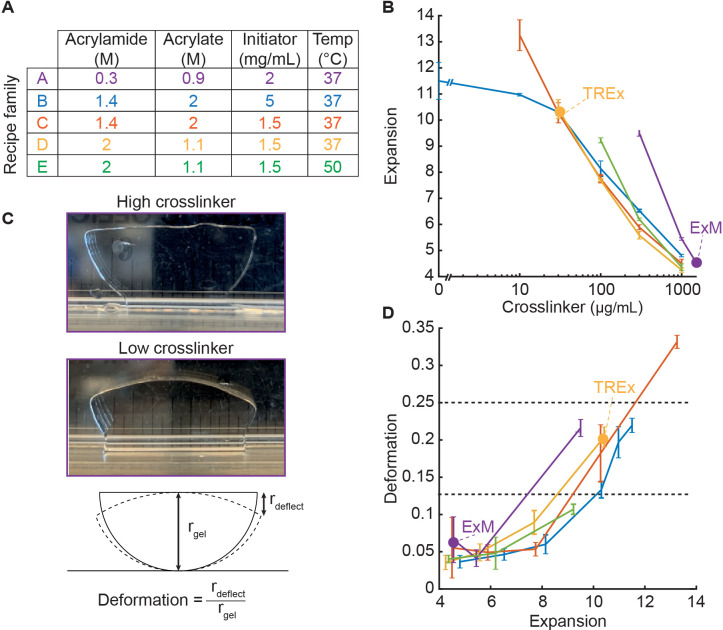
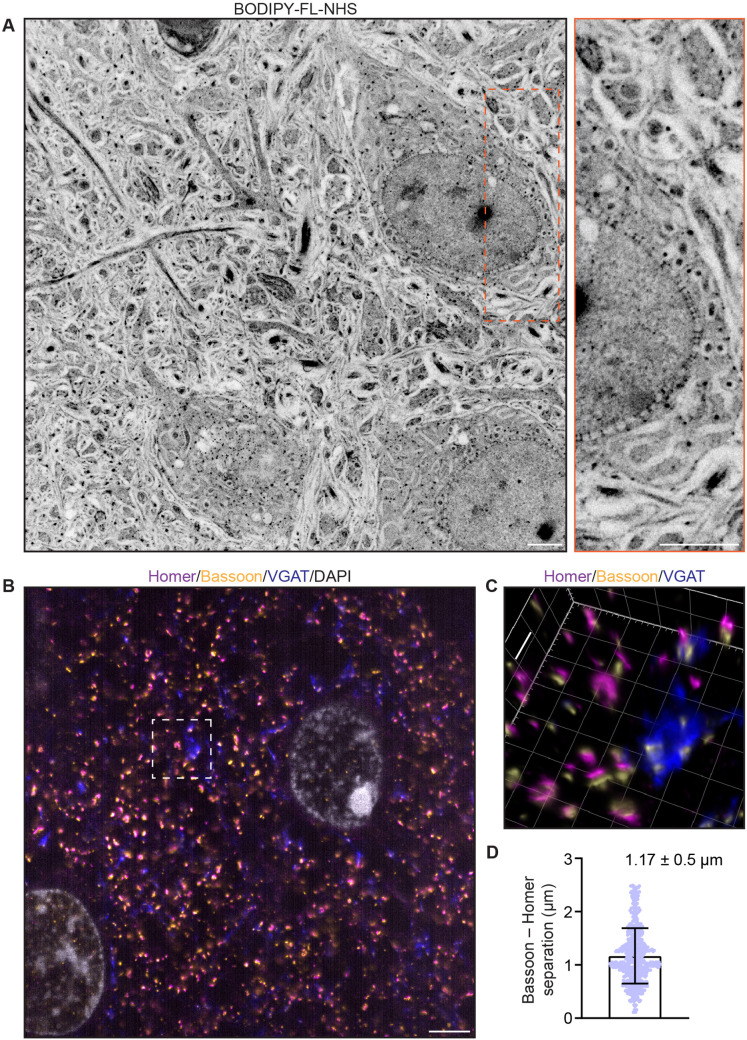
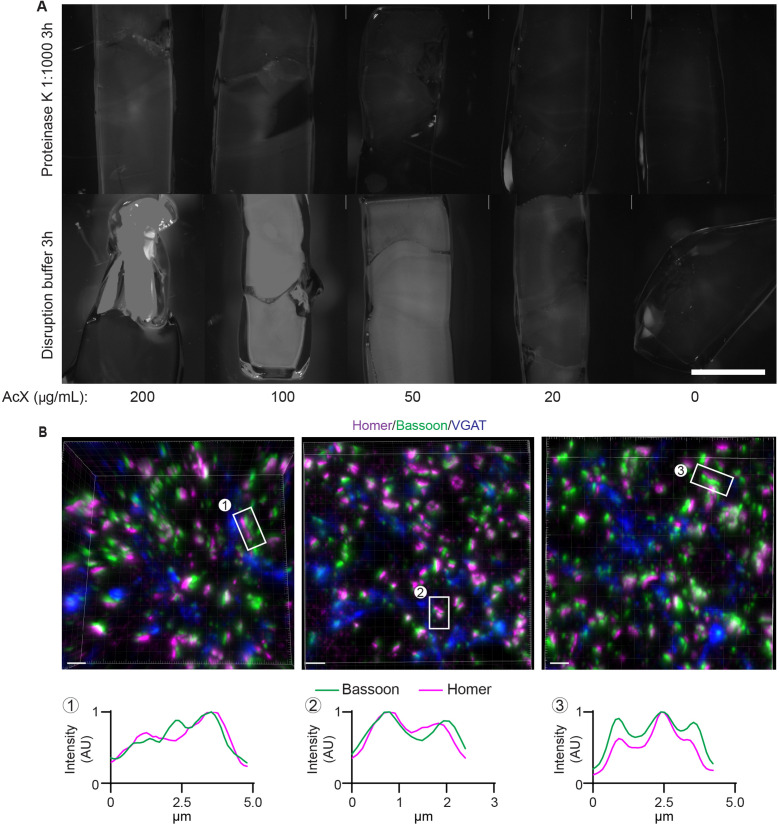
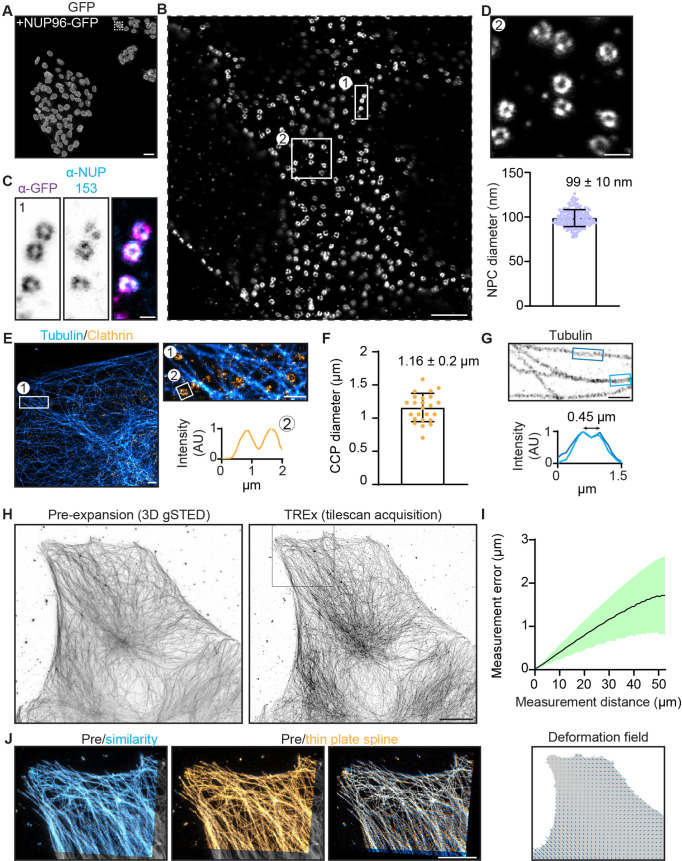
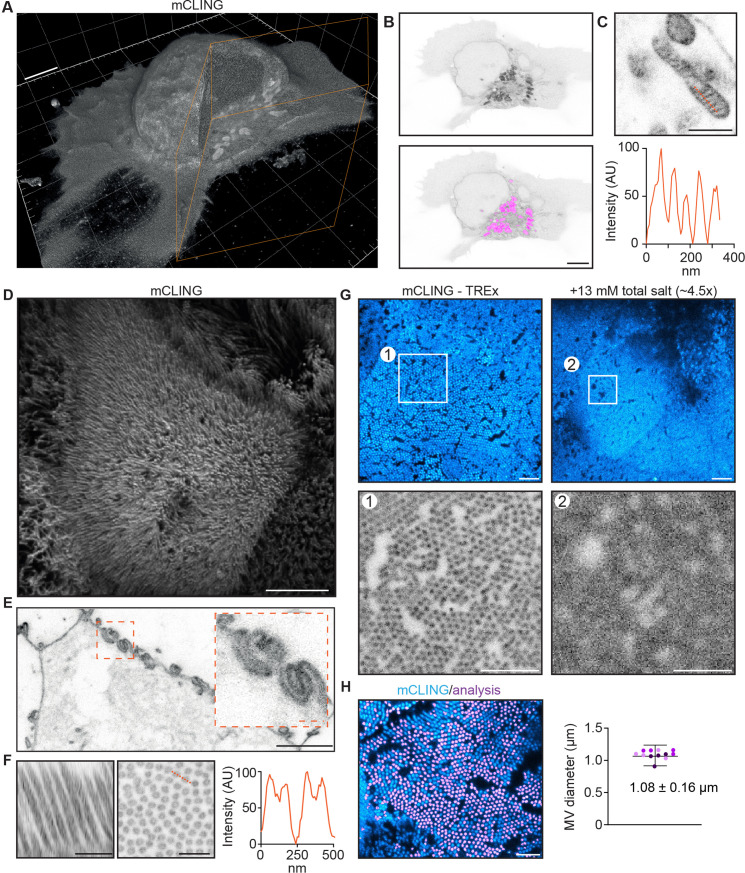
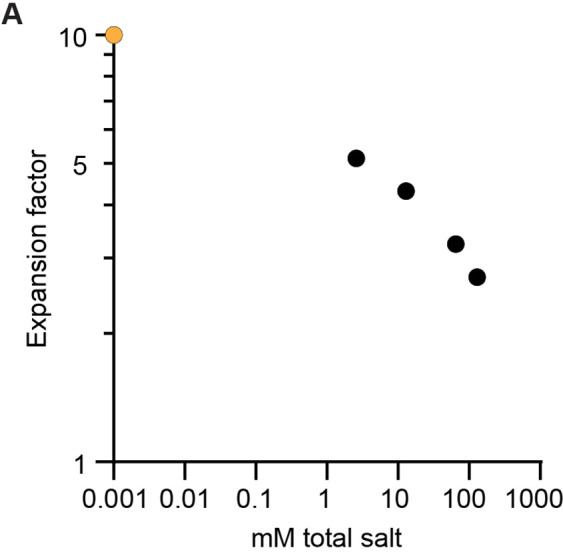
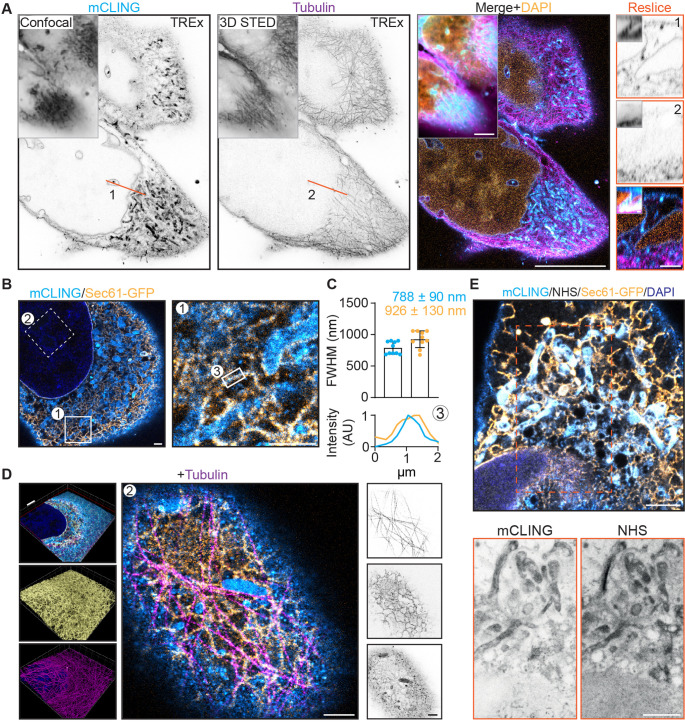
Expansion microscopy (ExM) is a powerful technique to overcome the diffraction limit of light microscopy that can be applied in both tissues and cells. In ExM, samples are embedded in a swellable polymer gel to physically expand the sample and isotropically increase resolution in x, y, and z. The maximum resolution increase is limited by the expansion factor of the gel, which is four-fold for the original ExM protocol. Variations on the original ExM method have been reported that allow for greater expansion factors but at the cost of ease of adoption or versatility. Here, we systematically explore the ExM recipe space and present a novel method termed Ten-fold Robust Expansion Microscopy (TREx) that, like the original ExM method, requires no specialized equipment or procedures. We demonstrate that TREx gels expand 10-fold, can be handled easily, and can be applied to both thick mouse brain tissue sections and cultured human cells enabling high-resolution subcellular imaging with a single expansion step. Furthermore, we show that TREx can provide ultrastructural context to subcellular protein localization by combining antibody-stained samples with off-the-shelf small-molecule stains for both total protein and membranes.

Keywords: cell biology; expansion microscopy; human; immunofluorescence; light microscopy; mouse; neuroscience; sub-organelle imaging; super-resolution.


Conflict of interest statement

HD, BM, ME, AA, LK, PT No competing interests declared

Figures

Figure 1.
Figure 1.. Development of Ten-fold Robust Expansion Microscopy (TREx) gel recipe.
(A) Parameters of gel recipe families explored, including component concentrations and gelation temperature. Each family was characterized by keeping these conditions constant while systematically varying the crosslinker concentration. (B) Expansion factor (mean ± SD, n = 3) versus crosslinker concentration (log scale) for each gel recipe family without biological specimens. Line colors correspond to recipe families as in (A). Specific recipes are indicated with a filled purple dot (original expansion microscopy [ExM] recipe) and yellow dot (TREx). All recipe families were tested with crosslinker concentrations of 0, 10, 30, 100, 300, and 1000 µg/mL, plus an additional condition for family A with 1500 µg/mL, corresponding to the original ExM recipe. Only conditions in which gels formed are plotted. (C) Definition of gel deformation index. Example gels from recipe family A with high crosslinker and low deformation (top panel, 1.5 mg/mL), and low crosslinker and high deformation (middle panel, 300 µg/mL). Bottom panel: schematic illustrating deformation index measurement. (D) Deformation index (mean ± SD, n = 3) versus expansion factor for each gel recipe family without biological specimens, with line colors and dots corresponding to specific recipes as in (A) and (B). Horizontal gray lines indicate thresholds for gels with mechanical quality deemed perfect (deformation < 0.125) and acceptable (deformation < 0.25). Ideal recipes would occupy the lower-right quadrant, corresponding to high expansion and low deformability.
Figure 2.
Figure 2.. Ten-fold Robust Expansion Microscopy (TREx) in mouse brain tissue slices.
(A) Mouse brain tissue (cortex) expanded using TREx, stained for total protein content with BODPIY-FL NHS, and imaged by confocal microscopy. Displayed contrast is inverted to show dense stained regions as dark. Inset: zoom-in showing nuclear envelope with densely stained structures spanning the nuclear envelope, consistent with nuclear pore complexes. (B) Mouse brain tissue (cortex) stained with antibodies against Homer (magenta), Bassoon (yellow), VGAT (blue), and DAPI (gray), and expanded using TREx. (C) Volumetrically rendered zoom-in of white box in (A) showing paired Bassoon- and Homer-rich structures, consistent with excitatory synapses. Depending on the orientation, clear separation of Bassoon and Homer can be observed, as well as a complex, structured presynaptic vesicle pool marked by VGAT bearing several release sites marked by Bassoon. (D) Quantification of Bassoon and Homer separation (mean ± SD plotted, n = 538 synapses, one replicate). Scale bars (corrected to indicate pre-expansion dimensions): main ~2 µm, zooms ~400 nm.
Figure 2—figure supplement 1.
Figure 2—figure supplement 1.. Comparison of anchoring and disruption conditions.
(A) Mouse brain tissue samples anchored with varying amounts of acryloyl-X SE (AcX), stained with NHS ester dye and disrupted with two methods: proteinase K diluted 1:1000 into phosphate buffered saline (PBS) and applied at room temperature (top row) or denaturing disruption buffer applied at 80°C (bottom row) for 3 hr. AcX was diluted from a 10 g/L stock to 200, 100, 50, 20, and 0 mg/L (from left to right) into PBS and applied for 1 hr. (B) Additional zooms of 3D volume in Figure 2B showing correlation in excitatory synapses between Homer and Bassoon. Line plots depict peak normalized intensity of example synapses. Scale bars (corrected to indicate pre-expansion dimensions): (A) ~ 1 mm; (B) 300 nm.
Figure 3.
Figure 3.. Characterization of expansion isotropy using Ten-fold Robust Expansion Microscopy (TREx).
(A) U2OS knock-in cells with homozygous NUP96-GFP, amplified with anti-GFP antibodies. (B) One nucleus from boxed region of (A), imaged by confocal microscopy after TREx. (C) High-resolution view of several nuclear pores from boxed region (1) of panel (B), showing both anti-GFP (magenta) and anti-NUP153 (endogenous nuclear pore protein, cyan) staining. (D) High-resolution view of several nuclear pores from boxed region (2) of panel (B) (top). Distribution of diameters of individual nuclear pores (bottom), corrected for the macroscopic expansion factor of 9.5×. N = 60 nuclear pore complexes (NPCs) from three spatially separated cells. (E) U2OS cells stained for clathrin heavy chain and tubulin, representative line scan over clathrin-coated pit (CCP) showing central null. (F) Quantification of CCP diameter. Plotted mean ± SD (1.16 ± 0.2 µm) of 25 CCPs from five cells (two independent experiments). (G) High-resolution view of microtubules in extracted COS7 cell and corresponding line scans with mean peak-to-peak distance indicated. (H) Maximum projection of pre-expansion 3D gSTED acquisition (left) and maximum projection of tilescan acquisition (42 tiles, post-expansion size ~750 × 650 µm) of the same cell post-expansion (right). (I) Post-expansion single field of view, as indicated with magenta box in (D), aligned with the pre-expansion image (gray) by similarity transformation (cyan) or thin plate spline elastic transformation (orange). Right shows overlay of similarity and elastic transformation to illustrate local deformations. (J) Quantification of measurement errors of the stitched dataset due to nonuniform expansion. Mean error for a given measurement length (black line) ± SD (shaded region). The residual elastic deformation field is shown below. Scale bars (corrected to indicate pre-expansion dimensions): (A) 50 µm, (B) ~1 µm, (C) ~100 nm, (D) ~200 nm, (E) (overview) ~1 µm, zooms (E) and (G) ~500 nm, (H) ~10 µm, (J) ~5 µm.
Figure 4.
Figure 4.. Ten-fold Robust Expansion Microscopy (TREx) can be used to visualize the ultrastructure of cellular membranes.
(A) Volumetric render of Jurkat T cell activated on anti-CD3-coated coverslip fixed and stained using mCLING. Colored clipping planes indicate portion clipped out to reveal intracellular detail. (B) Immunological synapse of activated T cell in (A) revealing organelle clustering at the immunological synapse. Below: mitochondria segmented using the trainable Weka segmentation algorithm indicated in magenta. (C) Representative example of mitochondrion in T cells visualized with mCLING. Line profile along the orange dashed line indicates mitochondrial cristae. (D) Depth-coded volumetric projection of Caco2 monolayer apical brush border as seen from above looking down on the cells. (E) Representative plane below the apical surface revealing highly interdigitated cell-cell contacts. (F) Resliced (left) representative zoom (right) of brush border showing microvilli as hollow protrusions. Line scan indicated in orange. (G) Comparison of dense brush borders after 10-fold expansion in water (left) and ~4.5× expansion in 13 mM salt (right, see Figure 4—figure supplement 1). Single plane of brush border and plane of same cell below the apical surface shown in cyan. Zooms 1 and 2 correspond to areas of the same size corrected for the expansion factor to illustrate the increase in resolution of tenfold expansion. (H) Quantification of microvilli diameter by determining the area of cross-sectioned (left). Plotted mean ± SD (107.7 ± 16.1 nm) of 12,339 microvili with means of individual cells color coded per replicate overlayed (four cells per replicate, N = 3). Scale bars (corrected to indicate pre-expansion dimensions): (A, B, D, E) (main) ~2 µm, (C, E) (zoom), (F) ~ 500 nm, (G, H) ~ 1 µm.
Figure 4—figure supplement 1.
Figure 4—figure supplement 1.. Expansion factor versus ionic strength.
(A) Expansion factor of Ten-fold Robust Expansion Microscopy (TREx) gel without biological sample as a function of ionic strength. Black dots are measured values with mM total salt being derived from dilutions of phosphate buffered saline (PBS) (factor 1, 0.5, 0.1, 0.02 of PBS). The magenta dot represents 10× expansion in water in equilibrium with atmospheric CO2. Assuming each H+ corresponds to one HCO3- ion, the measured pH of water in equilibrium with room air of 6 implies an ionic strength of 10–6, or 1 µM.
Figure 5.
Figure 5.. Ten-fold Robust Expansion Microscopy (TREx) microscopy can combine antibody-based staining with NHS ester total protein stain to provide subcellular context.
(A) Single and merged planes of expanded U2OS cell stained for mCLING, tubulin, and DAPI; gray outlined insets show similar confocal and 3D STED acquisitions pre-expansion, for mCLING and tubulin, respectively. Single planes of mCLING and tubulin are displayed in inverted contrast. Orange line (1, 2) corresponds to reslices (left) with insets showing similar resliced planes pre-expansion. (B) U2OS cell expressing GFP-Sec61β stained for mCLING, GFP, and tubulin (tubulin channel not shown). (C) Quantification of endoplasmic reticulum (ER) tubule diameter of both mCLING and GFP-Sec61β channels. Plotted mean ± SD (787.7 ± 0.09 nm for mCLING and 925.5 ± 0.13 nm for GFP-Sec61β) full width at half maximum (FWHM) of 10 line scans over ER tubules positive for both mCLING and GFP-Sec61β from four cells (two independent experiments). Below: representative line scan of region indicated by (3) shown. (D) Left: volumetric render of cell in (B). Top portion of cell is clipped with clipping plane indicated in red. Volumetric render of entire volume for GFP and tubulin in inset (A) and (B), respectively. Middle: zoomed region of top of cell (indicated by box 2 in B). Right: single channels from middle panel displayed in inverted contrast revealing the tight spatial organization. (E) Merged plane of expanded U2OS cell expressing GFP-Sec61β stained for mCLING, GFP, NHS ester, and DAPI. Single planes of mCLING and NHS ester are displayed in inverted contrast. Scale bars (corrected to indicate pre-expansion dimensions): (A) (main) ~5 µm, (D) (renders) ~2 µm, (A) (reslices), (B) (single planes), (D) (single planes), (E) ~ 1 µm.
Author response image 1.
Author response image 1.. Quantification of gel deformation over long distances.
(A) Cultured U2OS cells just after gelation and (B) after full expansion, with an FFT-based short pass filter applied to reduce variation in illumination across imaging fields. (C) Map of distortions across the entire gel. (D) Average measurement error across the entire gel (mean ± SD in blue) and (E) measurement error (mean) of 1,000-pixel square areas indicated by colored boxes in (C) at increasing distances away from the free gel edge. Scale bars: (A) 1 mm, (B) 10 mm (post-expansion), (C) 1 mm (pre-expansion).

References

    1. Arganda-Carreras I, Kaynig V, Rueden C, Eliceiri KW, Schindelin J, Cardona A, Sebastian Seung H. Trainable weka segmentation: a machine learning tool for microscopy pixel classification. Bioinformatics. 2017;33:2424–2426. doi: 10.1093/bioinformatics/btx180. - DOI - PubMed
    1. Bates M, Huang B, Dempsey GT, Zhuang X. Multicolor super-resolution imaging with photo-switchable fluorescent probes. Science. 2007;317:1749–1753. doi: 10.1126/science.1146598. - DOI - PMC - PubMed
    1. Berg S, Kutra D, Kroeger T, Straehle CN, Kausler BX, Haubold C, Schiegg M, Ales J, Beier T, Rudy M, Eren K, Cervantes JI, Xu B, Beuttenmueller F, Wolny A, Zhang C, Koethe U, Hamprecht FA, Kreshuk A. ilastik: interactive machine learning for (bio)image analysis. Nature Methods. 2019;16:1226–1232. doi: 10.1038/s41592-019-0582-9. - DOI - PubMed
    1. Bogovic JA, Hanslovsky P, Wong A, Saalfeld S. 2016 IEEE 13th International Symposium on Biomedical Imaging (ISBI 2016). Robust registration of calcium images by learned contrast synthesis; 2016. - DOI
    1. Chang JB, Chen F, Yoon YG, Jung EE, Babcock H, Kang JS, Asano S, Suk HJ, Pak N, Tillberg PW, Wassie AT, Cai D, Boyden ES. Iterative expansion microscopy. Nature Methods. 2017;14:593–599. doi: 10.1038/nmeth.4261. - DOI - PMC - PubMed

Publication types