

The Polarity and Specificity of Antiviral T Lymphocyte Responses Determine Susceptibility to SARS-CoV-2 Infection in Patients with Cancer and Healthy Individuals
- PMID: 35179201
- PMCID: PMC9394394
- DOI: 10.1158/2159-8290.CD-21-1441
The Polarity and Specificity of Antiviral T Lymphocyte Responses Determine Susceptibility to SARS-CoV-2 Infection in Patients with Cancer and Healthy Individuals
Abstract
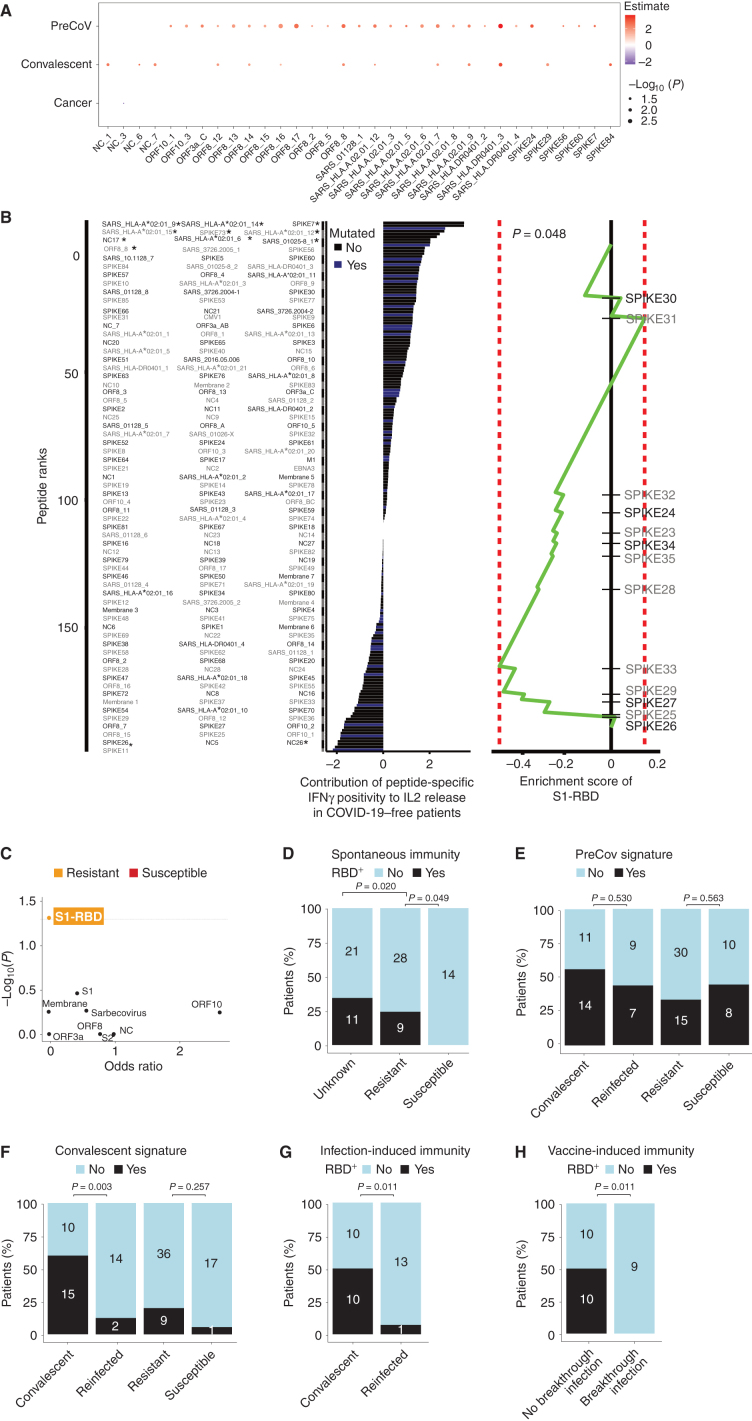
Vaccination against coronavirus disease 2019 (COVID-19) relies on the in-depth understanding of protective immune responses to severe acute respiratory syndrome coronavirus-2 (SARS-CoV-2). We characterized the polarity and specificity of memory T cells directed against SARS-CoV-2 viral lysates and peptides to determine correlates with spontaneous, virus-elicited, or vaccine-induced protection against COVID-19 in disease-free and cancer-bearing individuals. A disbalance between type 1 and 2 cytokine release was associated with high susceptibility to COVID-19. Individuals susceptible to infection exhibited a specific deficit in the T helper 1/T cytotoxic 1 (Th1/Tc1) peptide repertoire affecting the receptor binding domain of the spike protein (S1-RBD), a hotspot of viral mutations. Current vaccines triggered Th1/Tc1 responses in only a fraction of all subject categories, more effectively against the original sequence of S1-RBD than that from viral variants. We speculate that the next generation of vaccines should elicit Th1/Tc1 T-cell responses against the S1-RBD domain of emerging viral variants.
Significance: This study prospectively analyzed virus-specific T-cell correlates of protection against COVID-19 in healthy and cancer-bearing individuals. A disbalance between Th1/Th2 recall responses conferred susceptibility to COVID-19 in both populations, coinciding with selective defects in Th1 recognition of the receptor binding domain of spike. See related commentary by McGary and Vardhana, p. 892. This article is highlighted in the In This Issue feature, p. 873.
©2022 The Authors; Published by the American Association for Cancer Research.
Figures
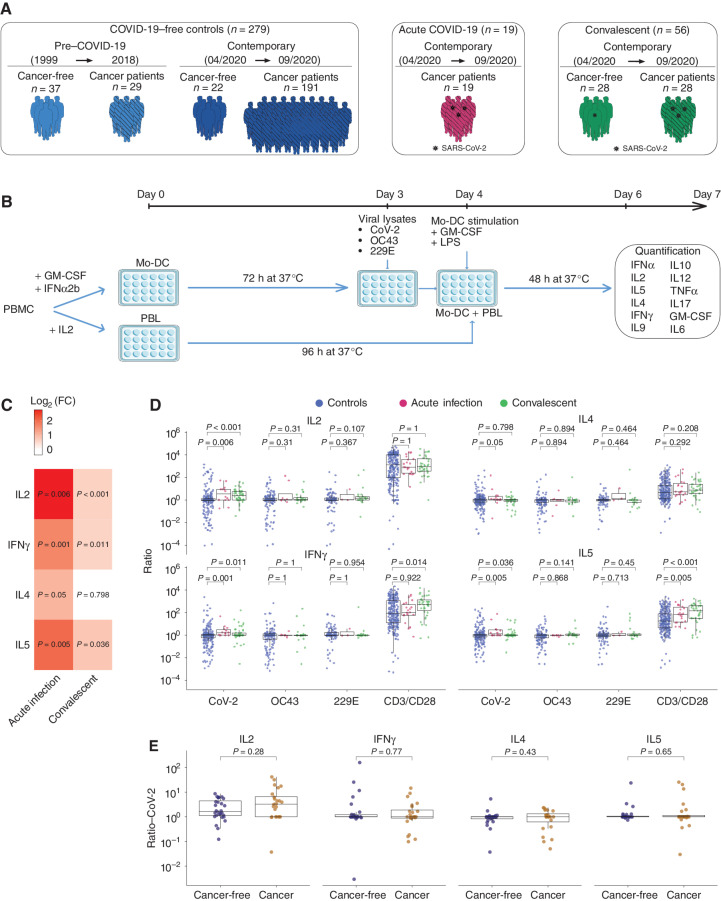
![Figure 2. Unexposed individuals susceptible to COVID-19 exhibited a SARS-CoV-2–specific Th2 profile during the first surge of the pandemic. A, Percentage and number of patients in each cohort—pre–COVID-19 era [yes (+)/no(−)], cancer [yes (+)/no(−)], and COVID-19 [yes (+)/no(−)]—who had a SARS-CoV-2–specific cytokine release (for the prototypic cytokines) compared with VeroE6 (control, n = 279; convalescent, n = 56; Supplementary Table S1B). Fisher exact test to compare the number of cytokine-positive patients across groups. B, Outline of the prospective collection of blood samples used to identify COVID-19–resistant (yellow) versus susceptible (red) patients with cancer (B, top; Supplementary Table S2A and S2B). Bottom, outline of the prospective collection of blood samples used for the comparison of T-cell responses in the cohort of cancer-free individuals who lived in the same household with family members who tested positive for COVID-19 during the 2020 lockdown (G and I). Pie chart (C) indicating the absolute numbers (and percentage) of patients reported as contact (resistant) or infected (susceptible) or unexposed (green) during 1-year follow-up (D). Number of positive cytokines released by SARS-CoV-2–specific PBLs during the cross-presentation assay (Fig. 1B and C) in each group (unexposed, n = 153; resistant, n = 42; susceptible, n = 19). E and F, SARS-CoV-2–specific IL2 (left) and IL5 (right) secretion contrasting resistant (yellow) versus infected (red) cancer cases. E, Each dot represents the ratio of the replicate wells in one individual, and the box plots indicate medians as well as 25th and 75th percentiles for each cancer patient subset. F, The bar plots represent the percentage of positive patients (resistant, n = 42; susceptible, n = 19). Fisher exact test to compare the number of cytokine-positive patients across groups. G and H, SARS-CoV-2–specific IL2/IL5 ratios (means ± SEM) in the different subsets of healthy individuals and patients with cancer presented in B. Refer to Supplementary Fig. S3A for the waterfall plots to visualize variations in the percentages of individuals with IL2/IL5 ratios > or < 1 according to subject category. All group comparisons were performed using the two-sided Wilcoxon–Mann–Whitney test, and P < 0.05 indicates statistically significant differences. I and J, Validation cohort investigating eight additional HCW from Hospices Civils de Lyon and 10 patients with cancer from Gustave Roussy investigated in cross-presentation assays with the dual-color IFNγ/IL5 ELISpot. I, Prototypic photograph of IFNγ and IL5 dual-color ImmunoSpot of a DC/SARS-CoV-2 or VeroE6 PBL coculture (or OKT3 as positive control) for one representative resistant (left) and susceptible (right) HCW. SFC, spot-forming colony counted per 105 PBLs. J, Percentages of SARS-CoV-2–specific Th1 or Th2 cell responses determined by dual ELISPOT assay (CoV-2/VeroE6 >1.5 increase in IFNγ+ (left) or IL5+ (middle) SFC, respectively. Calculation of the IFNγ+/IL5+ SFC ratio per individual in VeroE6 or SARS-CoV-2 condition, and percentages of patients with an increased (>2×) ratio in the SARS-CoV-2 condition, in both resistant versus susceptible groups (right). Fisher exact test to compare the number of positive patients between both groups.](https://cdn.ncbi.nlm.nih.gov/pmc/blobs/bb56/9394394/2af58aa6432e/958fig2.jpg)
![Figure 3. Peptide repertoire breadth does not predict resistance to COVID-19. A, Experimental setting for the 187 peptide-based in vitro stimulation assay. B, Bicolor map of peptide recognition (positive in salmon, negative in purple, not determined in gray). Patients (n = 148) were ordered in columns by unsupervised hierarchical clustering, and peptides were ordered in rows according to the 5′ to 3′ sequence location in the ORFeome with a distinct color code for each protein. SARS-CoV-1 peptides are aligned at the end in gray. The upper line indicates the frequency of positive individuals for each peptide in the 187 peptide list. C, Peptide frequencies within unexposed and convalescent (with history of COVID-19) patients with cancer compared with unexposed cancer-free subjects. Also refer to Fig. 4A. D and E, Percentages of positive peptides in individuals from the pre–COVID-19 era (n = 24) versus contemporary controls (n = 97; D, right) and in cancer (n = 111) versus cancer-free contemporary individuals (n = 10; D, left) and in uninfected [control (contemporary), n = 97] versus convalescent (n = 27; E, left) and resistant individuals (noninfected contact cases, n = 44) versus susceptible (infected, n = 18) individuals (E, right). Group comparisons within D and E were performed using the two-sided Wilcoxon–Mann–Whitney test.](https://cdn.ncbi.nlm.nih.gov/pmc/blobs/bb56/9394394/b6e32e2836d9/958fig3.jpg)
![Figure 5. Patients with cancer (except hematologic malignancies) could mount S1-RBD–specific Th1/Tc1 immune responses during the prime–boost vaccination rollout. A, Description of cohorts of vaccinees in cancer-free individuals and patients with cancer (refer to Supplementary Table S10; Table 1). B, Experimental setting for the peptide pool–based ex vivo stimulation assays. C, Amino acid sequence coverage of the three peptide pools utilized in the high-throughput T-cell screening assay (refer to Supplementary Table S11). D and E, High-throughput screening T-cell assay using the ELISA technique in an automatic platform monitoring IFNγ levels in whole-blood samples from several independent cohorts of HCW (D) or patients with cancer [E, solid or hematologic malignancies (hemato cancer)] with (D) or without (D and E) COVID-19 history, pre- and/or per (after 1 immunization, day 21) and/or post-vaccination (day 90, day 180 for D; only after two shots of vaccines for E) using different peptide pools (C). Monitoring of IFNγ release (bottom) and percentages of individuals with IFNγ levels greater than the threshold of detection (top). The standard errors have been computed with their confidence intervals for these estimates, with each interval most probably containing the genuine percentage. F, Forest plot depicting the impact of the each covariate on the PEPwtRBD IFNγ secretion levels (refer to Table 1 for statistics). Specimens were not systematically paired in the kinetic study. The log10-normalized IFNγ secretions for all peptide stimulation were pooled to model simultaneously their dynamics from the first vaccine to day 180 using linear mixed-effect regression adjusted for patient age, sex, cancer status, type of cancer, COVID history, and vaccine schedule. G, Spearman correlation between serum S1-RBD–specific IgG titers (expressed in arbitrary units) and IFNγ release in the VIDAS IFNγ RUO platform in all cancer-free (left) and cancer vaccinees (right) monitored in Fig. 5D. Each dot represents one sample at one time point. Most individuals have been drawn only once at any time point. H, Percentages and absolute numbers of mutations contained in our S1-RBD peptide list reported in the current SARS-CoV-2 variants (refer to Supplementary Table S12). The difference of the probability of mutation in the S1-RBD region and in other regions was evaluated using logistic regression (odds ratio = 0.21; 95% confidence interval, 0.06–0.68; P = 0.01). I, Paired analysis of the differential magnitude of Th1/Tc1 reactivity against PEPwtRBD versus PEPmutRBD in 343 cancer-free vaccinees with no history of COVID-19. Each line represents one patient sample. Group comparisons were performed using the two-sided paired Wilcoxon–Mann–Whitney test.](https://cdn.ncbi.nlm.nih.gov/pmc/blobs/bb56/9394394/c39b7c788736/958fig5.jpg)
Comment in
-
Vive la Résistance: T-cell Immunity in the Protection against SARS-CoV-2 Infection.Cancer Discov. 2022 Apr 1;12(4):892-894. doi: 10.1158/2159-8290.CD-22-0080. Cancer Discov. 2022. PMID: 35373282
References
Publication types
MeSH terms
Substances
LinkOut - more resources
Full Text Sources
Other Literature Sources
Medical
Miscellaneous
