. 2022 Mar;42(3):223-244.
doi: 10.1002/cac2.12273. Epub 2022 Feb 18.

Aberrant translation regulated by METTL1/WDR4-mediated tRNA N7-methylguanosine modification drives head and neck squamous cell carcinoma progression

Affiliations

Aberrant translation regulated by METTL1/WDR4-mediated tRNA N7-methylguanosine modification drives head and neck squamous cell carcinoma progression

Jie Chen et al. Cancer Commun (Lond). 2022 Mar.

Abstract

Background: Cancer cells selectively promote the translation of oncogenic transcripts to stimulate cancer progression. Although growing evidence has revealed that tRNA modifications and related genes participate in this process, their roles in head and neck squamous cell carcinoma (HNSCC) remain largely uncharacterized. Here, we sought to investigate the function and mechanisms of the transfer RNA (tRNA) N7-methylguanosine (m7 G) modification in regulating the occurrence and development of HNSCC.

Methods: Cell lost-of-function and gain-of-function assays, xenograft models, conditional knockout and knockin mouse models were used to study the physiological functions of tRNA m7 G modification in HNSCC tumorigenesis. tRNA modification and expression profiling, mRNA translation profiling and rescue assays were performed to uncover the underlying molecular mechanisms. Single-cell RNA sequencing (scRNA-seq) was conducted to explore the tumor microenvironment changes.

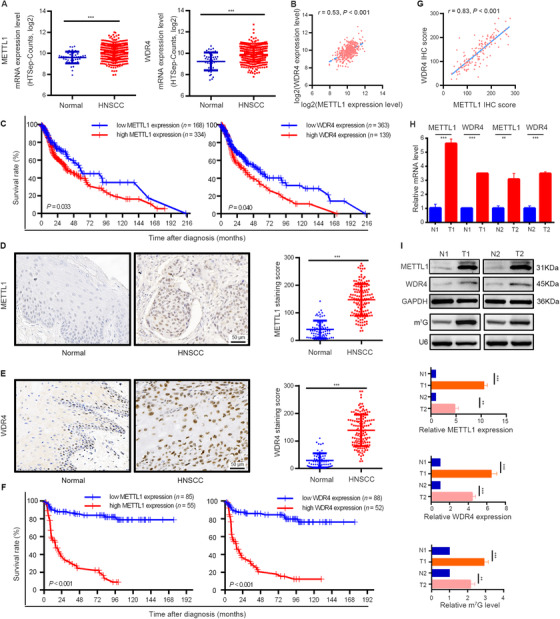
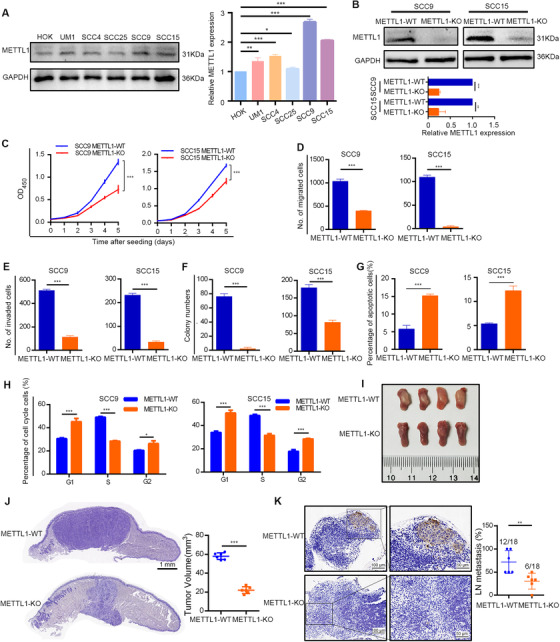
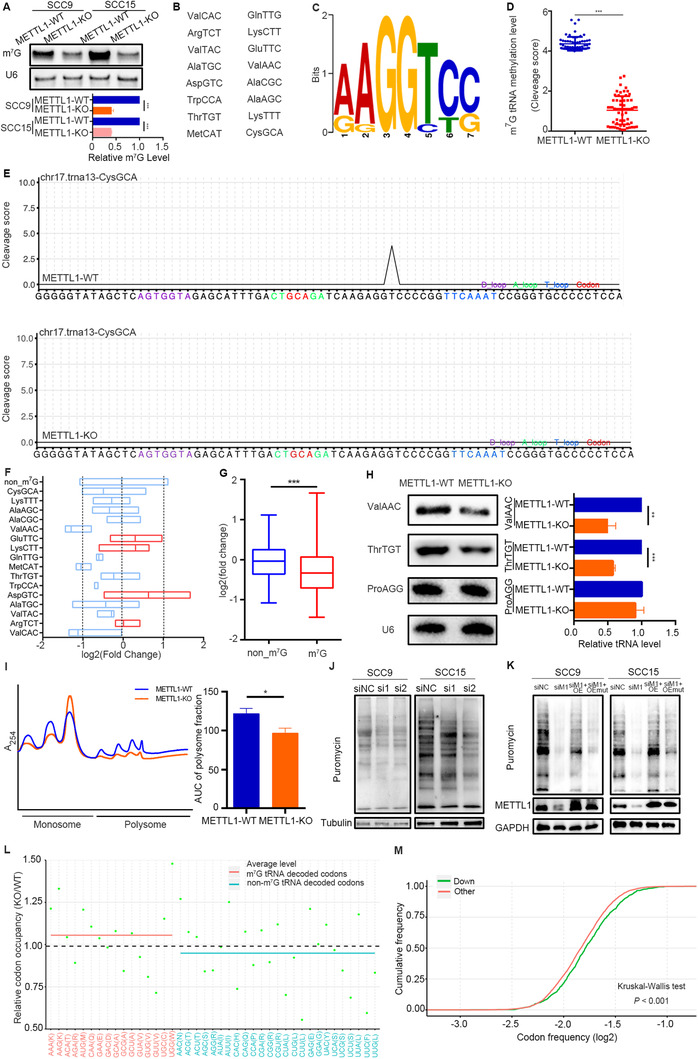
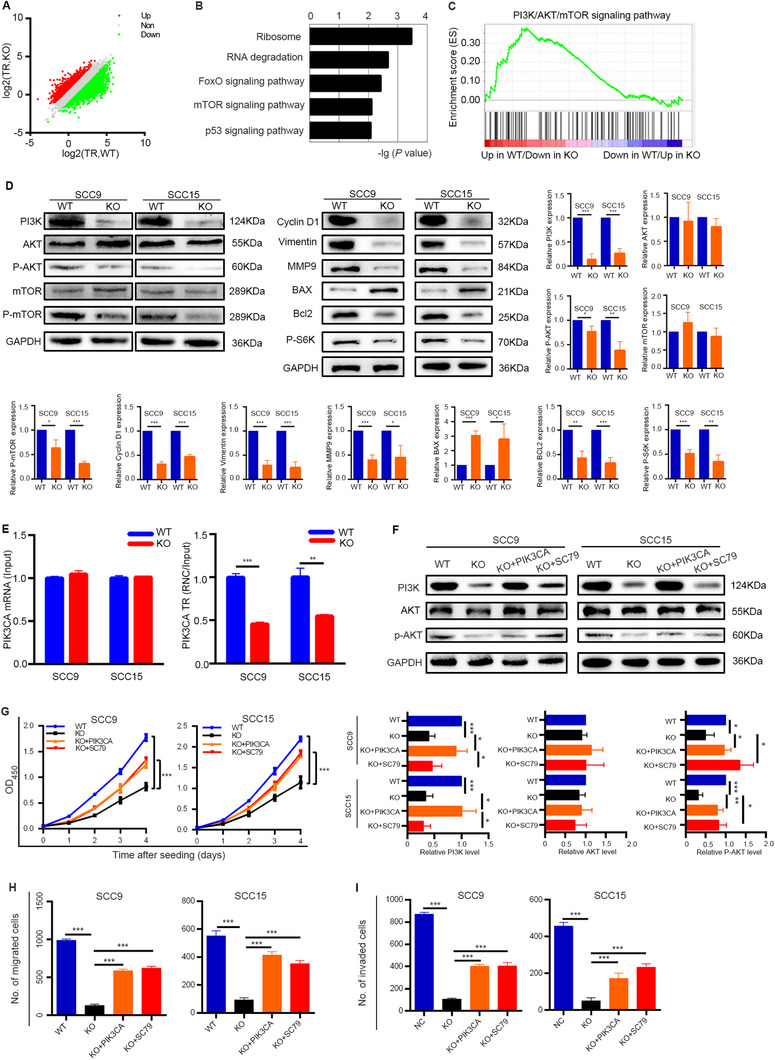
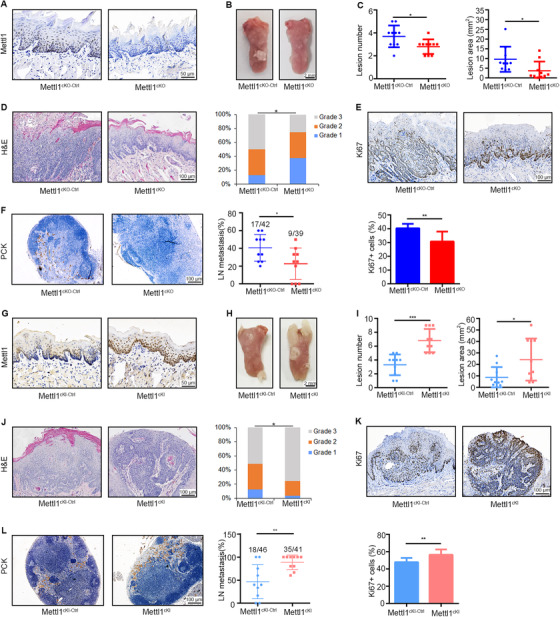
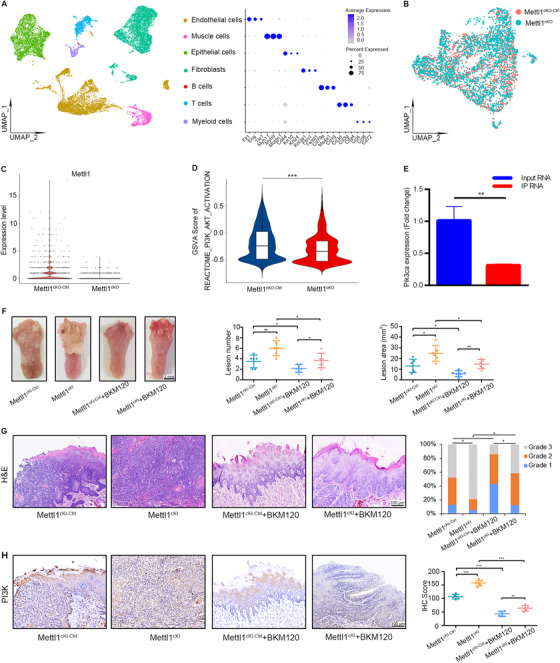
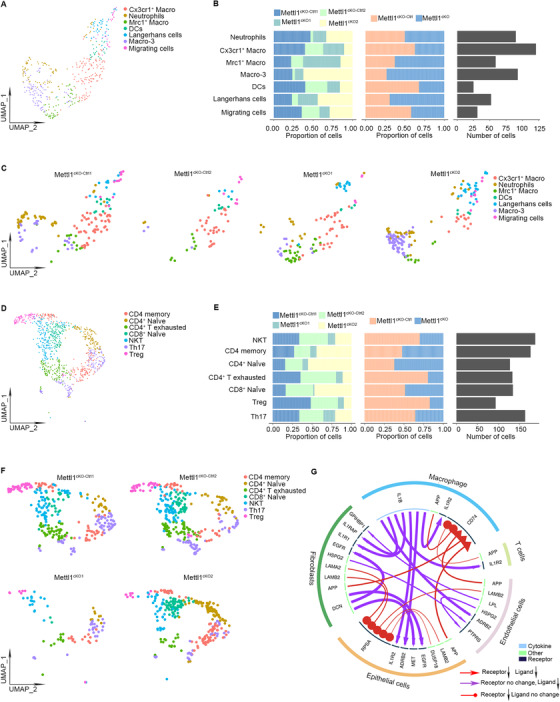
Results: The tRNA m7 G methyltransferase complex components Methyltransferase-like 1 (METTL1)/WD repeat domain 4 (WDR4) were upregulated in HNSCC and associated with a poor prognosis. Functionally, METTL1/WDR4 promoted HNSCC progression and metastasis in cell-based and transgenic mouse models. Mechanistically, ablation of METTL1 reduced the m7 G levels of 16 tRNAs, inhibiting the translation of a subset of oncogenic transcripts, including genes related to the phosphatidylinositol-3-kinase/protein kinase B/mammalian target of rapamycin (PI3K/AKT/mTOR) signaling pathway. In addition, chemical modulators of the PI3K/Akt/mTOR signaling pathway reversed the effects of Mettl1 in mouse HNSCC. Furthermore, scRNA-seq results revealed that Mettl1 knockout in mouse tumor cells altered the immune landscape and cell-cell interaction between the tumor and stromal compartment.

Conclusions: The tRNA m7 G methyltransferase METTL1 was found to promote the development and malignancy of HNSCC through regulating global mRNA translation, including the PI3K/AKT/mTOR signaling pathway, and found to alter immune landscape. METTL1 could be a promising treatment target for HNSCC patients.

Keywords: METTL1; PI3K/AKT/mTOR signaling; WDR4; head and neck squamous cell carcinoma; m7G modification; metastasis; microenvironment; scRNA-seq; tRNA.


Conflict of interest statement

The authors have declared that no conflict of interest exists.

Figures

FIGURE 1
FIGURE 1
METTL1 and WDR4 are upregulated and associated with poor prognosis of HNSCC patients. (A) TCGA data showed that METTL1 (left) and WDR4 (right) were significantly upregulated in HNSCC tissues (n = 502) as compared with normal tissues (n = 44). (B) The correlation between METTL1 and WDR4 levels in HNSCC tissues using TCGA data. (C) Kaplan‐Meier curves of overall survival based on METTL1 (left) and WDR4 (right) levels in HNSCC tissues from TCGA data. (D) Representative images of IHC staining for METTL1 (left) and quantification (right) between 140 HNSCC tissue samples and 69 normal tissue samples. (E) Representative images of IHC staining for WDR4 (left) and quantification (right) between 140 HNSCC tissue samples and 69 normal tissue samples. (F) Kaplan‐Meier curves of overall survival based on METTL1 (left) and WDR4 (right) levels in HNSCC patients from our cohort. (G) The correlation between METTL1 and WDR4 levels in HNSCC patients from our cohort. (H,I) The mRNA levels and protein levels of METTL1 and WDR4 and m7G tRNA modification were upregulated in human HNSCC specimens examined by qRT‐PCR (H), Western blotting and Northwestern blotting (I). T1/T2 and N1/N2 represented tumor tissues and surrounding normal mucosal tissues from two HNSCC patients, respectively. Data are presented as the mean ± SD and analyzed by Student's t‐test, log rank test, or Pearson's correlation test. **, P < 0.01, ***, P < 0.001. Abbreviations: METTL1: Methyltransferase‐like 1; WDR4: WD repeat domain 4; HNSCC: head and neck squamous cell carcinoma; TCGA: the Cancer Genome Atlas; IHC: immunohistochemistry; m7G: N7‐methylguanosine; qRT‐PCR: quantitative real‐time PCR
FIGURE 2
FIGURE 2
METTL1 is required for HNSCC progression both in vitro and in vivo. (A) Western blotting of METTL1 protein expression in HNSCC cell lines and HOK cells. (B) The effects of METTL1 knockout in SCC9 and SCC15 cells were verified by Western blotting. (C‐H) METTL1 knockout reduced the proliferation ability (C), restrained the migration (D), invasion (E) and colony formation (F), and promoted the apoptosis (G) and G1‐phase retention (H) of HNSCC cells. I. Representative images of mouse tongues from the orthotopic transplantation model. J. Representative H&E staining (left) and tumor volume (right) of METTL1‐WT and METTL1‐KO cell xenografts (n = 6). (K) Representative IHC staining (left) for PCK and LN metastasis percentage (right; the number of metastasis LN of the total LN) of METTL1‐WT and METTL1‐KO cells in xenografts. Data are presented as the mean ± SD and analyzed by Student's t‐test. *, P < 0.05, **, P < 0.01, ***, P < 0.001. Abbreviations: METTL1: Methyltransferase‐like 1 (METTL1); HOK: human oral keratinocytes; WT: wild‐type; KO: knockout; PCK: pan‐cytokeratin; LN: lymph node; IHC: immunohistochemistry; SD: standard deviation
FIGURE 3
FIGURE 3
METTL1‐mediated m7G tRNA modification regulates tRNA expression and mRNA translation in HNSCC. (A) Northwestern blotting of m7G modification in tRNAs from METTL1‐WT and METTL1‐KO SCC9 and SCC15 cells. (B) List of m7G‐modified tRNAs identified by TRAC‐seq in SCC15 cells. (C) Sequence motif in the m7G sites identified by TRAC‐seq in SCC15 cells. (D) Quantitative comparison of cleavage scores between METTL1‐WT and METTL1‐KO SCC15 cells. (E) Representative images showing the cleavage score of identified tRNAs at the motif site from different groups (METTL1‐WT, top; METTL1‐KO, bottom). (F) Expression profile of the 16 m7G‐modified tRNAs. Each boxplot shows the expression of a tRNA type that was calculated from the combined expression of all tRNA genes for the same tRNA type. (G) Quantitative comparison of the fold change in expression between m7G‐modified and non‐m7G‐modified tRNAs. (H) Validation of the expression of representative m7G‐modified tRNAs by Northern blotting using the indicated tRNA probes. ProAGG (non‐m7G‐modified tRNA) and U6 snoRNA were used as loading controls. (I) Polysome profiling of METTL1‐WT and METTL1‐KO SCC15 cells. (J) Puromycin uptake assay of METTL1 knockout using two independent siRNAs. Total protein samples were examined by Western blotting using an anti‐puromycin antibody. (K) Puromycin uptake assay of METTL1‐KO cells transfected with wild‐type overexpression or catalytic inactive METTL1 plasmids. (L) Change in ribosome occupancy at A sites in METTL1‐KO cells compared to METTL1‐WT SCC15 cells. Only codons detected in both TRAC‐seq and Ribo‐Seq are shown. The average relative occupancy ratio of codons decoded by m7G tRNAs (pink) and codons decoded by non‐m7G tRNAs (blue) are presented. (M) Codon frequency in the CDS region of genes with decreased TE (down) and other genes. Data are presented as the mean ± SD and analyzed by Student's t‐test or Kruskal‐Wallis test. *, P < 0.05, **, P < 0.01, ***, P < 0.001. Abbreviations: m7G: N7‐methylguanosine; WT: wild‐type; KO: knockout; METTL1: Methyltransferase‐like 1; TRAC‐seq: m7G site‐specific tRNA reduction and cleavage‐sequencing; snoRNA: small nucleolar RNA; siRNAs: small interfering RNAs; siNC, negative control siRNA; si1, siMETTL1‐1; si2, siMETTL1‐2; OE, wild‐type METTL1 overexpression; OEmut, catalytically inactive METTL1; Ribo‐Seq: ribosome sequencing; TE: translation efficiency; CDS: sequence coding for amino acids in protein; SD: standard deviation
FIGURE 4
FIGURE 4
METTL1‐mediated m7G tRNA modification regulates the activity of the PI3K/AKT/mTOR signaling pathway. (A) Scatterplot of the TRs in METTL1‐WT and METTL1‐KO SCC15 cells. TRs were calculated by dividing the ribosome‐binding transcript signals by input RNA‐seq signals. (B) KEGG pathway analysis of the genes with decreased TRs upon METTL1 knockout. (C) The PI3K/AKT/mTOR signaling pathway was enriched in RNC‐seq datasets by GSEA (NES = 1.64, FDR = 0.165, P < 0.001). (D) Western blotting of PI3K/AKT/mTOR signaling pathway proteins and downstream proteins using the indicated antibodies. (E) qRT‐PCR analysis of PIK3CA with RNC and input samples in SCC9 and SCC15 cells. (F) The protein levels of PI3K, AKT, and p‐AKT in METTL1‐WT, METTL1‐KO, PI3K‐transfected METTL1‐KO cells (KO + PIK3CA) and 5 μg/mL SC79‐treated METTL1‐KO cells cultured with (KO + SC79). (G‐I) The proliferation (G), migration (H) and invasion abilities (I) were partially restored after transfecting METTL1‐KO cells with the PI3K plasmid or activating AKT. Data are presented as the mean ± SD and analyzed by Student's t‐test. *, P < 0.05, **, P < 0.01, ***, P < 0.001. Abbreviations: PI3K/AKT/mTOR: phosphatidylinositol‐3‐kinase/protein kinase B/mammalian target of rapamycin; METTL1: Methyltransferase‐like 1; WT: wild‐type; KO: knockout; TRs: translation ratios; KEGG: Koto Encyclopedia of Genes and Genomes; GSEA: gene set enrichment analysis; NES: normalized enrichment score; FDR: false discovery rate; qRT‐PCR: quantitative real‐time PCR; RNC: Ribosome nascent‐chain complex‐bound; MMP9: matrix metalloprotein 9; Bcl‐2: B‐cell lymphoma‐2; P‐S6K: phosphorylation of S6 kinase; BAX: Bcl‐2‐associated X protein; PIK3CA: phosphatidylinositol‐4,5‐bisphosphate 3‐kinase, catalytic subunit alpha; SD: standard deviation
FIGURE 5
FIGURE 5
A transgenic mouse model verifies that Mettl1 is required for HNSCC carcinogenesis and metastasis. (A) IHC staining of Mettl1+ cells in tongue tissues from Mettl1cKO‐Ctrl and Mettl1cKO mice. (B) Representative images of tongue lesions 28 weeks after 4NQO treatment in Mettl1cKO‐Ctrl and Mettl1cKO mice. (C) The number of lesions (left) and quantification of lesion areas (right) visible in the tongues of Mettl1cKO‐Ctrl and Mettl1cKO mice (n = 10). (D) Representative H&E staining of lesions (left) from Mettl1cKO‐Ctrl and Mettl1cKO mice. Quantification of histological grade of lesions in different groups (right). Grade 1, epithelium dysplasia; grade 2, carcinoma in situ; grade 3, invasive carcinoma. (E) Representative IHC staining (up) and quantification (bottom) of Ki67 in Mettl1cKO‐Ctrl and Mettl1cKO mice. (F) Representative IHC staining (left) and quantification (right) of lymph node metastasis rate (the proportion of metastasis lymph nodes in all lymph nodes) in Mettl1cKO‐Ctrl and Mettl1cKO mice. (G) IHC staining of Mettl1+ cells in tongue tissues from Mettl1cKI‐Ctrl and Mettl1cKI mice. (H) Representative images of tongue lesions from Mettl1cKI‐Ctrl and Mettl1cKI mice 28 weeks after 4NQO treatment. (I) The number of lesions (left) and quantification of lesion areas (right) visible in the tongue from Mettl1cKI‐Ctrl and Mettl1cKI mice (n = 10). (J) Representative H&E staining (left) of lesions from Mettl1cKI‐Ctrl and Mettl1cKI mice and quantification of histological grade of lesions (right) in different groups. (K) Representative IHC staining (up) and quantification (bottom) of Ki67 in Mettl1cKI‐Ctrl and Mettl1cKI mice. (L) Representative IHC staining (left) and quantification (right) of lymph node metastasis rate in Mettl1cKI‐Ctrl and Mettl1cKI mice. Data are presented as the mean ± SD and analyzed by Student's t test or Chi‐squared Test. *, P < 0.05, **, P < 0.01, ***, P < 0.001. Abbreviations: Mettl1: Methyltransferase‐like 1; Mettl1cKO‐Ctrl: K14CreER;Mettl1wt/wt mice; Mettl1cKO: K14CreER;Mettl1fl/fl mice; Mettl1cKI‐Ctrl: K14Cre;Mettl1wt/wt mice; Mettl1cKI: K14Cre;Mettl1KI/KI mice; IHC: immunohistochemistry; 4NQO: 4‐nitroquinoline N‐oxide; PCK, pan‐cytokeratin; LN, lymph node; SD: standard deviation
FIGURE 6
FIGURE 6
A transgenic mouse model verifies that Mettl1 regulates PI3K/Akt/mTOR activity in HNSCC. (A) UMAP of scRNA‐seq cells recovered from both Mettl1cKO‐Ctrl and Mettl1cKO mice labeled by cell type (left). Dot plot of selected subset‐associated genes across cell types from scRNA‐seq data (right). (B) UMAP of reclustered epithelial cells from Mettl1cKO‐Ctrl and Mettl1cKO mice. (C) Violin plots of the expression of the Mettl1 gene in epithelial cells from Mettl1cKO‐Ctrl and Mettl1cKO mice. (D) Violin plots of the GSVA results for epithelial cells revealed that PI3K/Akt activation was significantly decreased in Mettl1cKO HNSCC samples. (E) qRT‐PCR of Pik3ca expression (K14CreER;RiboTag;Mettl1fl/fl /K14CreER;RiboTag;Mettl1wt/wt ) in input RNA was normalized to that of Gapdh and the ratio of IP RNA. (F) Representative images (left) of tongue lesions from Mettl1cKI‐Ctrl and Mettl1cKI mice by oral gavage of BKM120 (Mettl1cKI‐Ctrl + BKM120 and Mettl1cKI + BKM120) compared with Mettl1cKI‐Ctrl and Mettl1cKI mice by oral gavage of buffer agent (Mettl1cKI‐Ctrl and Mettl1cKI). Quantification of the number of lesions (middle) and the lesion areas (right) visible in the tongue (n = 6). (G) Representative H&E staining of lesions (left) from Mettl1cKI‐Ctrl, Mettl1cKI, Mettl1cKI‐Ctrl + BKM120 and Mettl1cKI + BKM120 mice. Quantification of histological grade of lesions in different groups (right). (H) Representative IHC staining (left) and quantification (right) of PI3K in Mettl1cKI‐Ctrl, Mettl1cKI, Mettl1cKI‐Ctrl + BKM120 and Mettl1cKI + BKM120 mice. Data are presented as the mean ± SD and analyzed by Student's t‐test or Chi‐squared Test. *, P < 0.05, **, P < 0.01, ***, P < 0.001. Abbreviations: PI3K/Akt/mTOR: phosphatidylinositol‐3‐kinase/protein kinase B/mammalian target of rapamycin; Pik3ca: phosphatidylinositol‐4,5‐bisphosphate 3‐kinase, catalytic subunit alpha; Mettl1: Methyltransferase‐like 1; IHC: immunohistochemistry; IP: immunoprecipitation; UMAP: Uniform manifold approximation and projection; GSVA: gene set variation analysis; Mettl1cKO‐Ctrl: K14CreER;Mettl1wt/wt mice; Mettl1cKO: K14CreER;Mettl1fl/fl mice; Mettl1cKI‐Ctrl: K14Cre;Mettl1wt/wt mice; Mettl1cKI: K14Cre;Mettl1KI/KI mice; SD: standard deviation
FIGURE 7
FIGURE 7
scRNA‐seq analysis of tumor cell‐microenvironment crosstalk in HNSCC tumors after Mettl1 knockout. (A) UMAP of myeloid subsets, including neutrophils, Cx3cr1+ macrophages, Mrc1+ macrophages, Macro‐3, dendritic cells, Langerhans cells, and migrating cells, in Mettl1cKO‐Ctrl and Mettl1cKO mice. (B) Bar plots of the proportions of cell types and total cell number in Mettl1cKO‐Ctrl and Mettl1cKO mice. (C) UMAP of myeloid subsets of each sample. (D) UMAP of TIL subsets, including memory CD4 T cells, naïve CD4+ T cells, exhausted CD4+ T cells, naïve CD8+ T cells, NKT cells, Th17 cells, and Tregs, in Mettl1cKO‐Ctrl and Mettl1cKO mice. (E) Bar plots of the proportions of cell types and total cell number in Mettl1cKO‐Ctrl and Mettl1cKO mice. (F) UMAP of TIL subsets of each sample. (G) Circos plot showing significant crosstalk alterations between stromal cells and epithelial cell subclusters (Mettl1cKO vs. Mettl1cKO‐Ctrl). Abbreviations: Mettl1: Methyltransferase‐like 1; KO: knockout; TIL: tumor‐infiltrating lymphocytes; Mettl1cKO‐Ctrl: K14CreER;Mettl1wt/wt mice; Mettl1cKO: K14CreER;Mettl1fl/fl mice; Macro‐3: macrophage‐3; DCs: dendritic cells; UMAP: Uniform manifold approximation and projection

References

    1. Tan YT, Lin JF, Li T, Li JJ, Xu RH, Ju HQ. LncRNA‐mediated posttranslational modifications and reprogramming of energy metabolism in cancer. Cancer Commun (Lond). 2021;41(2):109‐20. - PMC - PubMed
    1. Janin M, Coll‐SanMartin L, Esteller M. Disruption of the RNA modifications that target the ribosome translation machinery in human cancer. Mol Cancer. 2020;19(1):70. - PMC - PubMed
    1. Ju H, Hu Z, Wei D, Huang J, Zhang X, Rui M, et al. A novel intronic circular RNA, circGNG7, inhibits head and neck squamous cell carcinoma progression by blocking the phosphorylation of heat shock protein 27 at Ser78 and Ser82. Cancer Commun (Lond). 2021;41(11):1152‐72. - PMC - PubMed
    1. Liu L, Wu Y, Li Q, Liang J, He Q, Zhao L, et al. METTL3 Promotes Tumorigenesis and Metastasis through BMI1 m6A Methylation in Oral Squamous Cell Carcinoma. Mol Ther. 2020;28(10):2177‐90. - PMC - PubMed
    1. Santos M, Fidalgo A, Varanda AS, Oliveira C, Santos MAS. tRNA Deregulation and Its Consequences in Cancer. Trends Mol Med. 2019;25(10):853‐65. - PubMed

Publication types

MeSH terms