. 2022 Feb 1;22(2):12.
doi: 10.1167/jov.22.2.12.

Matching convolved images to optically blurred images on the retina

Affiliations

Matching convolved images to optically blurred images on the retina

Sara Aissati et al. J Vis. .

Abstract

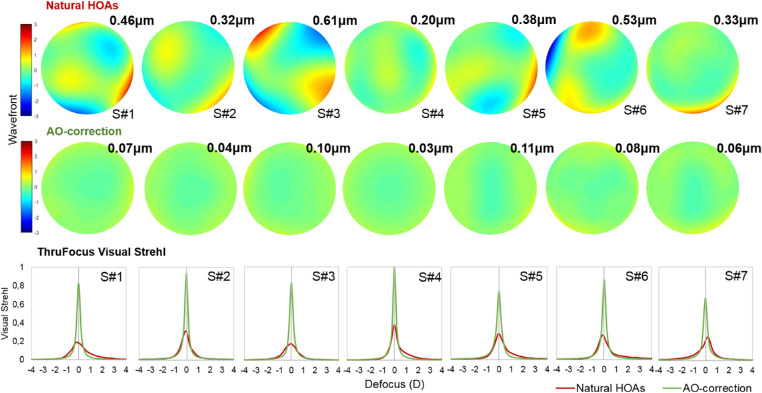
Convolved images are often used to simulate the effect of ocular aberrations on image quality, where the retinal image is simulated by convolving the stimulus with the point spread function derived from the subject's aberrations. However, some studies have shown that convolved images are perceived far more degraded than the same image blurred with optical defocus. We hypothesized that the positive interactions between the monochromatic and chromatic aberrations in the eye are lost in the convolution process. To test this hypothesis, we evaluated optical and visual quality with natural optics and with convolved images (on-bench, computer simulations, and visual acuity [VA] in subjects) using a polychromatic adaptive optics system with monochromatic (555 nm) and polychromatic light (WL) illumination. The subject's aberrations were measured using a Hartmann Shack system and were used to convolve the visual stimuli, using Fourier optics. The convolved images were seen through corrected optics. VA with convolved stimuli was lower than VA through natural aberrations, particularly in WL (by 26% in WL). Our results suggest that the systematic decrease in visual performance with visual acuity and retinal image quality by simulation with convolved stimuli appears to be primarily associated with a lack of favorable interaction between chromatic and monochromatic aberrations in the eye.


Figures

Figure 1.
Figure 1.
Illustration of the conditions tested computationally and in patients: (1) high-contrast E-letter degraded with a monochromatic (555 nm) or polychromatic (white) PSFs calculated from the subject's aberrations and (2) convolved E-letter degraded with diffraction-limited PSF both in monochromatic (555 nm) or polychromatic light.
Figure 2.
Figure 2.
Subject's optical quality. Top row: wave aberrations (third order and higher) under natural conditions, with the corresponding RMS value at the top. Central row: wave aberrations under closed-loop AO correction. Bottom row: through-focus visual Strehl for natural aberrations (red line) and best AO correction during visual acuity measurements (green line). Data are for 6-mm pupil size.
Figure 3.
Figure 3.
(A) Comparison of images of an E-letter (100 pixels, 0.33 degrees angular subtend) stimulus in optical simulations and captured with the CCD camera (at the retinal plane of an artificial eye). Column 1: high-contrast reference image (Ref). Column 2: computer-simulated image, calculated by convolution of the original image with the subject's aberrations and seen through diffraction-limited optics (Theory). Column 3: high-contrast image projected through an artificial eye with natural aberrations induced on a DM, in green light. Column 4: convolved image projected through diffraction-limited optics (Conv). Column 5: as in column 3, with white light. Column 6: as in column 4, with white light (WL). (B) Michelson contrast value measured according to the maximum and minimum grayscale values along a central vertical profile in the image for the conditions shown in panel A (legend as indicated by the rectangular squares in the bottom of A). The simulations and experimental on-bench measurements (A) and contrast analysis (B) were performed for a diffraction-limited (DL) artificial eye and aberrations of three subjects enrolled in the study (S1, S2, and S3).
Figure 4.
Figure 4.
Visual acuity (symbols) for all subjects and average for the following conditions: high-contrast stimulus and natural aberrations in green light (light green squares); convolved stimulus through natural aberrations, in green light (dark green circles); high-contrast stimulus and natural aberrations in white light (light gray squares); and convolved stimulus through natural aberrations, in white light (dark gray circles). The gradient bars in the average plot represent the VA differences between measurements with natural aberrations and convolved images in monochromatic (green bar) and white light (gray bar), on average. The error bars in the plots for individual subjects stand for the standard deviation of the repeated measurements (in most cases smaller than the symbol). The error bars in the average plot stand for standard deviations across subjects.
Figure 5.
Figure 5.
Optical quality (2-D correlation metric, left axis) and visual quality (logMAR VA, right-axis) for the following conditions: high-contrast stimulus and natural aberrations in green light (light green bar/square); convolved stimulus through natural aberrations, in green light (dark green bar/circle); high-contrast stimulus and natural aberrations in white light (light gray bar/square); and convolved stimulus through natural aberrations, in white light (dark gray bar/circle). Dashed lines have been included to facilitate comparison of VA across conditions. The error bars in the plots for individual subjects stand for the standard deviation of the repeated measurements (in most cases smaller than the symbol). The error bars in the average plot stand for standard deviations across subjects.

References

    1. Aissati, S., Vinas, M., Benedi-Garcia, C., Dorronsoro, C., & Marcos, S. (2020). Testing the effect of ocular aberrations in the perceived transverse chromatic aberration. Biomedical Optics Express, 11(8), 4052–4068, [10.1364/BOE.396469]. - DOI - PMC - PubMed
    1. Anstis, S., & Cavanagh, P. (1983). A minimum motion technique for judging equiluminance. In Mollon, J. D., Sharpe, L. T. (Eds.), Colour Vision: Psychophysics and Physiology (pp. 155–166). London: Academic Press.
    1. Applegate, R. A., Ballentine, C., Gross, H., Sarver, E. J., & Sarver, C. A. (2003). Visual acuity as a function of Zernike mode and level of root mean square error. Optometry and Vision Science, 80(2), 97–105, https://journals.lww.com/optvissci/Abstract/2003/02000/Visual_Acuity_as_.... - PubMed
    1. Applegate, R. A., & Lakshminarayanan, V. (1993). Parametric representation of Stiles–Crawford functions: Normal variation of peak location and directionality. Journal of the Optical Society of America A, 10(7), 1611–1623. [PubMed] - PubMed
    1. Applegate, R. A., Marsack, J. D., Ramos, R., & Sarver, E. J. (2003). Interaction between aberrations to improve or reduce visual performance. Journal of Cataract & Refractive Surgery, 29(8), 1487–1495, https://journals.lww.com/jcrs/Abstract/2003/08000/Interaction_between_ab.... - PubMed

Publication types