. 2022 Apr 4;221(4):e202109168.
doi: 10.1083/jcb.202109168. Epub 2022 Feb 18.

Cell migration orchestrates migrasome formation by shaping retraction fibers

Affiliations

Cell migration orchestrates migrasome formation by shaping retraction fibers

Changyuan Fan et al. J Cell Biol. .

Abstract

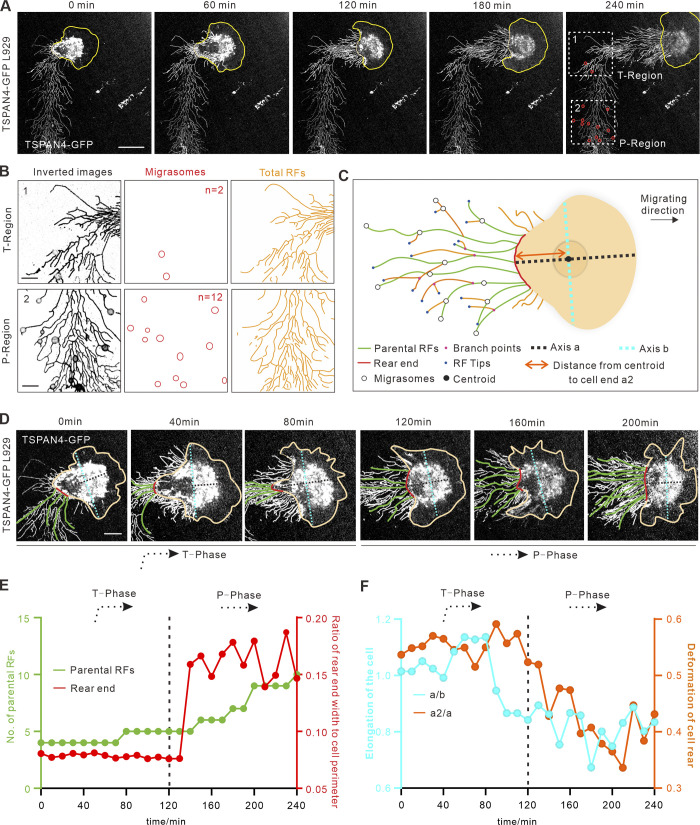
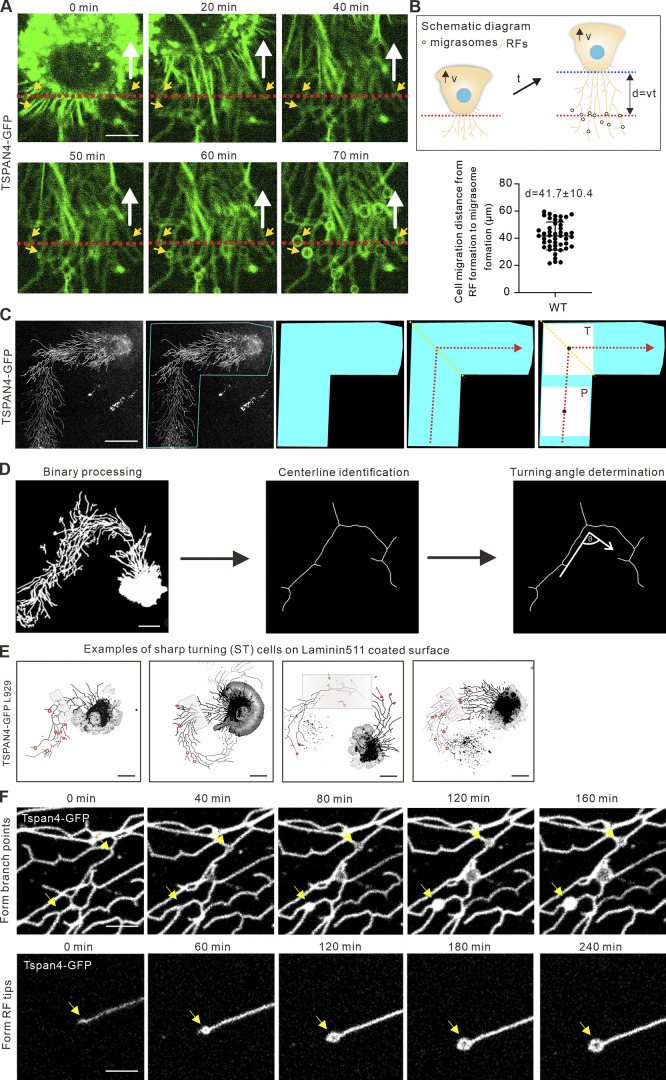
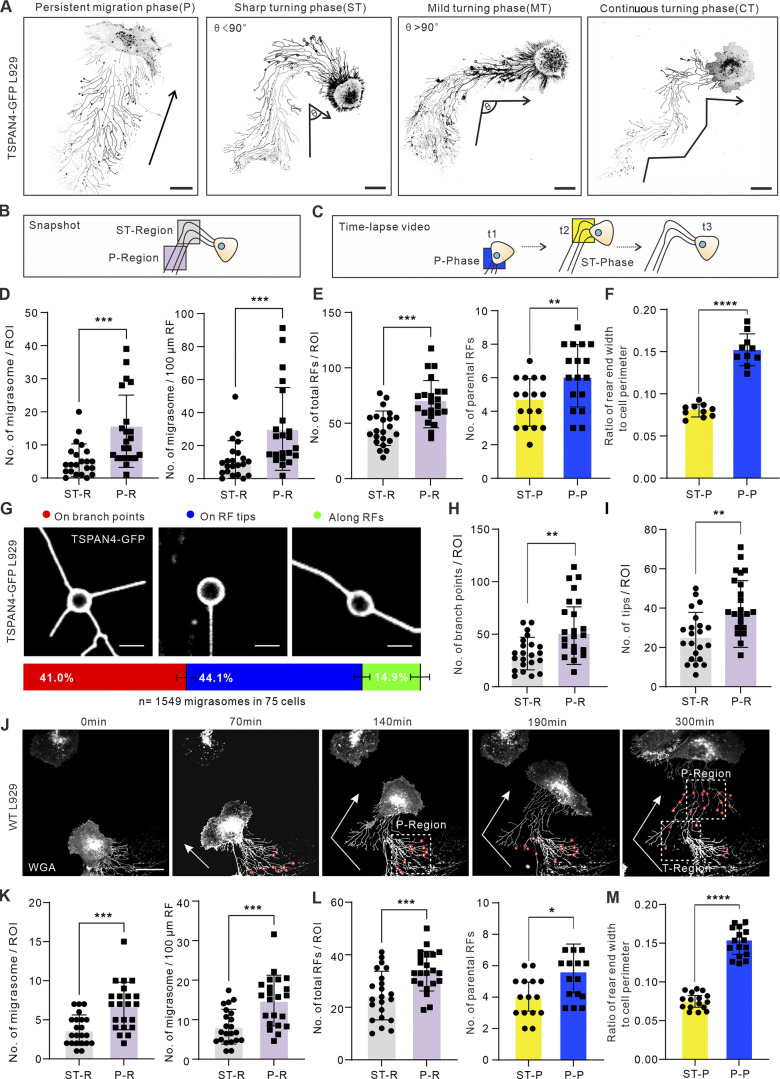
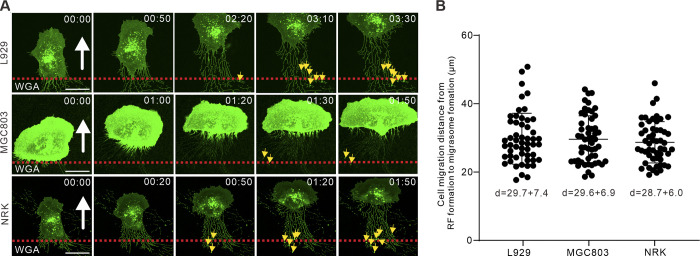
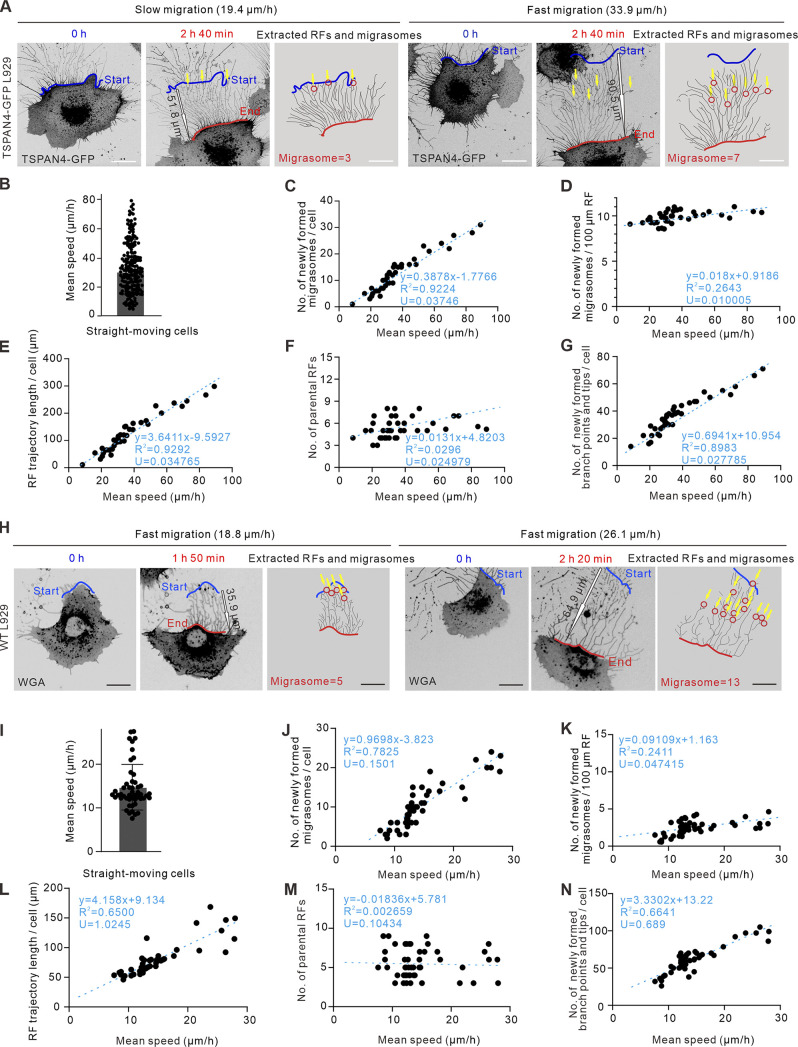
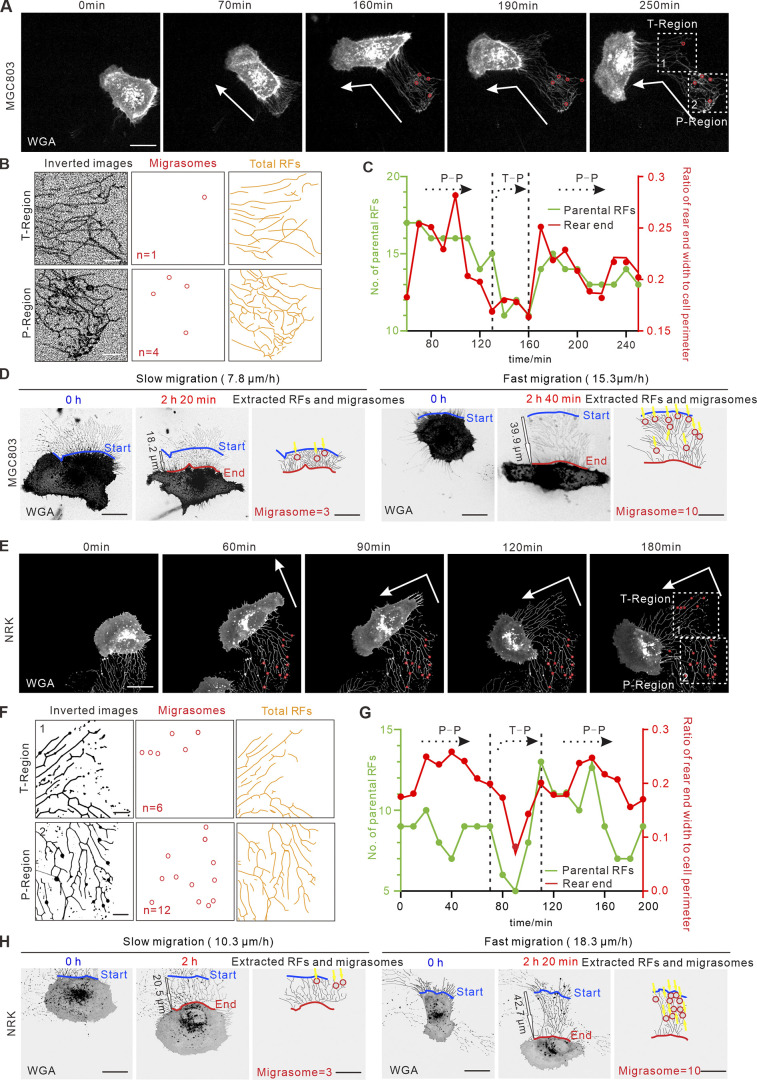
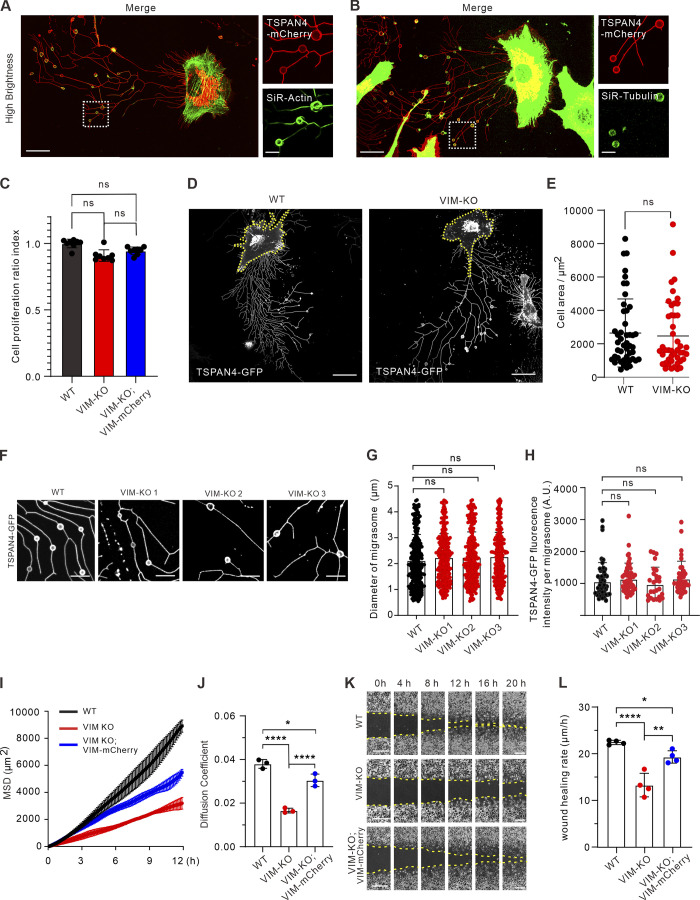
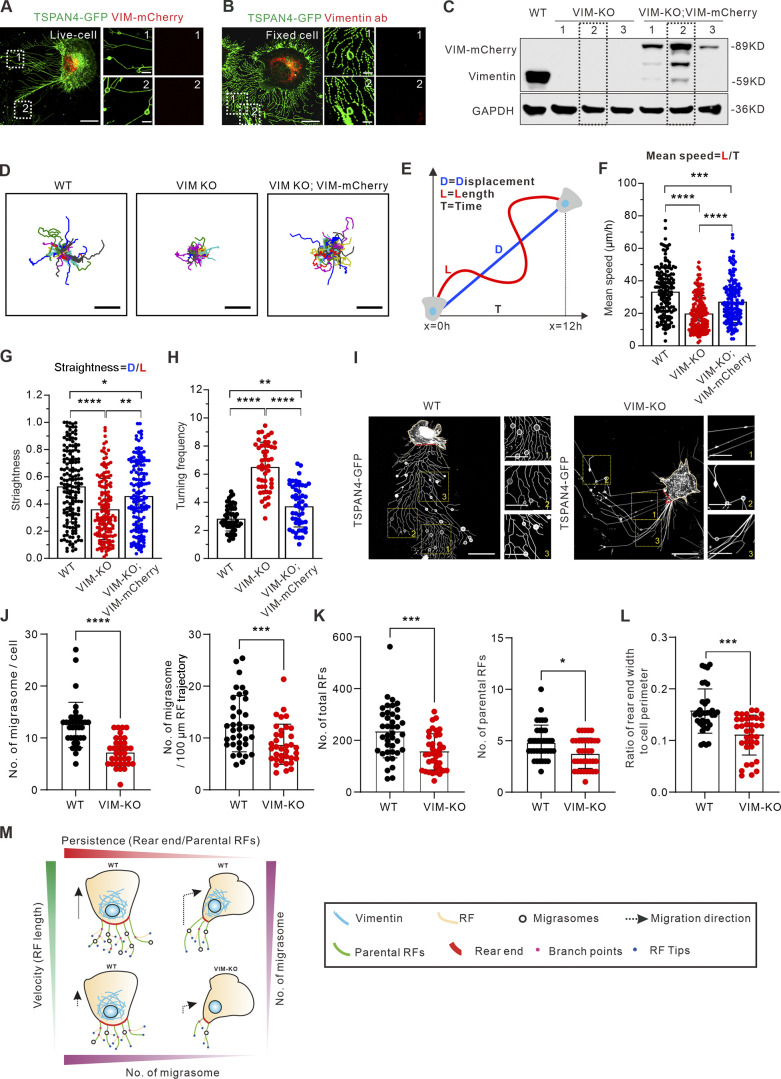
Migrasomes are recently discovered vesicle-like structures on retraction fibers of migrating cells that have been linked with transfer of cellular contents, shedding of unwanted materials, and information integration. However, whether and how the cell migration paradigm regulates migrasome formation is not clear. Here, we report that there are significantly fewer migrasomes in turning cells compared with straight persistently migrating cells. The major insight underlying this observation is that as the cells elongate, their rear ends become narrower, subsequently resulting in fewer retraction fibers during impersistent migration. In addition to migration persistence, we reveal that migration speed positively corelates with migrasome formation, owing to the derived length of retraction fibers. Substantiating our hypothesis, genetically removing vimentin compromises cell migration speed and persistence and leads to fewer migrasomes. Together, our data explicate the critical roles of two cell migration patterns, persistence and speed, in the control of migrasome formation by regulating retraction fibers.


Figures

Figure 1.
Figure 1.
Migrasomes form less when a migrating cell turns. (A) Representative images from a time-lapse video of a L929 cell expressing TSPAN4-GFP. Yellow lines mark the outline of the cell, and white boxes indicate ROIs of T-region and P-region. Scale bar, 20 µm. (B) Analysis of TSPAN4-GFP signals in T-phase and P-phase depicted in A. Images were inverted, and migrasomes and RFs were masked on the right panel. n in middle panel represents the number of migrasomes. Scale bars, 10 µm. (C) Schematic diagram of a migrating cell. Different migration-associated components and indexes are defined in the diagram. (D) Enlarged time-lapse image of the cell shown in A, with rear end and parental RFs indicated as red and green lines, respectively. Axis a and axis b are indicated with cyan and black dashed lines, respectively. Scale bars, 10 µm. (E) Quantification of parental RFs (green lines) and the ratio of rear end width to cell perimeter (red lines) of the migrating cell in A. (F) Quantification of the length ratio of a to b (cyan) and a2 to a (orange) in each time point of the migrating cell in A. Black dashed line in E and F indicates the time cutoff point between T-phase and P-phase. n = 25 time points.
Figure S1.
Figure S1.
Data analysis details. (A) Representative images from a time-lapse video indicate the time from RF derivation to migrasome formation in TSPAN4-GFP L929 cells. The white arrow indicates the direction of cell migration, the red dashed line denotes the position of cell rear at initial time point, and the yellow arrows indicated the position of migrasome appearance. Scale bars, 10 µm. (B) Schematic diagram and quantification of cell displacement from RF formation to migrasome appearance. Data are presented as mean ± SD; n = 48 cells. (C) Process diagram to determine the ROI of T-phase and P-phase in a sharp-turning TSPAN4-GFP L929 cell. Blue region marks the ROI of turning cell, yellow lines mark the position of turning, red lines mark the trajectory of migration, black dots mark the center of squares, and white squares mark the ROI of T-phase and P-phase. Scale bars, 20 µm. (D) Schematic diagram of the steps to define the turning angle. Scale bars, 20 µm. (E) Examples of sharp-turning TSPAN4-GFP L929 cells grown on laminin 511–coated surface. Gray boxes indicate the T-regions, and red circles indicate the migrasomes. Scale bars, 20 µm. (F) Representative images from time-lapse videos in TSPAN4-GFP L929 cells visualizing the migrasome formation process on branch points and tips of RFs. Yellow arrows indicate the position where migrasomes formed. Scale bars, 10 µm.
Figure 2.
Figure 2.
Cell turning leads to narrower rear ends and consequently fewer RFs. (A) Examples of different migration patterns of TSPAN4-GFP L929 cells. Black arrows indicate the migration direction. Ө indicates the turning angle. Scale bars, 20 µm. (B) Schematic diagram of the analyzed region for quantifying the number of migrasomes (per ROI and per 100 μm) and total RFs. ST-region, sharp turning region. (C) Schematic diagram of the time point for calculating the number of parental RFs and rear ends. t1, t2, and t3 are ordinal chronological points of the cell. (D) Quantification of the number of migrasomes per ROI (T-region or P-region) or per 100 μm of RFs within the ROI in ST cells. n = 22 cells. (E) Quantification of total RFs (n = 22) and parental RFs (n = 17) within the ROI in T-phase and P-phase of the ST cell. (F) Quantification of the ratio of rear end width to cell perimeter within the ROIs in T-phase and P-phase of the ST cells. n = 10 cells. (G) Three types of migrasome localizations in RF networks and their corresponding proportions in TSPAN4-GFP L929 cells. Scale bars, 5 µm. Quantification is from n = 1,549 migrasomes in 75 cells. (H) Quantification of the branch points within the defined ROIs in T-phase and P-phase of the ST cells. n = 22 cells. (I) Quantification of the tips within the defined ROIs in T-phase and P-phase of the ST cells. n = 22 cells. (J) Representative images from a time-lapse video of WT L929 cell. White arrows indicate the migration direction; red circles indicate migrasomes, and white boxes indicate ROIs of T-region and P-region. Scale bar, 20 µm. (K) Quantification of the number of migrasomes per ROI (T-region or P-region), or per 100 μm of RFs within the ROI in ST cells. n = 22 cells. (L) Quantification of the number of total RFs and parental RFs within the ROI in T-phase and P-phase of the ST cell. n = 22 cells in left panel and n = 15 cells in right panel. (M) Quantification of the ratio of rear end width to cell perimeter within the ROIs in T-phase and P-phase of the ST cells. n = 16 cells. The data for quantification in D–F, H, I, and K–M are from n = 3 independent experiments. The data are presented as mean ± SD (t test). *, P < 0.05; **, P < 0.01; ***, P < 0.001; ****, P < 0.0001.
Figure S2.
Figure S2.
Cell migration displacement from RF formation to migrasome appearance. (A) Representative images from time-lapse videos indicate the time from RF derivation to migrasome formation in WT L929, MGC803, and NRK cells. The white arrows indicated the direction of cell migration, the red dashed lines denote the position of cell rear at initial time point, and the yellow arrows indicate the position of migrasome appearance. Scale bars, 20 µm. (B) Quantification of cell displacement from RF formation to migrasome appearance. Data are presented as mean ± SD; n = 54 cells in L929, 53 cells in MGC803 and 53 cells in NRK.
Figure 3.
Figure 3.
Migrasomes form more when cells migrating faster regardless of their migration persistence. (A) Representative images from time-lapse videos of an L929 cell expressing TSPAN4-GFP. The left panel shows an example of a slow persistent migrating cell, and the right panel shows an example of a fast persistent migrating cell; red and blue lines indicate the start and end positions of the migrating cell, respectively; yellow arrows indicate the position of migrasome formation; and black outline arrows indicated the displacement of the migrating cell. Scale bar, 20 µm. (B) Quantification of average speed of straight-moving cells in the same culture condition. n = 200 cells. (C) Quantification of the number of newly formed migrasomes per cell in straight-moving cells. n = 39 cells. (D) Quantification of the number of newly formed migrasomes per 100-µm RF trajectory in straight-moving cells. n = 39 cells. (E) Quantification of the RF trajectory length per cell in straight-moving cells. n = 39 cells. (F) Quantification of the number of parental RFs per cell in straight-moving cells. n = 39 cells. (G) Quantification of the number of newly formed branch points and tips per cell in straight-moving cells. n = 39 cells. The fitting lines are indicated by the blue dashed line, and the fitting equations are listed in each panel from C to G, with goodness of fit R2 and uncertainty of the fitting slope U to define the correlation coefficient. (H) Representative images from time-lapse videos of WT L929 cells. The left panel shows an example of a slow persistent migrating cell, and the right panel shows an example of a fast persistent migrating cell; red and blue lines indicated the start and end position of the migrating cell, respectively; red circles indicate migrasomes; yellow arrows indicate the position of migrasome formation; and black outline arrows indicated the displacement of the migrating cell. Scale bar, 20 µm. (I) Quantification of average speed of straight-moving WT L929 cells in the same culture condition. n = 41 cells. (J) Quantification of the number of newly formed migrasomes per cell in straight-moving cells. n = 43 cells. (K) Quantification of the number of newly formed migrasomes per 100-µm RF trajectory in straight-moving cells. n = 44 cells. (L) Quantification of the RF trajectory length per cell in straight-moving cells. n = 39 cells. (M) Quantification of the number of parental RFs per cell in straight-moving cells. n = 41 cells. (N) Quantification of the number of newly formed branch points and tips per cell in straight-moving cells. n = 41 cells. The fitting lines are indicated by blue dashed line, and the fitting equations are listed in each panel from C–G and J–N with goodness of fit R2 and uncertainty of the fitting slope U to define the correlation coefficient. The data for quantification in C–G and J–N are from n = 3 independent experiments.
Figure 4.
Figure 4.
Persistence and speed of cell migration regulate migrasomes formation in MGC803 and NRK cells. (A and E) Representative images from a time-lapse video of WT MGC803 cell (A) and NRK cell (E). White arrows indicate the migration direction, red circles indicate migrasomes, and white boxes indicate ROIs of T-region and P-region. Scale bar, 20 µm. (B and F) Analysis of RFs and migrasomes in T-region and P-region depicted in A and E, respectively. Images were inverted, and migrasomes and RFs were masked on the right. n in middle panel represents the number of migrasomes. Scale bars, 10 µm. (C and G) Quantification of the number of parental RFs (green lines) and the ratio of rear end width to cell perimeter (red lines) of the migrating cell in A and E, respectively. (D and H) Representative images from time-lapse videos of WT MGC803 cells (D) and NRK cells (H). The left panel shows an example of a slow persistent migrating cell, and the right panel shows an example of a fast persistent migrating cell. The red and blue lines indicate the start and end position of the migrating cell, respectively; yellow arrows indicated the position of migrasome formation; and black outline arrows indicated the displacement of the migrating cell. Scale bar, 20 µm.
Figure S3.
Figure S3.
Vimentin deficiency leads to defective cell migration and abnormal migrasome formation. (A) Representative images from a time-lapse video of TSPAN4-mCherry L929 cells incubated with SiR-actin. Magnified panels are the white box in the left panel. Scale bars, 20 µm. (B) Representative images from a time-lapse video of TSPAN4-mCherry L929 cells stained with SiR-tubulin. Magnified panels are the white box in the left panel. Scale bars, 20 µm. (C) Analysis of CCK8 assay in TSPAN4-GFP WT, VIM-KO, and VIM-KO; VIM-RES cells. (D) Examples of snapshots of live TSPAN4-GFP WT and VIM-KO L929 cells. Yellow dashed lines indicate the cell outlines. Scale bars, 20 µm. (E) Quantification of the cell area in TSPAN4-GFP WT and VIM-KO L929 cells. n = 47 cells. (F) Examples of RF-associated migrasomes in TSPAN4-GFP WT and VIM-KO L929 cells. Scale bars, 10 µm. (G) Quantification of the diameter of migrasomes in TSPAN4-GFP WT and VIM-KO L929 cells. n = 343 migrasomes in 23 cells. (H) Quantification of the TSPAN4-GFP intensity per migrasome in TSPAN4-GFP WT and VIM-KO L929 cells. n = 50 migrasomes in 11 cells. (I) Mean square displacement (MSD) analysis of representative trajectories per condition. n = 3 regions including 15 trajectories. (J) Diffusion coefficient (D, μm2/100 ms) was calculated from the slope of the fitted regression line derived by MSD analysis of H. n = 3 regions including 15 trajectories. (K) Examples of wound healing assay in TSPAN4-GFP WT, VIM-KO, and VIM-KO; VIM-RES cells. Scale bars, 100 µm. (L) Quantification of wound healing migration rate per condition. n = 4 independent experiments. The data for quantification in C, E, and G–L are from n = 3 independent experiments. Data are presented as mean ± SD (t test in E; one-way ANOVA in C, G, J, and K). *, P < 0.05; **, P < 0.01; ****, P < 0.0001.
Figure 5.
Figure 5.
Vimentin regulates migrasome formation by modulating cell migration velocity and persistence. (A) Representative snapshots of live cells show the subcellular distribution of exogenously expressed vimentin-mCherry and TSPAN4-GFP in L929 cells. The white dotted outlines represent ROIs containing RFs and migrasomes. Scale bars, 10 and 2 µm in image and magnified view, respectively. (B) Representative immunofluorescence images show the subcellular distribution of endogenous vimentin with respect to TSPAN4-GFP. The white dotted outlines represent ROIs containing RFs and migrasomes. Scale bars, 10 and 2 µm in image and magnified view, respectively. (C) Western blot analysis of the extracts of WT, VIM-KO, and VIM-KO; VIM-mCherry TSPAN4-GFP expressing L929 cells. The dashed line indicates the cell line we chose for further experiments. (D) Cell random migration trajectory of WT, VIM-KO, and VIM-KO; VIM-mCherry TSPAN4-GFP–expressing cells within 12 h. n = 15 cells. Scale bars, 100 µm. (E) Schematic diagram for the quantification of cell migration speed and straightness. (F) Quantification of the mean speed of TSPAN4-GFP WT, VIM-KO, and VIM-KO; VIM-mCherry cells. n = 150 cells. (G) Quantification of the straightness of TSPAN4-GFP WT, VIM-KO, and VIM-KO; VIM-mCherry cells. n = 150 cells. (H) Quantification of the turning frequency of TSPAN4-GFP WT, VIM-KO, and VIM-KO; VIM-mCherry cells. n = 50 cells. (I) Snapshots of live TSPAN4-GFP–expressing WT and VIM-KO L929 cells. Yellow squares indicate the magnified fields, and red lines mark the rear end. Scale bars, 20 and 10 µm in image and magnified view, respectively. (J) Quantification of the number of migrasomes per cell and per 100-μm RF trajectory in TSPAN4-GFP WT and VIM-KO L929 cells. n = 36 cells. (K) The number of total RFs and parental RFs in TSPAN4-GFP–expressing WT and VIM-KO L929 cells. n = 36 cells. (L) Quantification of the ratio of rear end width to cell perimeter in TSPAN4-GFP WT and VIM-KO L929 cells. n = 36 cells. (M) Schematic model of cell migration pattern to orchestrate migrasome formation. The data for quantification in F–H and J–L are from n = 3 independent experiments. The data are presented as mean ± SD (t test in J–L; one-way ANOVA in I–K). *, P < 0.05; **, P < 0.01; ***, P < 0.001; ****, P < 0.0001. Source data are available for this figure: SourceData F5.

References

    1. Amini, R., Labudina A.A., and Norden C.. 2019. Stochastic single cell migration leads to robust horizontal cell layer formation in the vertebrate retina. Development. 146:dev173450. 10.1242/dev.173450. - DOI - PubMed
    1. Andrew, N., and Insall R.H.. 2007. Chemotaxis in shallow gradients is mediated independently of PtdIns 3-kinase by biased choices between random protrusions. Nat. Cell Biol. 9:193–200. 10.1038/ncb1536 - DOI - PubMed
    1. Bhattacharya, R., Gonzalez A.M., Debiase P.J., Trejo H.E., Goldman R.D., Flitney F.W., and J.C.R. Jones. 2009. Recruitment of vimentin to the cell surface by beta3 integrin and plectin mediates adhesion strength. J. Cell Sci. 122:1390–1400. 10.1242/jcs.043042 - DOI - PMC - PubMed
    1. Bodor, D.L., Pönisch W., Endres R.G., and Paluch E.K.. 2020. Of cell shapes and motion: The physical basis of animal cell migration. Dev. Cell. 52:550–562. 10.1016/j.devcel.2020.02.013 - DOI - PubMed
    1. Caswell, P.T., and Norman J.C.. 2006. Integrin trafficking and the control of cell migration. Traffic. 7:14–21. 10.1111/j.1600-0854.2005.00362.x - DOI - PubMed

Publication types

Substances