. 2022 Feb 18;8(7):eabj7002.
doi: 10.1126/sciadv.abj7002. Epub 2022 Feb 18.

Exosome-mediated genetic reprogramming of tumor-associated macrophages by exoASO-STAT6 leads to potent monotherapy antitumor activity

Affiliations

Exosome-mediated genetic reprogramming of tumor-associated macrophages by exoASO-STAT6 leads to potent monotherapy antitumor activity

Sushrut Kamerkar et al. Sci Adv. .

Abstract

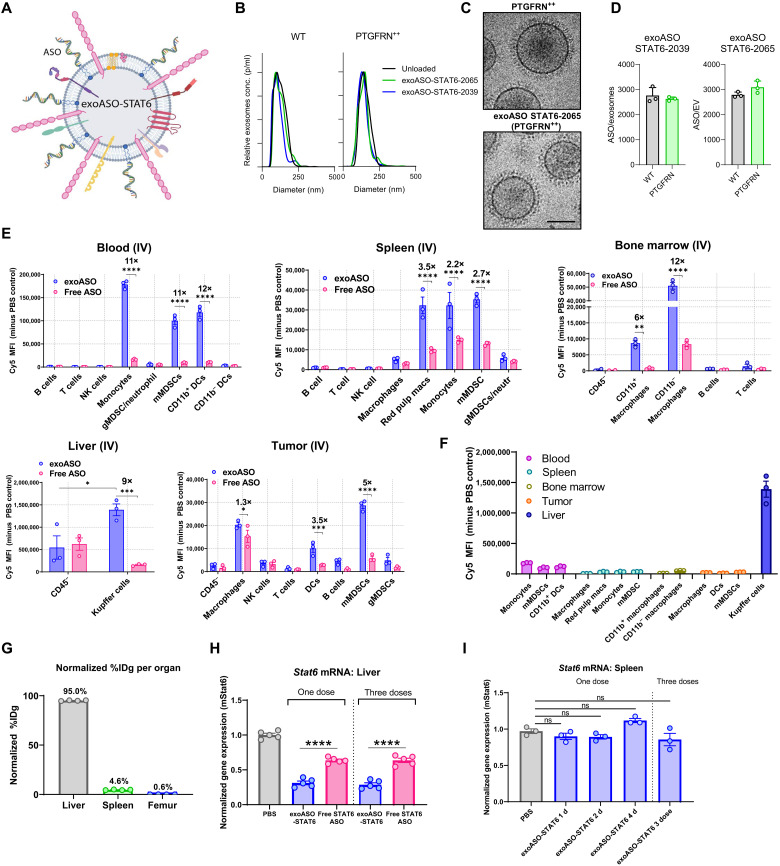
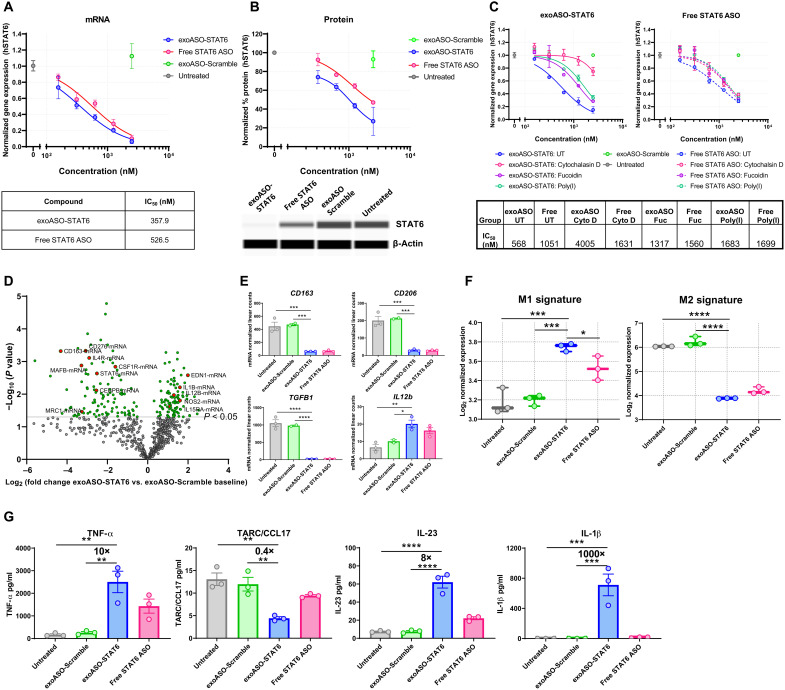
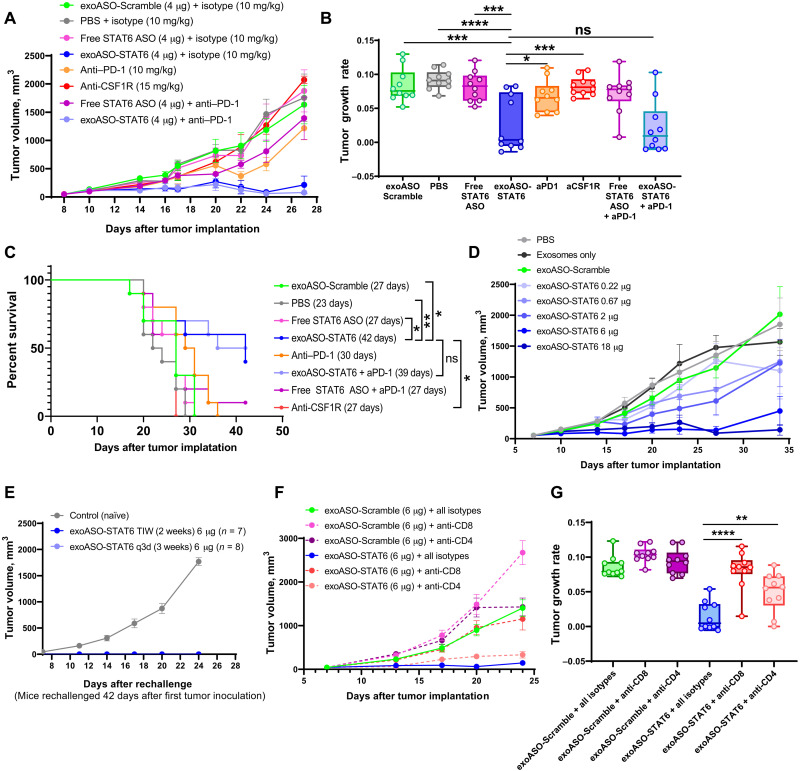
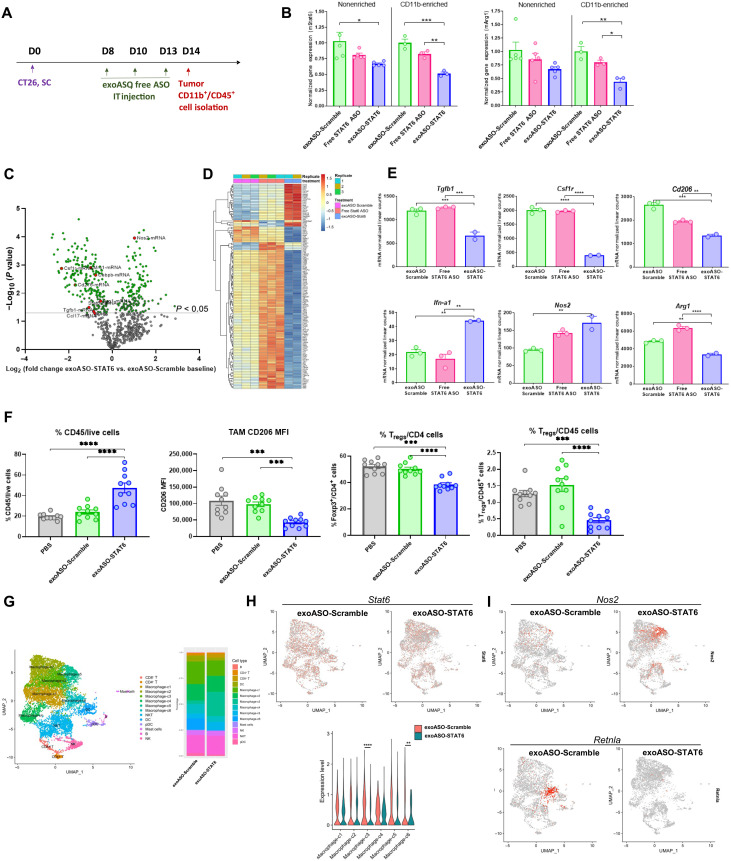
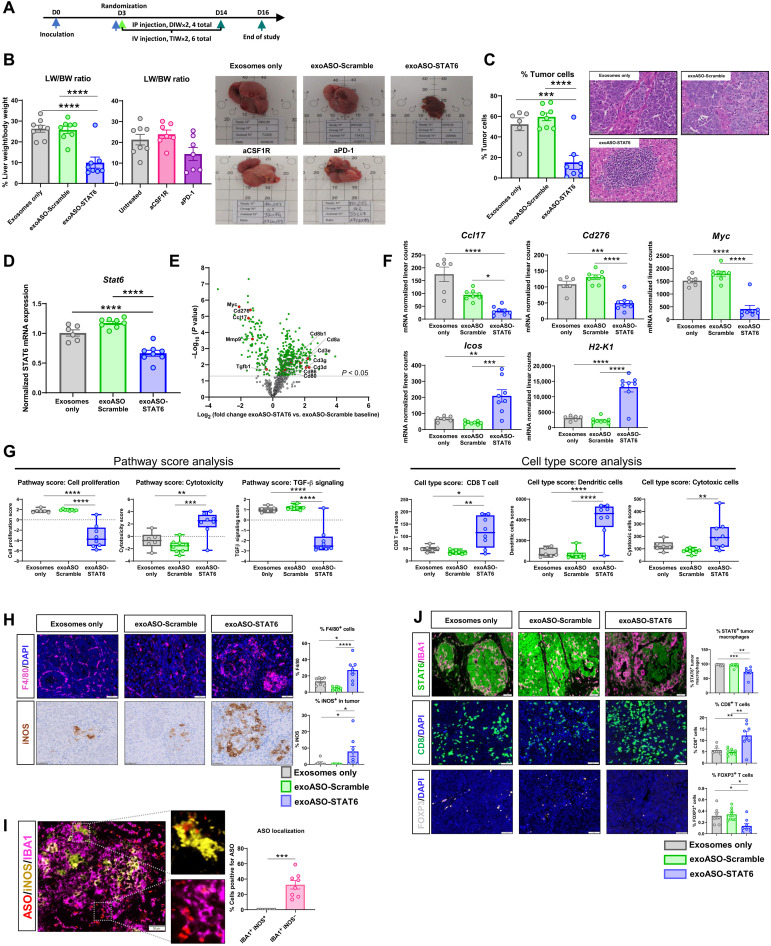
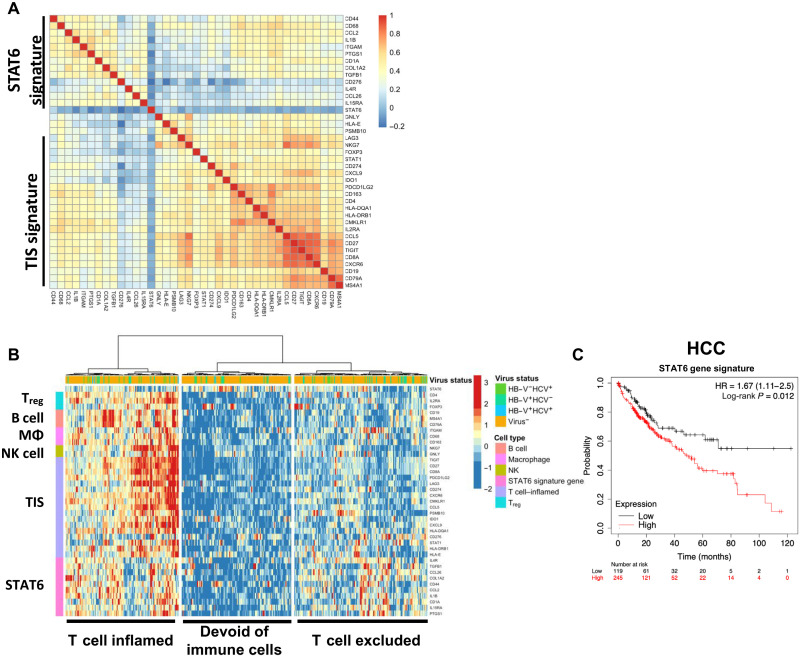
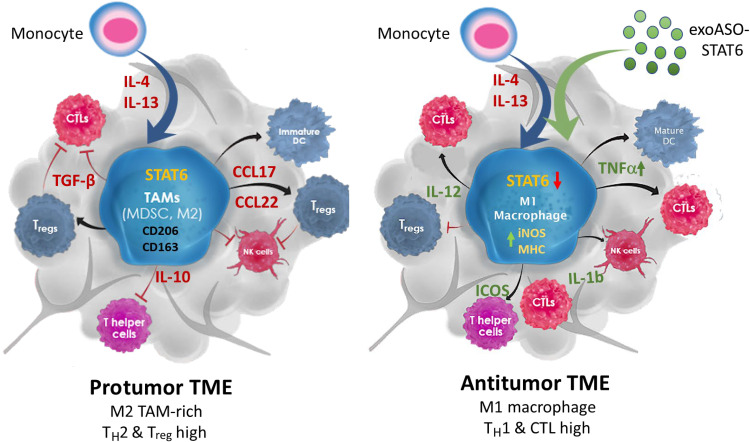
Effectiveness of checkpoint immunotherapy in cancer can be undermined by immunosuppressive tumor-associated macrophages (TAMs) with an M2 phenotype. Reprogramming TAMs toward a proinflammatory M1 phenotype is a novel approach to induce antitumor immunity. The M2 phenotype is controlled by key transcription factors such as signal transducer and activator of transcription 6 (STAT6), which have been "undruggable" selectively in TAMs. We describe an engineered exosome therapeutic candidate delivering an antisense oligonucleotide (ASO) targeting STAT6 (exoASO-STAT6), which selectively silences STAT6 expression in TAMs. In syngeneic models of colorectal cancer and hepatocellular carcinoma, exoASO-STAT6 monotherapy results in >90% tumor growth inhibition and 50 to 80% complete remissions. Administration of exoASO-STAT6 leads to induction of nitric oxide synthase 2 (NOS2), an M1 macrophage marker, resulting in remodeling of the tumor microenvironment and generation of a CD8 T cell-mediated adaptive immune response. Collectively, exoASO-STAT6 represents the first platform targeting transcription factors in TAMs in a highly selective manner.


Figures

Fig. 1.
Fig. 1.. Exosome-mediated preferential delivery of ASOs to myeloid cells in vivo.
(A) Schematic of STAT6 ASO loaded on PTGFRN++ exosomes. (B) Representative size distribution of WT and PTGFRN++ exosomes; unloaded or loaded with STAT6 ASO-2039 and ASO-2065, as measured by nanoparticle tracking analysis. (C) Representative cryogenic electron microscopy image of PTGFRN++ exosome; unloaded or loaded with STAT6 ASO-2065. (D) Quantification of loading (ASO/exosome) of STAT6 ASO-2039 and ASO-2065 on WT and PTGFRN++ exosomes. (E) In vivo distribution of Cy5-labeled exoASO STAT6-2039 (WT) as compared to free ASO. One hour after single intravenous (IV) dose (8 μg) of either exoASO or free STAT6-2039 (Cy5), mean fluorescence intensity (MFI) of Cy5 in the indicated immune cells and tissues of BALB/c mice bearing subcutaneous CT26 tumors is plotted. (F) Comparative analysis of the MFI of Cy5 (exoASO administered only) from (E), in the indicated myeloid cell populations from the indicated tissues. (G) Normalized % injected dose per gram (%IDg) as measured by positron emission tomography of C57Bl/6 mice injected intravenously with zirconium-89–labeled exosomes (PTGFRN++), %IDg was calculated at 55 min after single intravenous dose. gMDSC, granulocytic MDSC; mMDSC, monocytic MDSC. (H) Normalized gene expression analysis of changes in Stat6 mRNA expression in the liver of naïve C57Bl/6 mice injected once or three times (TIW) intravenously with exoASO STAT6-2039 (PTGFRN++) (12 μg) or free STAT6 ASO-2039 (12 μg). (I) Normalized gene expression analysis of Stat6 mRNA expression in the spleen of naïve C57Bl/6 mice injected once or three times (TIW) intravenously with PBS or exoASO STAT6-2039 (PTGFRN++) (12 μg). TIW, three times a week. Data are means ± SD (D) and ± SEM (E to I). *P < 0.05, **P < 0.01, ***P < 0.001, and ****P < 0.0001; ns, not significant. Two-way analysis of variance (ANOVA) with Sidak’s multiple comparisons test (E), and one-way ANOVA with Tukey’s multiple comparisons test (H and I).
Fig. 2.
Fig. 2.. Persistent reduction of STAT6 expression by exoASO leads to reprogramming of M2 macrophages.
(A) Normalized gene expression analysis by reverse transcription quantitative polymerase chain reaction (RT-qPCR) showing knockdown of STAT6 mRNA expression in M2 MDMs treated for 48 hours with either exoASO STAT6-2065 (PTGFRN++), free STAT6 ASO-2065, or exoASO-Scramble. hSTAT6, human STAT6; IC50, median inhibitory concentration. (B) Reduction in protein expression of STAT6 as measured by whole-exome sequencing, in M2 MDMs treated for 96 hours with either exoASO STAT6-2065 (PTGFRN++), free STAT6 ASO-2065, or exoASO-Scramble, normalized to housekeeping gene β-actin. (C) Normalized gene expression analysis by RT-qPCR showing knockdown of STAT6 mRNA expression in M2 MDMs untreated (UT) or pretreated with either 10 μM cytochalasin D, poly(I) (10 μg/ml), or fucoidan (500 μg/ml). M2 MDMs were then treated with exoASO STAT6-2039 (PTGFRN++), free STAT6 ASO-2039, or exoASO-Scramble for 48 hours. (D) NanoString gene expression analysis as depicted by a volcano plot of changes in gene expression of exoASO-STAT6 versus exoASO-Scramble baseline and of M2 MDMs treated for 48 hours with 2.5 μM exoASO STAT6-2039 (WT), free STAT6 ASO-2039, or exoASO-Scramble. One representative donor of three is shown. (E) Modulation of expression levels of CD163, CD206, TGFB1, and IL12b from (D). (F) M1 and M2 signature analysis (31), calculated from gene expression analysis from (D). (G) Cytokine analysis depicting modulation of TNF-α, CCL17, IL-23, and IL-1β using a multiplex flow cytometry assay and of M2 MDMs treated for 48 hours (24 hours with LPS) with 2.5 μM of either exoASO STAT6-2039 (WT), free STAT6 ASO-2039, or exoASO-Scramble. One representative donor of four is shown. Data are means ± SD. *P < 0.05, **P < 0.01, ***P < 0.001, and ****P < 0.0001. One-way ANOVA with Tukey’s multiple comparisons test (E to G).
Fig. 3.
Fig. 3.. exoASO-STAT6 treatment results CD8 T cell–dependent monotherapy efficacy in CT26.
(A) Tumor growth volumes of BALB/c mice bearing subcutaneous CT26 tumors, injected intratumorally (TIW) with PBS, exoASO-Scramble (4 μg), free STAT6 ASO-2039 (4 μg), and exoASO STAT6-2039 (WT) (4 μg); intraperitoneally [twice a week (BIW)] with anti–PD-1 monoclonal antibody (10 mg/kg) and anti-CSF1R (15 mg/kg); and a combination of exoASO STAT6-2039 (WT) (4 μg) or free STAT6 ASO-2039 (4 μg) with anti–PD-1 monoclonal antibody (10 mg/kg); n = 10 mice per group. (B) Tumor growth rates from data in (A). (C) Kaplan-Meier survival curve analysis of data from CT26 mice in (A), log-rank Mantel-Cox test. (D) Tumor growth volumes of BALB/c mice bearing subcutaneous CT26 tumors, injected intratumorally with PBS, exosomes only, exoASO-Scramble (6 μg) (BIW, 3 weeks), or exoASO STAT6-2039 (PTGFRN++) (0.22, 0.67, 2, 6, and 18 μg) (BIW, 3 weeks); n = 10 mice per group. (E) Tumor growth volumes of mice rechallenged with CT26 tumors on the opposite flank of complete responders from (fig. S3D), Naïve BALB/c mice bearing subcutaneous CT26 tumors were used as controls; n = 10 mice for control group. (F) Tumor growth volumes of BALB/c mice bearing subcutaneous CT26 tumors after CD8 and CD4 T cell depletion, injected intratumorally with either exoASO-Scramble (6 μg) (TIW, 2 weeks) or exoASO STAT6-2039 (PTGFRN++) (6 μg) (TIW, 2 weeks). Mice received one dose of anti-CD8 or anti-CD4 antibody (10 mg/kg) or of isotype control antibody (10 mg/kg), before intratumoral injections, and BIW thereafter; n = 10 mice per group. (G) Tumor growth rates from data in (F). Data are means ± SEM. *P < 0.05, **P < 0.01, ***P < 0.001, and ****P < 0.000. One-way ANOVA with Tukey’s multiple comparisons test (B and G).
Fig. 4.
Fig. 4.. Effective reprogramming of TAMs by exoASO-STAT6 results in remodeling of TME.
(A) Schematic of dosing schedule for (B) to (E) and (G) to (I). BALB/c mice bearing subcutaneous (SC) CT26 tumors injected with exoASO-Scramble (4 μg), exoASO STAT6-2039 (WT) (4 μg), or free STAT6 ASO-2039 (4 μg). IT, intratumoral. (B) Normalized gene expression analysis by RT-qPCR of changes in Stat6 and Arg1 mRNA expression from whole tumors and CD11b-enriched fractions. (C) NanoString gene expression analysis as depicted by a volcano plot of changes in gene expression of exoASO-STAT6 versus exoASO Scramble baseline, from CD11b-enriched fractions from (B). (D) Heatmap of common differentially expressed genes from all groups from (C). (E) Graphical representation of changes in expression levels of Tgfb1, Csf1r, CD206, Ifn-a1, Nos2, and Arg1 from (C). (F) Flow cytometry analysis of % of total immune cells, and MFI of (CD206+) TAMs and % of Tregs (FoxP3+) within CD4+ or CD45+ immune cell population from tumors of BALB/c mice bearing subcutaneous CT26 tumors, injected intratumorally with PBS, exoASO-Scramble (6 μg) (TIW, 1 week), or exoASO STAT6-2039 (PTGFRN++) (6 μg) (TIW, 1 week); n = 10 mice per group. (G) UMAP plot from scRNA-seq of intratumoral cells of all groups merged to identify individual immune cell populations. BALB/c mice bearing subcutaneous CT26 tumors were injected intratumorally with exoASO-Scramble (6 μg) or exoASO STAT6-2039 (PTGFRN++) (6 μg) (TIW, 1 week). (H) UMAP plots from data from (G), showing global changes in expression and quantification of Stat6 in immune cell populations. (I) UMAP plots from data from (G), showing global changes in expression of Nos2 and Retnla (Fizz1) in immune cell populations. Data are means ± SEM. *P < 0.05, **P < 0.01, ***P < 0.001, and ****P < 0.000. One-way ANOVA with Tukey’s multiple comparisons test (B, E, F, and H).
Fig. 5.
Fig. 5.. Systemic administration of exoASO-STAT6 results in a potent monotherapy antitumor response.
(A) Schematic of dosing schedule for (B) to (J). IP, intraperitoneal. (B) Antitumoral efficacy as represented by liver weight (LW) versus body weight (BW) ratio of C57Bl/6 mice bearing orthotopic Hepa1-6 tumors in the liver, injected intravenously with exosomes only, exoASO-Scramble (12 μg) (TIW, 2 weeks), or exoASO STAT6-2039 (PTGFRN++) (12 μg) (TIW, 2 weeks) or intraperitoneally with anti-CSF1R (10 mg/kg) (DIW) or anti–PD-1 (10 mg/kg) (BIW). Representative gross images at study end point are shown. (C) Percentage (%) of tumor cells as calculated from hematoxylin and eosin–stained sections of livers from (B). (D) Normalized gene expression analysis of modulation of Stat6 mRNA expression in whole Hepa1-6 tumor livers from (B). (E) NanoString gene expression analysis as depicted by a volcano plot of changes in gene expression of exoASO-STAT6 versus exoASO-Scramble baseline from (B). (F) Graphical representation of changes in expression levels of Ccl17, Cd276, Myc, H2-K1, and Icos from (E). (G) Pathway score analysis of data in (E) as calculated by nSolver Analysis Software. Cell type score profiling of data in (E) as calculated by nSolver Analysis Software. (H) Representative images and quantification of F4/80 (macrophage) and iNOS expression, performed by immunofluorescence and IHC (immunohistochemistry) respectively, in Hepa1-6 tumor sections from (B). (I) Representative images and quantification of ASO localization in iNOS-positive, IBA1+ (M1), and iNOS-negative, IBA1+ (M2), macrophages. (J) Representative images and quantification of STAT6 expression in macrophages (IBA1+) within the tumor, cytotoxic T cells (CD8+), and regulatory T cells (FOXP3+) performed by immunofluorescence in Hepa1-6 tumor sections from (B). Data are means ± SEM. *P < 0.05, **P < 0.01, ***P < 0.001, and ****P < 0.0001. One-way ANOVA with Tukey’s multiple comparisons test (B to D, F, G, and J), Sidak’s multiple comparisons test (H), and unpaired two-tailed Student’s t test (I). DAPI, 4′,6-diamidino-2-phenylindole.
Fig. 6.
Fig. 6.. STAT6 macrophage signature correlates with poor disease prognosis.
(A) Spearman’s correlation heatmap of genes within a unique STAT6 macrophage signature and tumor inflammation signature (TIS), depicting a subset of 10 genes that are coherently expressed across the dataset. (B) Heatmap based on a unique STAT6 macrophage gene signature, depicting identification of three molecular subsets based on gene signature changes across patients with HCC, using a panel of immune cell markers (Tregs, B cells, macrophages, NK cells, and TIS) and a STAT6 macrophage gene signature. Data were generated using LIHC (Liver Hepatocellular Carcinoma) tumor samples from TCGA. Genes and samples have been hierarchically clustered on the basis of their gene expression pattern with Ward’s method. (C) Kaplan-Meier curves of overall survival probability in HCC, based on analysis of patients with high or low STAT6 macrophage gene signature. Results were generated using Kaplan-Meier plotter and log-rank Mantel-Cox test.
Fig. 7.
Fig. 7.. Model describing antitumor activity mediated by genetic reprogramming of TAMs by exoASO-STAT6.
STAT6 expressing TAMs are critical determinants of an immunosuppressive TME by promoting recruitment of Tregs and inhibition of CD8 cytotoxic T cells. The ability of exoASO-STAT6 to selectively knock down STAT6 expression in immunosuppressive TAMs results in effective reprogramming to an M1 phenotype that promotes the induction of a cytotoxic immune response and an antitumoral TME. TH2, T helper 2; CTL, cytotoxic T lymphocytes.

Similar articles

Cited by

References

    1. Schreiber R. D., Old L. J., Smyth M. J., Cancer immunoediting: Integrating immunity’s roles in cancer suppression and promotion. Science 331, 1565–1570 (2011). - PubMed
    1. Sharma P., Hu-Lieskovan S., Wargo J. A., Ribas A., Primary, adaptive, and acquired resistance to cancer immunotherapy. Cell 168, 707–723 (2017). - PMC - PubMed
    1. Pardoll D. M., The blockade of immune checkpoints in cancer immunotherapy. Nat. Rev. Cancer 12, 252–264 (2012). - PMC - PubMed
    1. Cassetta L., Kitamura T., Targeting tumor-associated macrophages as a potential strategy to enhance the response to immune checkpoint inhibitors. Front. Cell Dev. Biol. 6, 38 (2018). - PMC - PubMed
    1. Mantovani A., Marchesi F., Malesci A., Laghi L., Allavena P., Tumour-associated macrophages as treatment targets in oncology. Nat. Rev. Clin. Oncol. 14, 399–416 (2017). - PMC - PubMed

Publication types

Substances