. 2022 Feb 18;8(7):eabl8952.
doi: 10.1126/sciadv.abl8952. Epub 2022 Feb 18.

The role of the atypical chemokine receptor CCRL2 in myelodysplastic syndrome and secondary acute myeloid leukemia

Affiliations

The role of the atypical chemokine receptor CCRL2 in myelodysplastic syndrome and secondary acute myeloid leukemia

Theodoros Karantanos et al. Sci Adv. .

Abstract

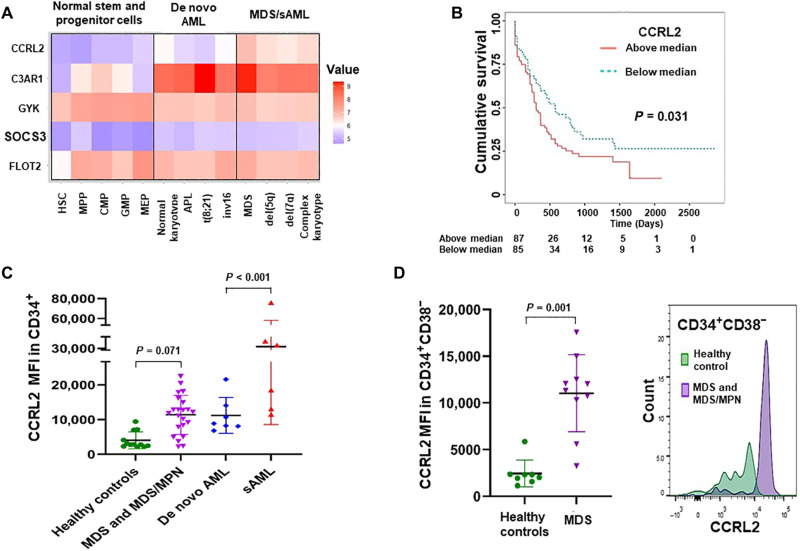
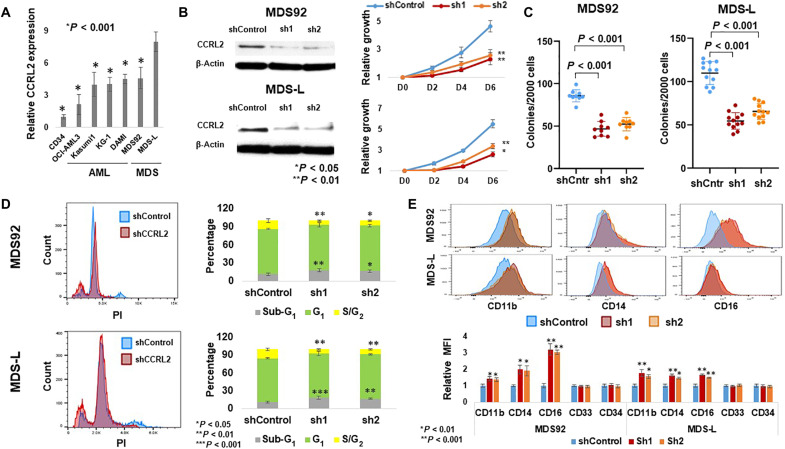
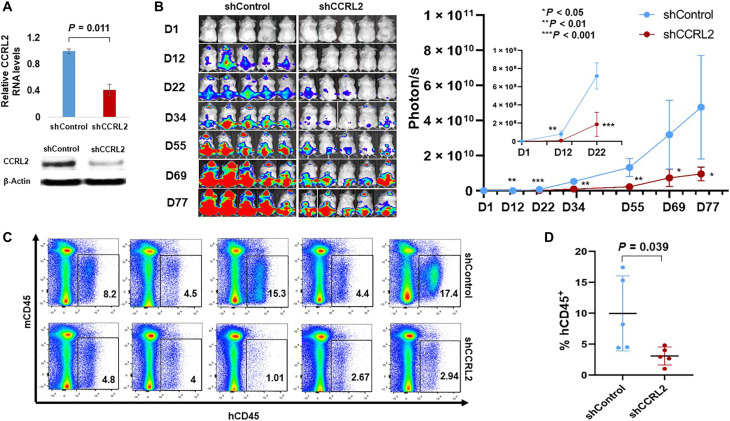
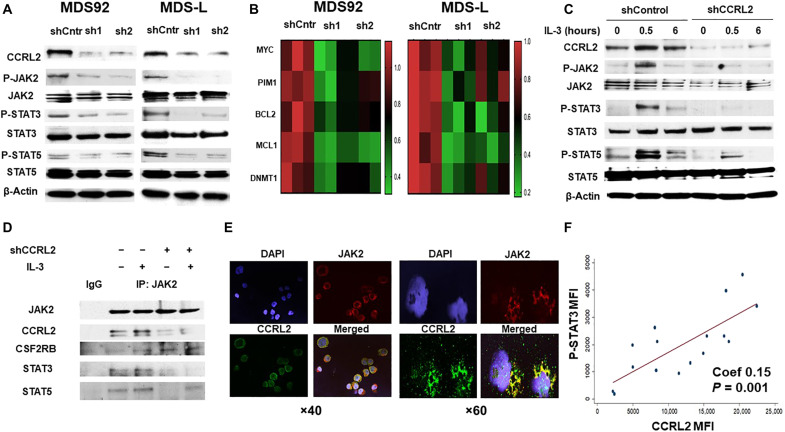
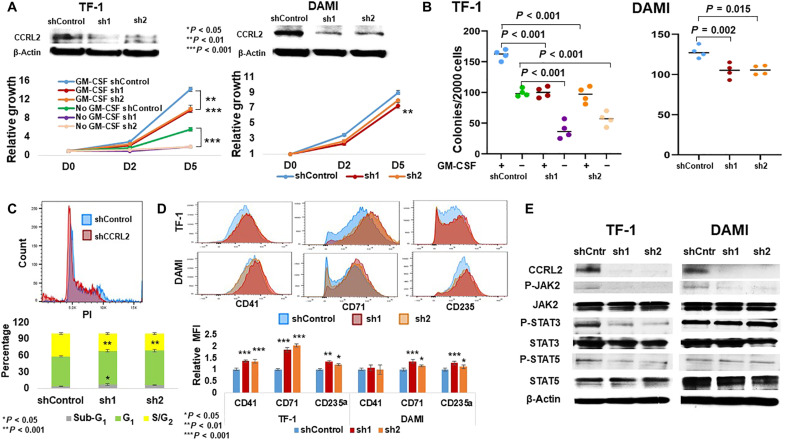
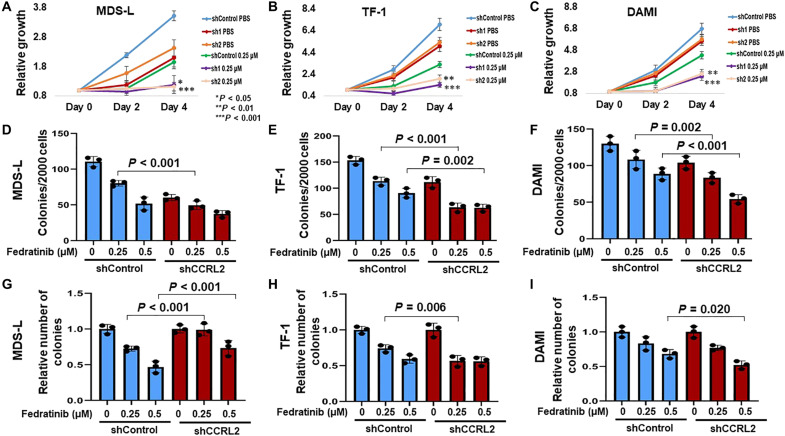
The identification of new pathways supporting the myelodysplastic syndrome (MDS) primitive cells growth is required to develop targeted therapies. Within myeloid malignancies, men have worse outcomes than women, suggesting male sex hormone-driven effects in malignant hematopoiesis. Androgen receptor promotes the expression of five granulocyte colony-stimulating factor receptor-regulated genes. Among them, CCRL2 encodes an atypical chemokine receptor regulating cytokine signaling in granulocytes, but its role in myeloid malignancies is unknown. Our study revealed that CCRL2 is up-regulated in primitive cells from patients with MDS and secondary acute myeloid leukemia (sAML). CCRL2 knockdown suppressed MDS92 and MDS-L cell growth and clonogenicity in vitro and in vivo and decreased JAK2/STAT3/STAT5 phosphorylation. CCRL2 coprecipitated with JAK2 and potentiated JAK2-STAT interaction. Erythroleukemia cells expressing JAK2V617F showed less effect of CCRL2 knockdown, whereas fedratinib potentiated the CCRL2 knockdown effect. Conclusively, our results implicate CCRL2 as an MDS/sAML cell growth mediator, partially through JAK2/STAT signaling.


Figures

Fig. 1.
Fig. 1.. CCRL2 is up-regulated in MDS and sAML cells.
(A) Comparison of the mRNA levels of the five AR-regulated genes CCRL2, C3AR1, GYK, SOCS3, and FLOT2 between healthy stem and progenitor cells, de novo AML (AMLs without MDS-related chromosomal abnormalities), MDS, and sAML (AMLs with MDS-related chromosomal abnormalities) based on data extracted from the BloodSpot database. CCRL2 is the only gene that is up-regulated in MDS and sAML compared with both healthy cells and de novo AMLs (P < 0.001). (B) Patients with AML with high CCRL2 expression (based on median expression) have significantly worse overall survival (P = 0.031) compared with patients with AML with low CCRL2 expression based on the TCGA dataset. (C) Analysis of the CCRL2 protein levels by flow cytometry showed that CD34+ cells from patients with MDS and MDS/MPN express relatively higher levels of CCRL2 (P = 0.071) compared with CD34+ cells from healthy controls. CD34+ blasts from patients with sAML express higher levels of CCRL2 compared with CD34+ blasts from patients with de novo AML (P < 0.001). (D) CCRL2 expression is higher in CD34+CD38 cells from patients with MDS compared with CD34+CD38 cells from healthy individuals (P = 0.001). Graphs show the mean value and SD of the mean value.
Fig. 2.
Fig. 2.. CCRL2 promotes the growth and clonogenicity of MDS cell lines.
(A) MDS-L cells express higher levels of CCRL2 compared with CD34+ cells from three separate healthy controls (P < 0.001), de novo AML [OCI-AML3 (P < 0.001) and Kasumi-1 (P < 0.001)], sAML cell lines [KG-1 (P < 0.001) and DAMI (P < 0.001)], and MDS92 cells (P < 0.001), n = 3. (B) CCRL2 knockdown suppressed the growth rate at 2 days (MDS92: P = 0.004-sh1, P = 0.040-sh2; MDS-L: P = 0.007-sh1, P = 0.038-sh2), 4 days (MDS92: P = 0.013-sh1, P = 0.033-sh2; MDS-L: P = 0.002-sh1, P = 0.007-sh2), and 6 days (MDS92: P = 0.003-sh1, P = 0.008-sh2; MDS-L: P = 0.009-sh1, P = 0.016-sh2), n = 3. (C) CCRL2 knockdown suppresses the clonogenic capacity of MDS92 (P < 0.001; n = 9) and MDS-L (P < 0.001; n = 12). Results show the mean value and SD of the mean value. (D) CCRL2 knockdown increases the percentage of apoptotic (sub-G1) MDS92 (P = 0.006-sh1, P = 0.021-sh2) and MDS-L cells (P = 0.002-sh1, P = 0.007-sh2) and decreases the percentage of MDS92 (P = 0.006-sh1, P = 0.017-sh2) and MDS-L cells (P < 0.001-sh1, P = 0.001-sh2) in the S-G2 phase. (E) CCRL2 knockdown increases the CD11b expression in MDS92 (P = 0.006-sh1, P = 0.004-sh2) and MDS-L cells (P < 0.001-sh1, P = 0.004-sh2), the CD14 expression in MDS92 (P = 0.003-sh1, P = 0.004-sh2) and MDS-L cells (P < 0.001-sh1, P < 0.001-sh2), and the CD16 expression in MDS92 (P < 0.001) and MDS-L cells (P < 0.001). n = 3.
Fig. 3.
Fig. 3.. CCRL2 knockdown suppresses the engraftment and growth of MDS-L cells in NSGS mice.
(A) MDS-L cells transduced with shControl or shCCRL2 shRNAs were treated for 10 days with puromycin, and their CCRL2 expression was assessed by RNA and protein. MDS-L cells transduced with shCCRL2 expressed significantly lower levels of CCRL2 RNA (P = 0.011) and protein (P = 0.006). (B) MDS-L cells with normal or suppressed CCRL2 were transduced with a GFP+/Luciferase dual reporter retrovirus and injected to NSGS mice. The bioluminescence signal in mice injected with MDS-L with suppressed CCRL2 was significantly lower at 12 (P = 0.0016), 22 (P = 0.0002), 34 (P = 0.0010), 55 (P = 0.0017), 69 (P = 0.0259), and 77 days (P = 0.0212) after the injection. (C) MDS-L burden in the bone marrow of NSGS mice was significantly lower in mice injected with MDS-L cells with suppressed CCRL2 (P = 0.039). Results depict the mean value and SD of the mean value.
Fig. 4.
Fig. 4.. CCRL2 affects JAK2/STAT signaling in MDS cells.
(A) Representative Western blotting showing CCRL2 knockdown effect by two different shRNAs (sh1 and sh2) on JAK2 (Tyr1007/1008), STAT3 (Tyr105), and STAT5 (Tyr694) phosphorylation in MDS92 and MDS-L. (B) CCRL2 knockdown decreases the RNA levels of the JAK2/STAT target genes: MYC (MDS92: P = 0.001-sh1, P = 0.002-sh2; MDS-L: P = 0.001-sh1, P = 0.010-sh2), PIM1 (MDS92: P = 0.003-sh1, P = 0.010-sh2; MDS-L: P = 0.002-sh1, P = 0.040-sh2), BCL2 (MDS92: P = 0.020-sh1, P = 0.060-sh2; MDS-L: P = 0.008-sh1, P = 0.005-sh2), MCL1 (MDS92: P = 0.025-sh1, P = 0.004-sh2; MDS-L: P = 0.004-sh1, P = 0.019-sh2), and DNMT1 (MDS92: P = 0.009-sh1, P = 0.010-sh2; MDS-L: P = 0.008-sh1, P = 0.040-sh2), n = 3. (C) Western blotting showing that CCRL2 knockdown suppresses the phosphorylation of JAK2, STAT3, and STAT5 at 30 min and 6 hours of IL-3 (20 ng/ml) treatment following 48 hours of IL-3 starvation. (D) Coimmunoprecipitation assay showing that CCRL2 precipitates with JAK2 and that CCRL2 knockdown does not affect the interaction between JAK2 and the common β signal transducing subunit of CD123 (CSF2RB) but decreases the interaction between JAK2 and STAT3/5 proteins. IgG, immunoglobulin G. (E) Representative images from immunofluorescence staining (×40 and ×60 magnification) showing localization of CCRL2 (green) in the cytoplasm and membrane of MDS-L cells. Confocal microscopy reveals areas of colocalization with JAK2 (red). DAPI, 4′,6-diamidino-2-phenylindole. (F) The mean fluorescence intensity (MFI) of phosphorylated STAT3 (P-STAT3) is positively associated with the MFI of CCRL2 in CD34+ cells from patients with MDS and CD34+ blasts from patients with AML (Coef, 0.15; P = 0.001), n = 16.
Fig. 5.
Fig. 5.. CCRL2 knockdown affects the growth and clonogenicity of erythroleukemia cell lines.
(A) CCRL2 knockdown with two different lentiviruses significantly suppresses the growth of TF-1 cells in the presence (P < 0.001) and absence of GM-CSF (P < 0.001). CCRL2 knockdown with two different lentiviruses suppresses at a lower extent the growth of DAMI cells (P = 0.009-sh1, P = 0.058-sh2). (B) CCRL2 knockdown with two different lentiviruses decreases the colony formation of TF-1 cells in the presence (P < 0.001) and absence of GM-CSF (P < 0.001). CCRL2 knockdown with two different lentiviruses decreases the colony formation of DAMI cells (P = 0.002-sh1, P = 0.015-sh2) at a lower extent compared with TF-1 cells. (C) CCRL2 knockdown with sh1 increased the percentage of apoptotic TF-1 cells (P = 0.015-sh1, P = 0.097-sh2), and CCRL2 knockdown with the two lentiviruses decreased the percentage of TF-1 cells in the G2-S phase (P < 0.001). (D) CCRL2 knockdown with two different lentiviruses increases the expression of CD41 (P < 0.001), CD71 (P < 0.001), and CD235a (P = 0.002-sh1, P = 0.025-sh2). CCRL2 knockdown does not affect the expression of CD41 (P = 0.230-sh1, P = 0.912-sh2). CCRL2 knockdown increases the expression of CD71 (P < 0.001-sh1, P = 0.026-sh2) and CD235a (P = 0.002-sh1, P = 0.067-sh2). (E) Western blotting showing the effect of CCRL2 knockdown in the JAK2/STAT signaling in TF-1 and DAMI cells. CCRL2 knockdown suppresses the phosphorylation of JAK2, STAT3, and STAT5 in TF-1 cells. CCRL2 knockdown decreases the phosphorylation of JAK2 but does not affect the phosphorylation of STAT3 and STAT5 in DAMI cells.
Fig. 6.
Fig. 6.. CCRL2 knockdown alters the efficacy of JAK2 inhibition by the selective inhibitor fedratinib.
(A) CCRL2 knockdown increases the antiproliferative effect of 0.25 μΜ fedratinib (P = 0.033-sh1, P = 0.001-sh2) in MDS-L cells. (B) CCRL2 knockdown increases the antiproliferative effect of 0.25 μΜ fedratinib in TF-1 cells (P < 0.001-sh1, P = 0.002-sh2). (C) CCRL2 knockdown increases the antiproliferative effect of 0.25 μΜ fedratinib (P < 0.001-sh1, P = 0.001-sh2) in DAMI cells. (D) CCRL2 knockdown increases the anticlonogenic effect of 0.25 μΜ fedratinib (P < 0.001) in MDS-L cells. (E) CCRL2 knockdown increases the anticlonogenic effect of 0.25 μΜ (P < 0.001) and 0.5 μΜ fedratinib (P < 0.002) in TF-1 cells. (F) CCRL2 knockdown increases the anticlonogenic effect of 0.25 μΜ (P = 0.002) and 0.5 μΜ fedratinib (P < 0.001) in DAMI cells. (G) The clonogenicity inhibitory effect of fedratinib is decreased in MDS-L cells with suppressed CCRL2 (P < 0.001). (H) The clonogenicity inhibitory effect of 0.25 μΜ fedratinib is increased in TF-1 cells with suppressed CCRL2 (P = 0.006). (I) The clonogenicity inhibitory effect of 0.25 μΜ fedratinib is increased in TF-1 cells with suppressed CCRL2 (P = 0.020). *P < 0.05, **P < 0.01, and ***P < 0.001.

References

    1. Stevens B. M., Khan N., D’Alessandro A., Nemkov T., Winters A., Jones C. L., Zhang W., Pollyea D. A., Jordan C. T., Characterization and targeting of malignant stem cells in patients with advanced myelodysplastic syndromes. Nat. Commun. 9, 3694 (2018). - PMC - PubMed
    1. Shastri A., Will B., Steidl U., Verma A., Stem and progenitor cell alterations in myelodysplastic syndromes. Blood 129, 1586–1594 (2017). - PMC - PubMed
    1. Hanumanthu V. S., Pirruccello S. J., GCSF-R expression in myelodysplastic and myeloproliferative disorders and blast dysmaturation in CML. Am. J. Clin. Pathol. 140, 155–164 (2013). - PubMed
    1. Lee H. J., Daver N., Kantarjian H. M., Verstovsek S., Ravandi F., The role of JAK pathway dysregulation in the pathogenesis and treatment of acute myeloid leukemia. Clin. Cancer Res. 19, 327–335 (2013). - PubMed
    1. Wang F., Ni J., Wu L., Wang Y., He B., Yu D., Gender disparity in the survival of patients with primary myelodysplastic syndrome. J. Cancer 10, 1325–1332 (2019). - PMC - PubMed

Publication types