Meta-Analysis
. 2022 Feb 18;8(7):eabi7127.
doi: 10.1126/sciadv.abi7127. Epub 2022 Feb 18.

The histone demethylase PHF8 regulates TGFβ signaling and promotes melanoma metastasis

Affiliations
Meta-Analysis

The histone demethylase PHF8 regulates TGFβ signaling and promotes melanoma metastasis

Rana S Moubarak et al. Sci Adv. .

Abstract

The contribution of epigenetic dysregulation to metastasis remains understudied. Through a meta-analysis of gene expression datasets followed by a mini-screen, we identified Plant Homeodomain Finger protein 8 (PHF8), a histone demethylase of the Jumonji C protein family, as a previously unidentified prometastatic gene in melanoma. Loss- and gain-of-function approaches demonstrate that PHF8 promotes cell invasion without affecting proliferation in vitro and increases dissemination but not subcutaneous tumor growth in vivo, thus supporting its specific contribution to the acquisition of metastatic potential. PHF8 requires its histone demethylase activity to enhance melanoma cell invasion. Transcriptomic and epigenomic analyses revealed that PHF8 orchestrates a molecular program that directly controls the TGFβ signaling pathway and, as a consequence, melanoma invasion and metastasis. Our findings bring a mechanistic understanding of epigenetic regulation of metastatic fitness in cancer, which may pave the way for improved therapeutic interventions.


Figures
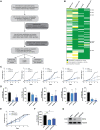
Fig. 1.
Fig. 1.. Loss-of-function targeted mini-screen identifies a role for PHF8 in melanoma invasion.
(A) Schematic illustration of the strategy to identify chromatin-related genes specifically involved in melanoma metastasis and their downstream targets. (B) Data mining of four human gene expression datasets [Talantov et al. (GSE3189), Riker et al. (GSE7553), Xu et al. (GSE8401) and Kabbarah et al. (GSE46517)] shows a significant up-regulation of 151 chromatin-related genes in metastatic versus primary melanoma tumors in at least two of four datasets. Six genes were selected for a loss-of-function proliferation and invasion mini-screen. (C) Proliferation and (D) invasion assays were performed in SKMEL-147 cells transduced with two different shRNAs per chromatin-related genes (CBX2/4/8, PCGF2, and CHD3); *P < 0.05, **P < 0.01, ***P < 0.001 and *****P < 0.00001. (E) PHF8 knockdown did not impair SKMEL-147 proliferation (shPHF8 R1 versus shScr, P = 0.22; shPHF8 R2 versus shScr, P = 0.49) (F) but inhibited invasion (shPHF8 R1 versus shScr, P = 0.005; shPHF8 R2 versus shScr, P = 0.01). (G) Efficient PHF8 knockdown was assessed by Western blot. Error bars indicate average ± SD. ns, not significant; A.U., arbitrary units.
Fig. 2.
Fig. 2.. PHF8 gene silencing inhibits invasion but not proliferation in vitro.
(A) Efficient PHF8 knockout using two different sgRNAs in four different melanoma cell lines was determined by Western blot. The membrane was reblotted with tubulin antibody for loading control. (B) Proliferation curves of cells seeded 3 days after infection with sgRNA-carrying lentiviral particles targeting PHF8. (C) Invasion assay of cells seeded 3 days after infection with sgRNA-containing lentiviral particles, using Fluoroblok transwell chambers coated with Matrigel. PHF8 knockout significantly inhibits melanoma invasion in SKMEL-147 (sgPHF8 #1 versus sgScr, P = 0.003; sgPHF8 #3 versus sgScr, P = 0.0007), 501Mel (sgPHF8 #1 versus sgScr, P = 0.0003; sgPHF8 #3 versus sgScr, P = 0.002), A375 (sgPHF8 #1 versus sgScr, P = 0.003; sgPHF8 #3 versus sgScr, P = 0.006), and 451Lu cells (sgPHF8 #1 versus sgScr, P = 0.0001; sgPHF8 #3 versus sgScr, P = 0.003). (D) Representative pictures of the Fluoroblok transwell inserts stained with Calcein AM to quantify invading cells in (C). Scale bars, 400 μm. (E) PHF8 expression was restored in SKMEL-147 cells upon infection of cells previously transduced with sgScr, sgPHF8 #1, or sgPHF8 #3 with Empty or FLAG-HA-PHF8 overexpressing lentiviral particles. Membrane blotting with anti-PHF8 shows both sgRNA efficiency and PHF8 overexpression. Exogenous PHF8 expression was assessed by Western blot of the FLAG tag. (F) Invasion assay demonstrates that ectopic PHF8 expression restores the invasive potential of PHF8 knockout cells (sgPHF8 #1 versus sgScr, P = 0.048; sgPHF8 #3 versus sgScr, P = 0.039; sgPHF8 #1 + PHF8 WT versus sgPHF8 #1 + Empty, P = 0.026; sgPHF8 #3 + PHF8 WT versus sgPHF8 #3 + Empty, P = 0.014). Error bars indicate average ± SD. Representative data from three independent experiments conducted in each cell line are shown. (G) SKMEL-147 cells transduced as indicated were analyzed for H4K20me1 global levels by immunoblotting. H4 blot serves as a control for protein loading. Band intensity relative to sgScr condition is shown.
Fig. 3.
Fig. 3.. PHF8 expression is associated with metastasis in melanoma patient samples.
(A) PHF8 protein levels in cultured human epidermal melanocytes (neonatal, HEM-M and HEM-D; adult NHEM and HEM-A), primary and metastatic human melanoma cell lines, detected by Western blot. Actin blotting was used as loading control. (B) Dot plot of PHF8 expression in primary (n = 103) and metastatic (n = 369) samples of TCGA, showing a significant up-regulation of PHF8 mRNA expression in metastatic versus primary melanoma tumors (P < 0.0001). (C) Immunochemistry staining of PHF8 in melanoma tumor samples from an independent NYU Langone Health cohort (primary n = 67 and metastasis n = 46; P = 0.002 for PHF8 high tumor percentage staining/intensity in metastatic versus primary; Mann-Whitney test). Staining was scored according to the intensity (0 to 1+ to 2+) and distribution (percentage of tumor with positive staining). (D) Representative images of different staining intensities of PHF8 immunostaining are shown for primary and metastatic patients’ samples. Scale bar, 100 μm. (E) PHF8 expression in 22 metastatic melanoma cases and their patient-matched primary tumors, assessed by PHF8 immunohistochemistry (P = 0.0004, two-tailed paired t test).
Fig. 4.
Fig. 4.. PHF8 knockout in melanoma cells inhibits metastasis in vivo.
(A) Schematic representation of the in vivo metastasis assay: 451Lu cells stably expressing luciferase for in vivo bioluminescence imaging and Cas9 were transduced with control (sgScr) or PHF8 sgRNA (sgPHF8#1 and sgPHF8 #3) lentiviral particles carrying a green fluorescent protein (GFP) reporter and subcutaneously injected into NOD/Scid/IL2γRnull female mice. (B) PHF8 knockout does not affect tumor growth (sgPHF8 #1 versus sgScr, P = 0.12; sgPHF8 #3 versus sgScr, P = 0.06) (C) or tumor mass (sgPHF8 #1 versus sgScr, P = 0.17; sgPHF8 #3 versus sgScr, P = 0.06) at termination of the experiment. (D) PHF8 knockout inhibits melanoma metastasis to the lungs. Tumor burden was measured by bioluminescent imaging (IVIS) of dissected lungs 5 min after mouse euthanasia. (sgPHF8 #1 versus sgScr, P = 0.029; sgPHF8 #3 versus sgScr, P = 0.023). Error bars indicate mean ± SD. (E) Lung sections were sliced at three different levels, followed by H&E staining, and the number of micrometastatic foci was counted by a pathologist (sgPHF8 #1 versus sgScr, P = 0.015; sgPHF8 #3 versus sgScr, P = 0.045). (F) Representative images of lungs acquired with a dissecting scope before fixation allow visualizing GFP-expressing melanoma metastatic foci. (G) Hematoxylin and eosin (H&E)–stained sections of lungs resected at termination. Inset displays a metastatic lesion in the sgScr group.
Fig. 5.
Fig. 5.. PHF8 histone demethylase activity is required for its proinvasive function.
(A) Left: Lentiviral constructs encoding for FLAG-HA tagged PHF8 WT, F279S, and Y14A/W29A. Right: Immunoblotting of H4K20me1 in 113/6-4L overexpressing PHF8 WT or PHF8 mutants. H4 Western blot serves as loading control. Band intensity relative to Empty condition is shown. (B) Efficient overexpression of PHF8 WT and mutant constructs in three cell lines was determined by Western blot using HA and PHF8 antibodies. (C) Proliferation and (D) Invasion assays were performed in 451Lu (top: PHF8 WT versus Empty, P = 0.002; PHF8 F279S versus Empty, P = 0.42; PHF8 Y14A/W29A versus Empty, P = 0.43), Colo-679 (middle: PHF8 WT versus Empty, P = 0.004; PHF8 F279S versus Empty, P = 0.91; PHF8 Y14A/W29A versus Empty, P = 0.13), and 113/6-4L cells (bottom: PHF8 WT versus Empty, P = 0.0004; PHF8 F279S versus PHF8 WT, P = 0.002; PHF8 Y14A/W29A versus PHF8 WT, P = 0.005). (E) Efficient overexpression of PHF8 WT and mutant constructs in SKMEL-147 cells previously transduced with sgScr or sgPHF8 #3 was determined by Western blot. (F) Invasion assay shows that ectopic PHF8 WT expression, but not the mutant constructs, restores the invasive potential of PHF8 knockout SKMEL-147 cells (sgPHF8 #1 + Empty versus sgScr + Empty, P = 0.005; sgPHF8 #1 + PHF8 WT versus sgPHF8 #1 + Empty, P = 0.002; sgPHF8 #1 + PHF8 F279S versus sgPHF8 #1 + Empty, P = 0.14; sgPHF8 #1 + PHF8 Y14A/W29A versus sgPHF8 #1 + Empty, P = 0.089; sgPHF8 #3 + Empty versus sgScr + Empty, P = 0.004; sgPHF8 #3 + PHF8 WT versus sgPHF8 #3 + Empty, P = 0.004; sgPHF8 #3 + PHF8 F279S versus sgPHF8 #3 + Empty, P = 0.69; sgPHF8 #3 + PHF8 Y14A/W29A versus sgPHF8 #3 + Empty, P = 0.098). Error bars indicate average ± SD. Representative data of three independent experiments conducted are shown. Western blot membranes were reblotted with tubulin antibody for loading control.
Fig. 6.
Fig. 6.. PHF8 directly modulates metastasis-related genes.
(A) Heatmap representation of ChIP-seq binding for PHF8 peaks on 1-kb flanked TSS regions, using seqMiner. Input is shown as a negative control for enrichment. (B) Genome-wide distribution of PHF8 on active (H3K9me3)/inactive (H3K9me3/H3K27me3) promoters, gene bodies (excluding flanked TSS regions), enhancers (H3K27Ac/H3K4me1), and intergenic regions (excluding all of the above) by overlapping PHF8 ChIP-seq with H3K9me3, H3K4me1, H3K27Ac, and H3K27me3 ChIP-seq performed in SKMEL-147 cells (60). (C) RNA-seq was performed in SKMEL-147 transduced with sgScr or PHF8 sgRNAs. Scatterplots of gene expression versus fold change (log2) expression between sgPHF8- and sgScr-transduced cells. Genes significantly modulated in sgPHF8 versus sgScr cells are depicted in red. (D) Top biological pathways modulated by PHF8 are identified using the Ingenuity Pathway. The vertical line represents the significance threshold (P value of 0.05). PCP, phencyclidine; NF-κB, nuclear factor κB; BMP, bone morphogenetic protein; mTOR, mammalian target of rapamycin; PTEN, phosphatase and tensin homolog; HMGB1, high mobility group box 1. (E) Heatmap of genes involved in the TGFβ signaling pathway and significantly regulated by PHF8 based on RNA-seq data as described in (C) and (D). Rows represent normalized counts per gene. VEGFA, vascular endothelial growth factor A; TGIF, TGFB induced factor homeobox 1; INHBA, inhibin subunit beta A. (F) Venn diagram overlapping ChIP-seq targets and PHF8-modulated genes (RNA-seq) identifies direct PHF8 targets in melanoma, encompassing metastasis-related genes. (G) ChIP-seq tracks of PHF8 binding to the TSS of direct targets that are TGFβ genes. (H) H4K20me1 and H3K9me1 ChIP experiments followed by qPCR of TGFB1, TGFBR1, and TGFBR2 regions bound by PHF8 were performed in SKMEL-147 transduced with sgPHF8 #1, sgPHF8 #3, or scrambled control (sgScr): H4K20me1 ChIP TGFB1 qPCR (sgPHF8 #1 versus sgScr, P = 0.000003; sgPHF8 #3 versus sgScr, P = 0.030), H4K20me1 ChIP TGFBR1 qPCR (sgPHF8 #1 versus sgScr, P = 0.000098; sgPHF8 #3 versus sgScr, P = 0.032), H4K20me1 ChIP TGFBR2 qPCR (sgPHF8 #1 versus sgScr, P = 0.002; sgPHF8 #3 versus sgScr, P = 0.16), H3K9me1 ChIP TGFB1 qPCR (sgPHF8 #1 versus sgScr, P = 0.0001; sgPHF8 #3 versus sgScr, P = 0.0007), H3K9me1 ChIP TGFBR1 qPCR (sgPHF8 #1 versus sgScr, P = 0.0001; sgPHF8 #3 versus sgScr, P = 0.007), and H3K9me1 ChIP TGFBR2 qPCR (sgPHF8 #1 versus sgScr, P = 0.1; sgPHF8 #3 versus sgScr, P = 0.03). IgG, immunoglobulin G.
Fig. 7.
Fig. 7.. PHF8 directly targets TGFβ pathway activation, which is required for melanoma invasion.
(A) P-SMAD2 Western blot shows down-regulation of TGFβ signaling upon PHF8 knockout in SKMEL-147 and 113/6-4L cells. (B) SKMEL-147 cells were transduced as indicated, along with an SBE luciferase reporter lentivirus. Top: Luciferase assay shows significant reduction in SMAD activity upon PHF8 knockout (sgPHF8 #1 versus sgScr, P = 0.002; sgPHF8 #3 versus sgScr, P = 0.002). Bottom: SKMEL-147 cells transduced as in the left panel were serum-deprived overnight before treatment with TGFβ (10 ng/ml) or galunisertib (10 μM) for 12 hours, followed by measurement of SMAD activity by luciferase assay. (C) P-SMAD2 Western blot shows induction of TGFβ signaling in Colo-679 and 113/6-4L cells overexpressing PHF8 WT, but not PHF8 mutant forms, as compared to their Empty-transduced control. (D) Colo-679 and 113/6-4L cells transduced with PHF8 WT or Empty lentiviral particles were treated with TGFβ inhibitors galunisertib or SB431542 (10 μM) for 24 hours before invasion assays were performed. [Colo-679: PHF8 WT versus Empty (without galunisertib), P = 0.001; PHF8 WT + galunisertib versus PHF8 WT (without galunisertib), P = 0.003; PHF8 WT versus Empty (without SB431542), P = 0.00001; PHF8 WT + SB431542 versus PHF8 WT (without SB431542), P = 0.002] and [113/6-4L: PHF8 WT versus Empty (without galunisertib), P = 0.0005; PHF8 WT + galunisertib versus PHF8 WT (without galunisertib), P = 0.001; PHF8 WT versus Empty (without SB431542), P = 0.0017; PHF8 WT + SB431542 versus PHF8 WT (without SB431542), P = 0.0017]. (E) Western blot of cell lysates from 113/6-4L cells transduced with Cas9-KRAB and Empty or PHF8 overexpressing lentiviral particles, followed by sgTGFBR2 #A or sgScr transduction. TGFBR2 silencing efficiently suppresses P-SMAD2 induction by PHF8. (F) The invasive potential of cells shown in (E) was assessed. PHF8-induced invasion is rescued by the inhibition of the TGFβ pathway via TGFBR2 depletion (PHF8 WT + sgScr versus Empty + sgScr, P = 0.000006; PHF8 WT + sgTGFBR2 versus PHF8 WT + sgScr, P = 0.0004). (G) Western blot analyses in 113/6-4L cells treated with galunisertib (H) or transduced with sgRNAs targeting TGFBR2 show that inhibition of the TGFβ pathway does not reduce PHF8 endogenous levels. Error bars indicate average ± SD. Representative data of three independent experiments are shown.
Fig. 8.
Fig. 8.. Schematic of PHF8 molecular mechanism during melanoma progression.

Similar articles

Cited by

References

    1. Chaffer C. L., Weinberg R. A., A perspective on cancer cell metastasis. Science 331, 1559–1564 (2011). - PubMed
    1. Massague J., Obenauf A. C., Metastatic colonization by circulating tumour cells. Nature 529, 298–306 (2016). - PMC - PubMed
    1. Bailey M. H., Tokheim C., Porta-Pardo E., Sengupta S., Bertrand D., Weerasinghe A., Colaprico A., Wendl M. C., Kim J., Reardon B., Ng P. K.-S., Jeong K. J., Cao S., Wang Z., Gao J., Gao Q., Wang F., Liu E. M., Mularoni L., Rubio-Perez C., Nagarajan N., Cortés-Ciriano I., Zhou D. C., Liang W.-W., Hess J. M., Yellapantula V. D., Tamborero D., Gonzalez-Perez A., Suphavilai C., Ko J. Y., Khurana E., Park P. J., Van Allen E. M., Liang H.; MC3 Working Group; Cancer Genome Atlas Research Network, Lawrence M. S., Godzik A., Lopez-Bigas N., Stuart J., Wheeler D., Getz G., Chen K., Lazar A. J., Mills G. B., Karchin R., Ding L., Comprehensive characterization of cancer driver genes and mutations. Cell 173, 371–385.e18 (2018). - PMC - PubMed
    1. Hodis E., Watson I. R., Kryukov G. V., Arold S. T., Imielinski M., Theurillat J. P., Nickerson E., Auclair D., Li L., Place C., DiCara D., Ramos A. H., Lawrence M. S., Cibulskis K., Sivachenko A., Voet D., Saksena G., Stransky N., Onofrio R. C., Winckler W., Ardlie K., Wagle N., Wargo J., Chong K., Morton D. L., Stemke-Hale K., Chen G., Noble M., Meyerson M., Ladbury J. E., Davies M. A., Gershenwald J. E., Wagner S. N., Hoon D. S. B., Schadendorf D., Lander E. S., Gabriel S. B., Getz G., Garraway L. A., Chin L., A landscape of driver mutations in melanoma. Cell 150, 251–263 (2012). - PMC - PubMed
    1. Ferretti R., Bhutkar A., McNamara M. C., Lees J. A., BMI1 induces an invasive signature in melanoma that promotes metastasis and chemoresistance. Genes Dev. 30, 18–33 (2016). - PMC - PubMed

Publication types

MeSH terms