. 2022 Feb 18;8(7):eabl3825.
doi: 10.1126/sciadv.abl3825. Epub 2022 Feb 18.

Neighborhood socioeconomic inequality based on everyday mobility predicts COVID-19 infection in San Francisco, Seattle, and Wisconsin

Affiliations

Neighborhood socioeconomic inequality based on everyday mobility predicts COVID-19 infection in San Francisco, Seattle, and Wisconsin

Brian L Levy et al. Sci Adv. .

Abstract

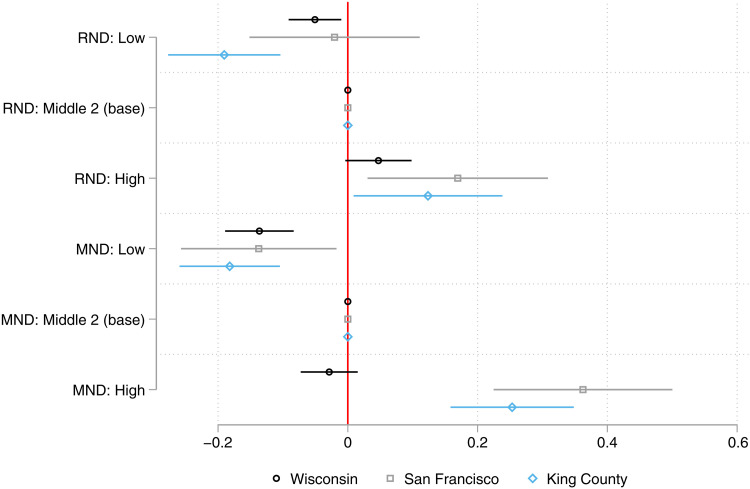
Race and class disparities in COVID-19 cases are well documented, but pathways of possible transmission by neighborhood inequality are not. This study uses administrative data on COVID-19 cases for roughly 2000 census tracts in Wisconsin, Seattle/King County, and San Francisco to analyze how neighborhood socioeconomic (dis)advantage predicts cumulative caseloads through February 2021. Unlike past research, we measure a neighborhood's disadvantage level using both its residents' demographics and the demographics of neighborhoods its residents visit and are visited by, leveraging daily mobility data from 45 million mobile devices. In all three jurisdictions, we find sizable disparities in COVID-19 caseloads. Disadvantage in a neighborhood's mobility network has greater impact than its residents' socioeconomic characteristics. We also find disparities by neighborhood racial/ethnic composition, which can be explained, in part, by residential and mobility-based disadvantage. Neighborhood conditions measured before a pandemic offer substantial predictive power for subsequent incidence, with mobility-based disadvantage playing an important role.


Figures

Fig. 1.
Fig. 1.. Map of San Francisco neighborhood proportions COVID-19 positive by RND and MND quartiles.
Note that COVID-19 cases per 1000 resident population range from 4.4 to 182.5. Dots are scaled proportionally to a tract’s incidence.
Fig. 2.
Fig. 2.. Parameter estimates for the adjusted association between ND indicators and COVID-19 case count by location.
Note that coefficients are estimated in the main model for each location: Table 1, model 6 for Wisconsin; table S4, model 5 for San Francisco; and table S5, model 5 for King County. Error bars represent 95% confidence intervals.
Fig. 3.
Fig. 3.. Average adjusted predicted COVID-19–positive cases by ND indicators from the main model for each location.
Note that error bars represent 90, 95, and 99% confidence intervals. Predictions are based on the main model for each location and hold covariates at their observed values.
Fig. 4.
Fig. 4.. Mediation of the relationship between tract percent Black and COVID-19 caseload by RND and MND.
Note that full results from mediation models appear in the Supplementary Materials. Estimated total effects are on the risk ratio scale and based on location-specific 5th and 95th percentiles of tract proportion Black. For Wisconsin (excluding Milwaukee), Milwaukee, San Francisco, and King County, those contrasts are 0 versus 0.122, 0.005 versus 0.915, 0 versus 0.179, and 0 versus 0.240, respectively.
Fig. 5.
Fig. 5.. Mediation of the relationship between tract percent Hispanic and COVID-19 caseload by RND and MND.
Note that full results from mediation models appear in the Supplementary Materials. Estimated total effects are on the risk ratio scale and based on location-specific 5th and 95th percentiles of tract proportion Hispanic. For Wisconsin (excluding Milwaukee), Milwaukee, San Francisco, and King County, those contrasts are 0.004 versus 0.169, 0.007 versus 0.729, 0.042 versus 0.397, and 0.021 versus 0.268, respectively.

Similar articles

Cited by

References

    1. Anand S., Montez-Rath M., Han J., Bozeman J., Kerschmann R., Beyer P., Parsonnet J., Chertow G. M., Prevalence of SARS-CoV-2 antibodies in a large nationwide sample of patients on dialysis in the USA: A cross-sectional study. Lancet 396, 1335–1344 (2020). - PMC - PubMed
    1. Tai D. B. G., Shah A., Doubeni C. A., Sia I. G., Wieland M. L., The disproportionate impact of COVID-19 on racial and ethnic minorities in the United States. Clin. Infect. Dis. 72, 703–706 (2021). - PMC - PubMed
    1. Link B. G., Phelan J., Social conditions as fundamental causes of disease. J. Health Soc. Behav. 35, 80 (1995). - PubMed
    1. I. Kawachi, L. F. Berkman, Neighborhoods and Health (Oxford Univ. Press, 2003).
    1. Carrión D., Colicino E., Pedretti N. F., Arfer K. B., Rush J., Defelice N., Just A. C., Neighborhood-level disparities and subway utilization during the COVID-19 pandemic in New York City. Nat. Commun. 12, 3692 (2021). - PMC - PubMed