. 2022 Mar 8;55(3):405-422.e11.
doi: 10.1016/j.immuni.2022.01.016. Epub 2022 Feb 17.

Clonal lineage tracing reveals shared origin of conventional and plasmacytoid dendritic cells

Affiliations

Clonal lineage tracing reveals shared origin of conventional and plasmacytoid dendritic cells

Jue Feng et al. Immunity. .

Abstract

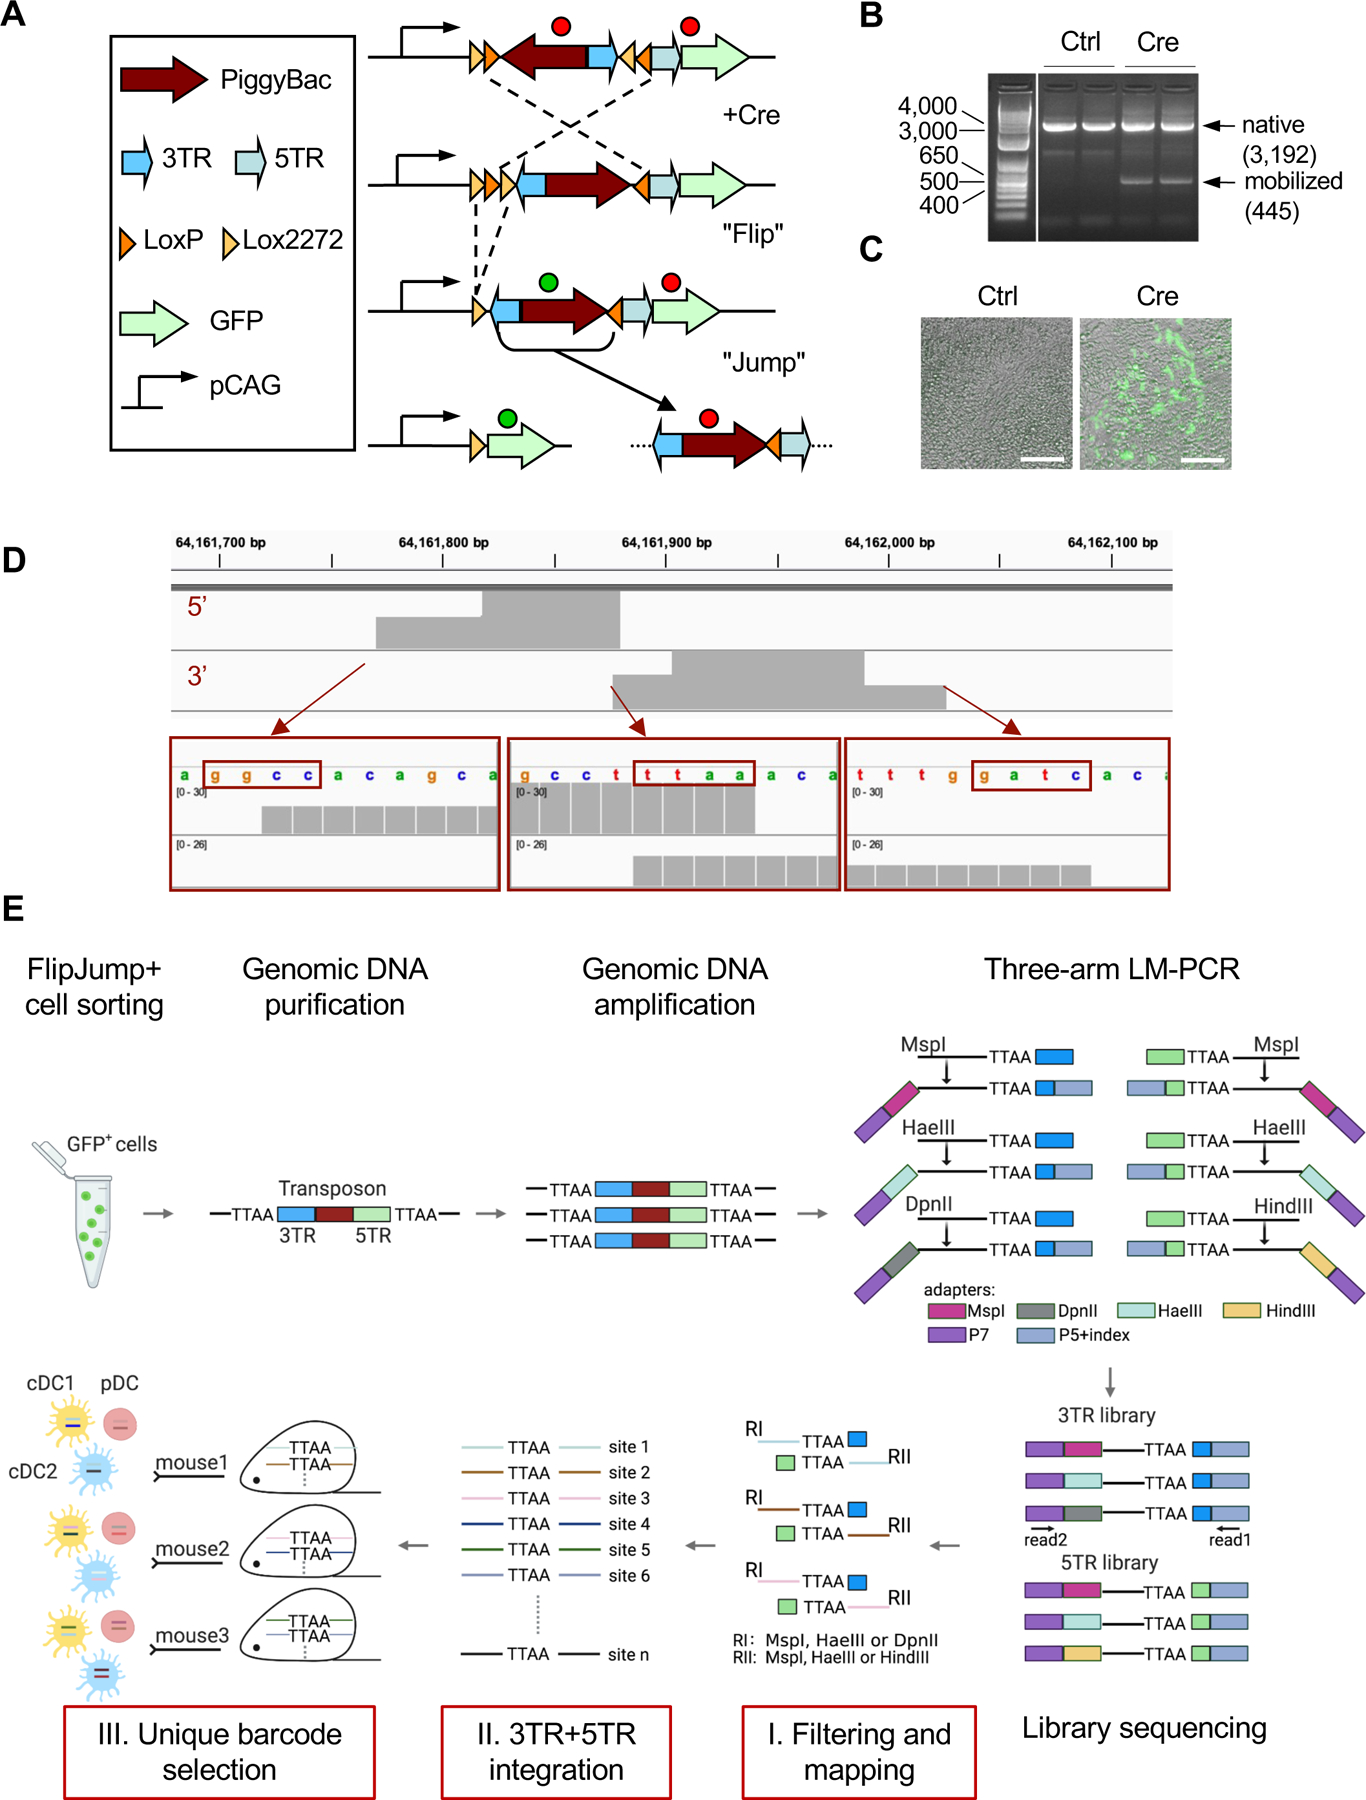
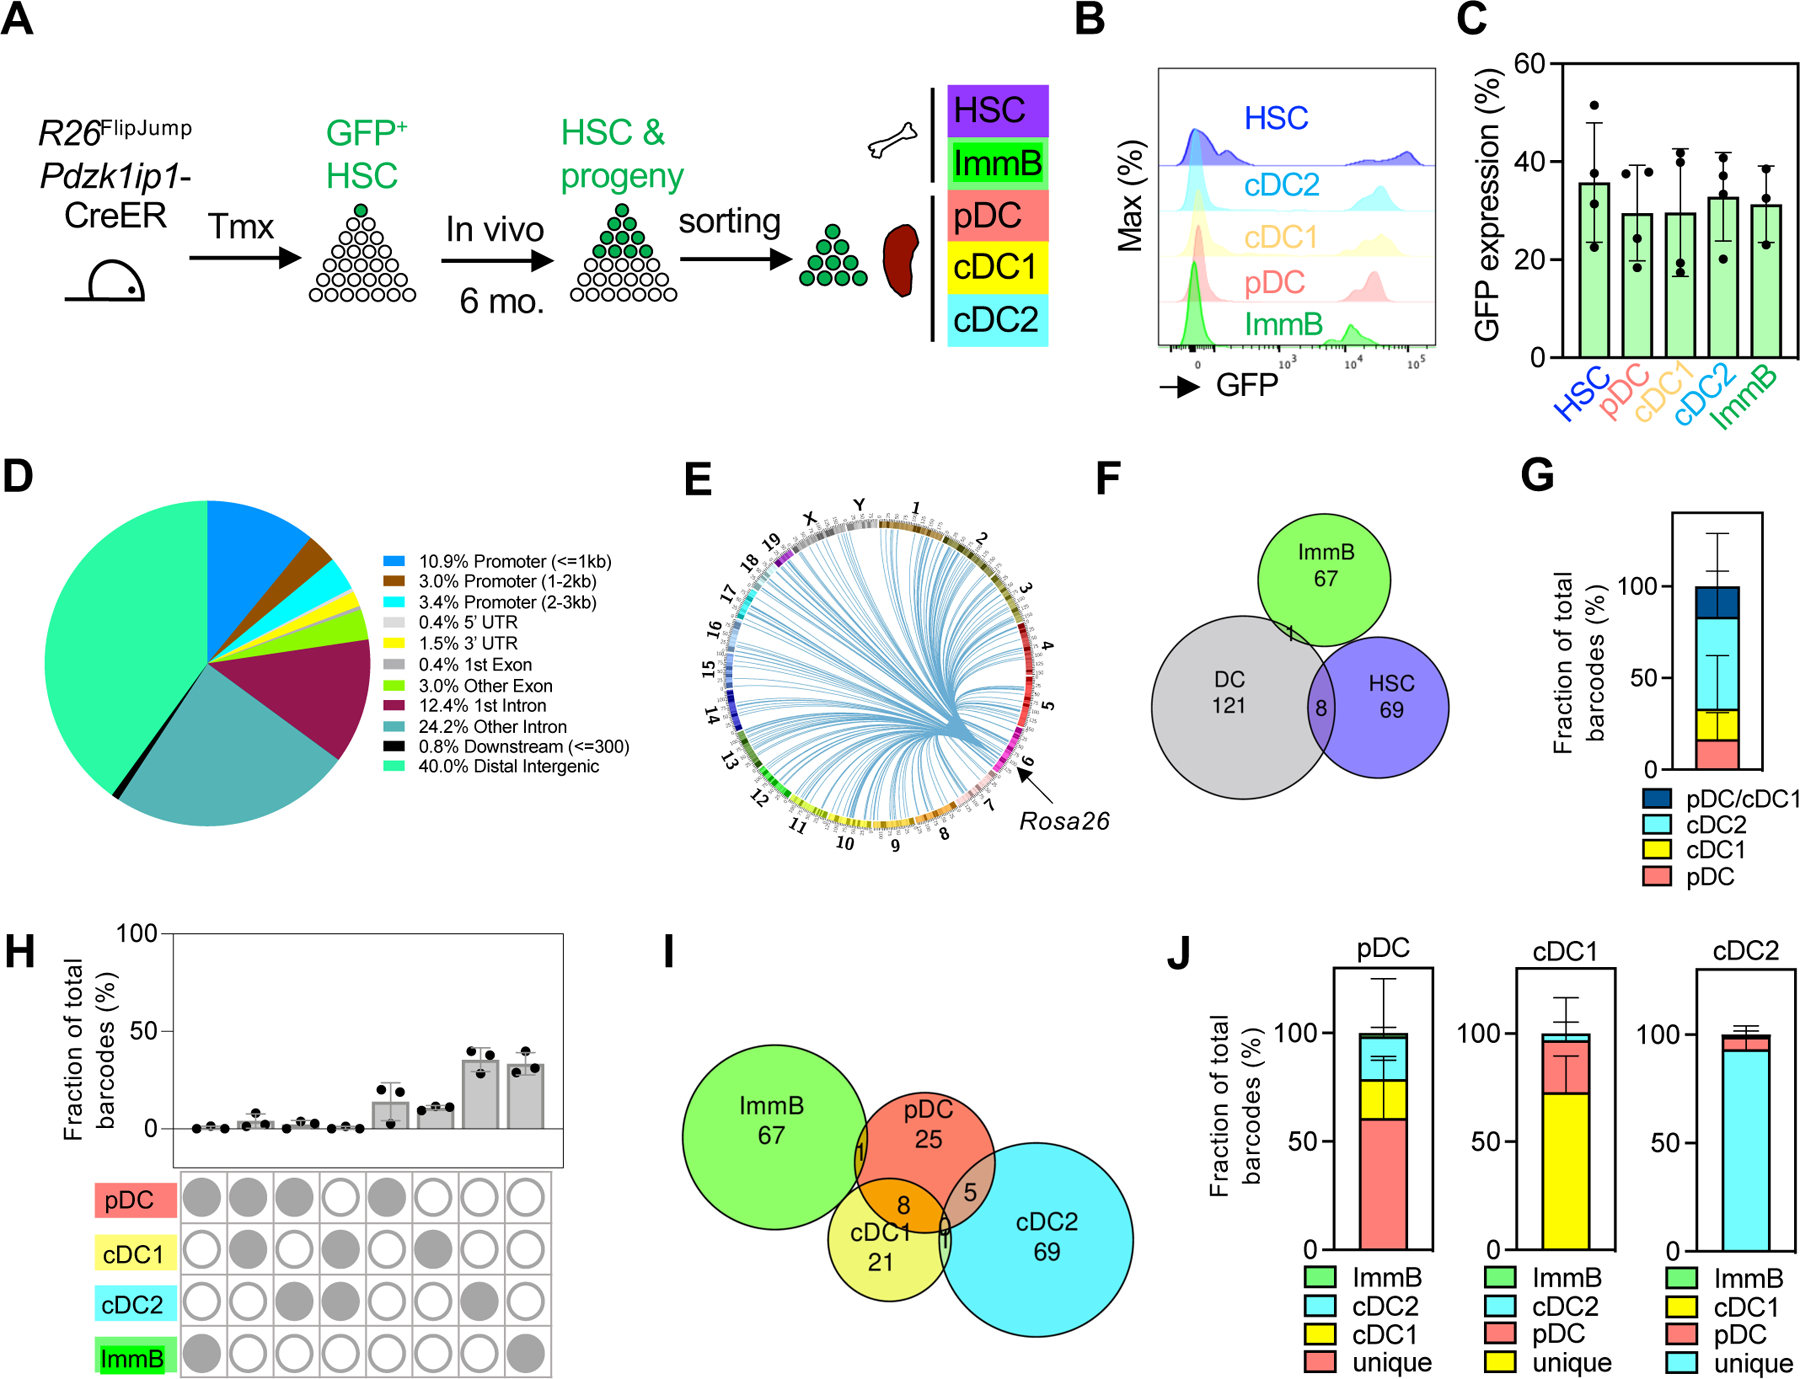
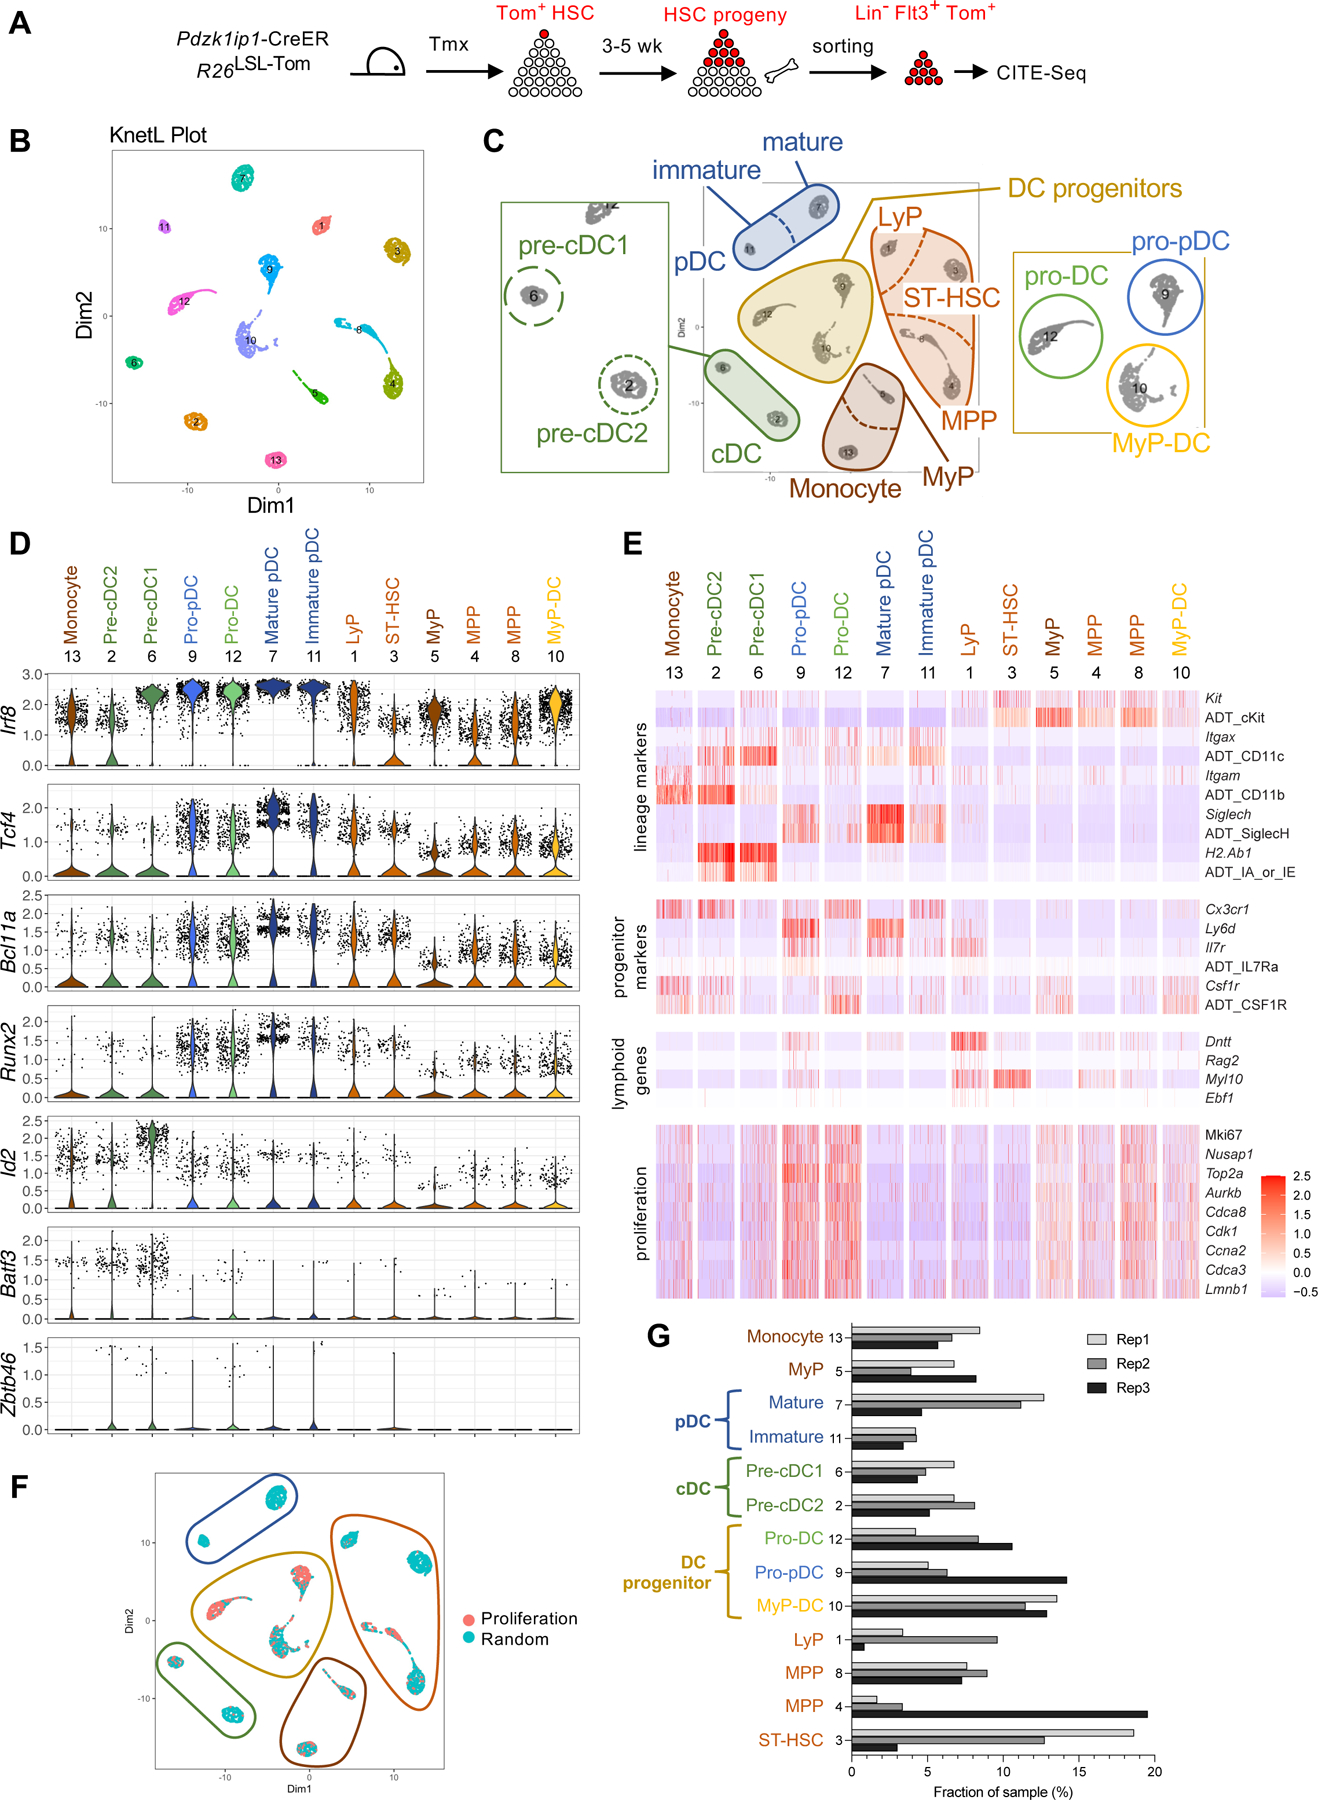
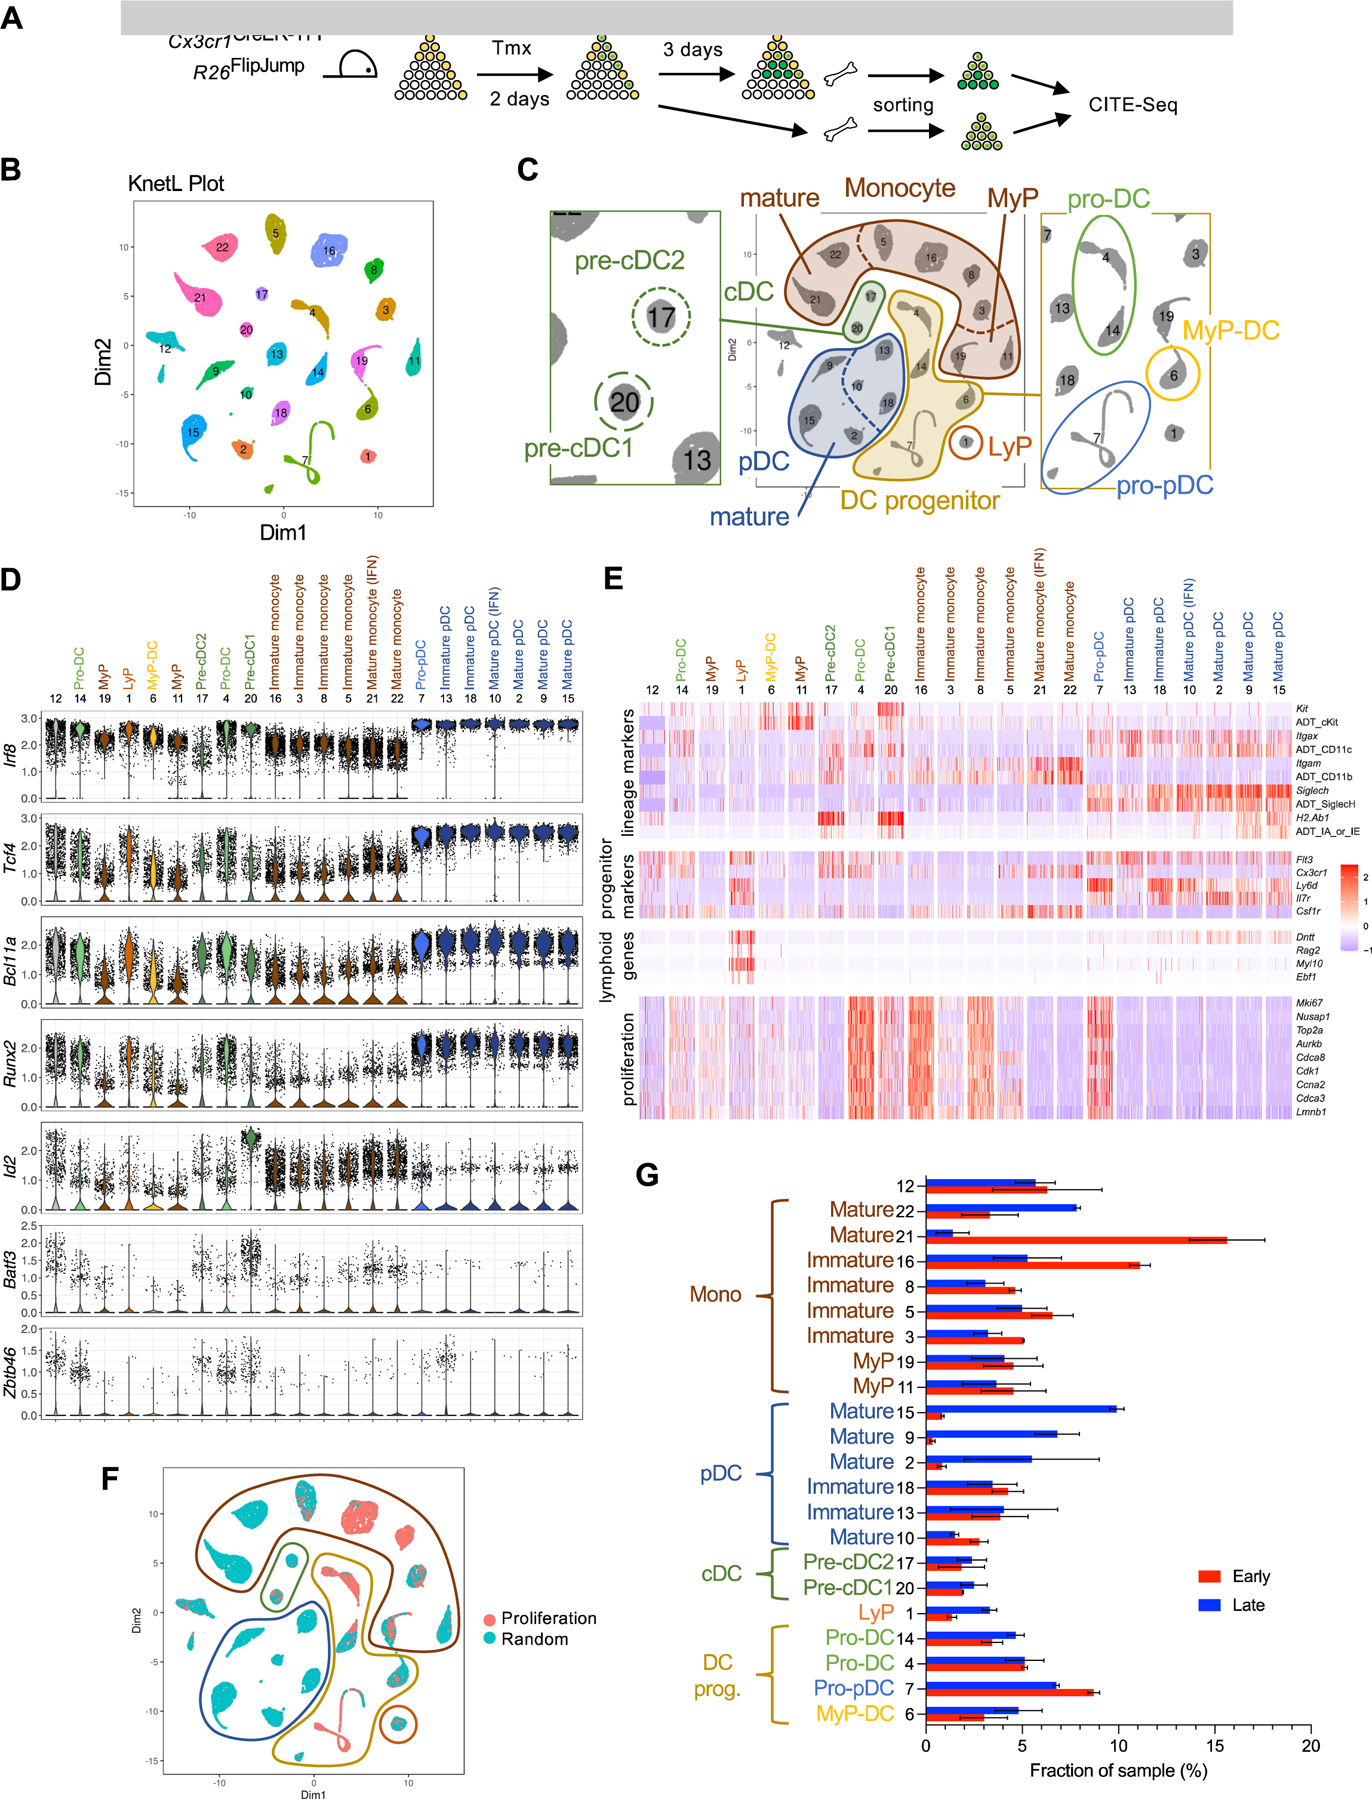
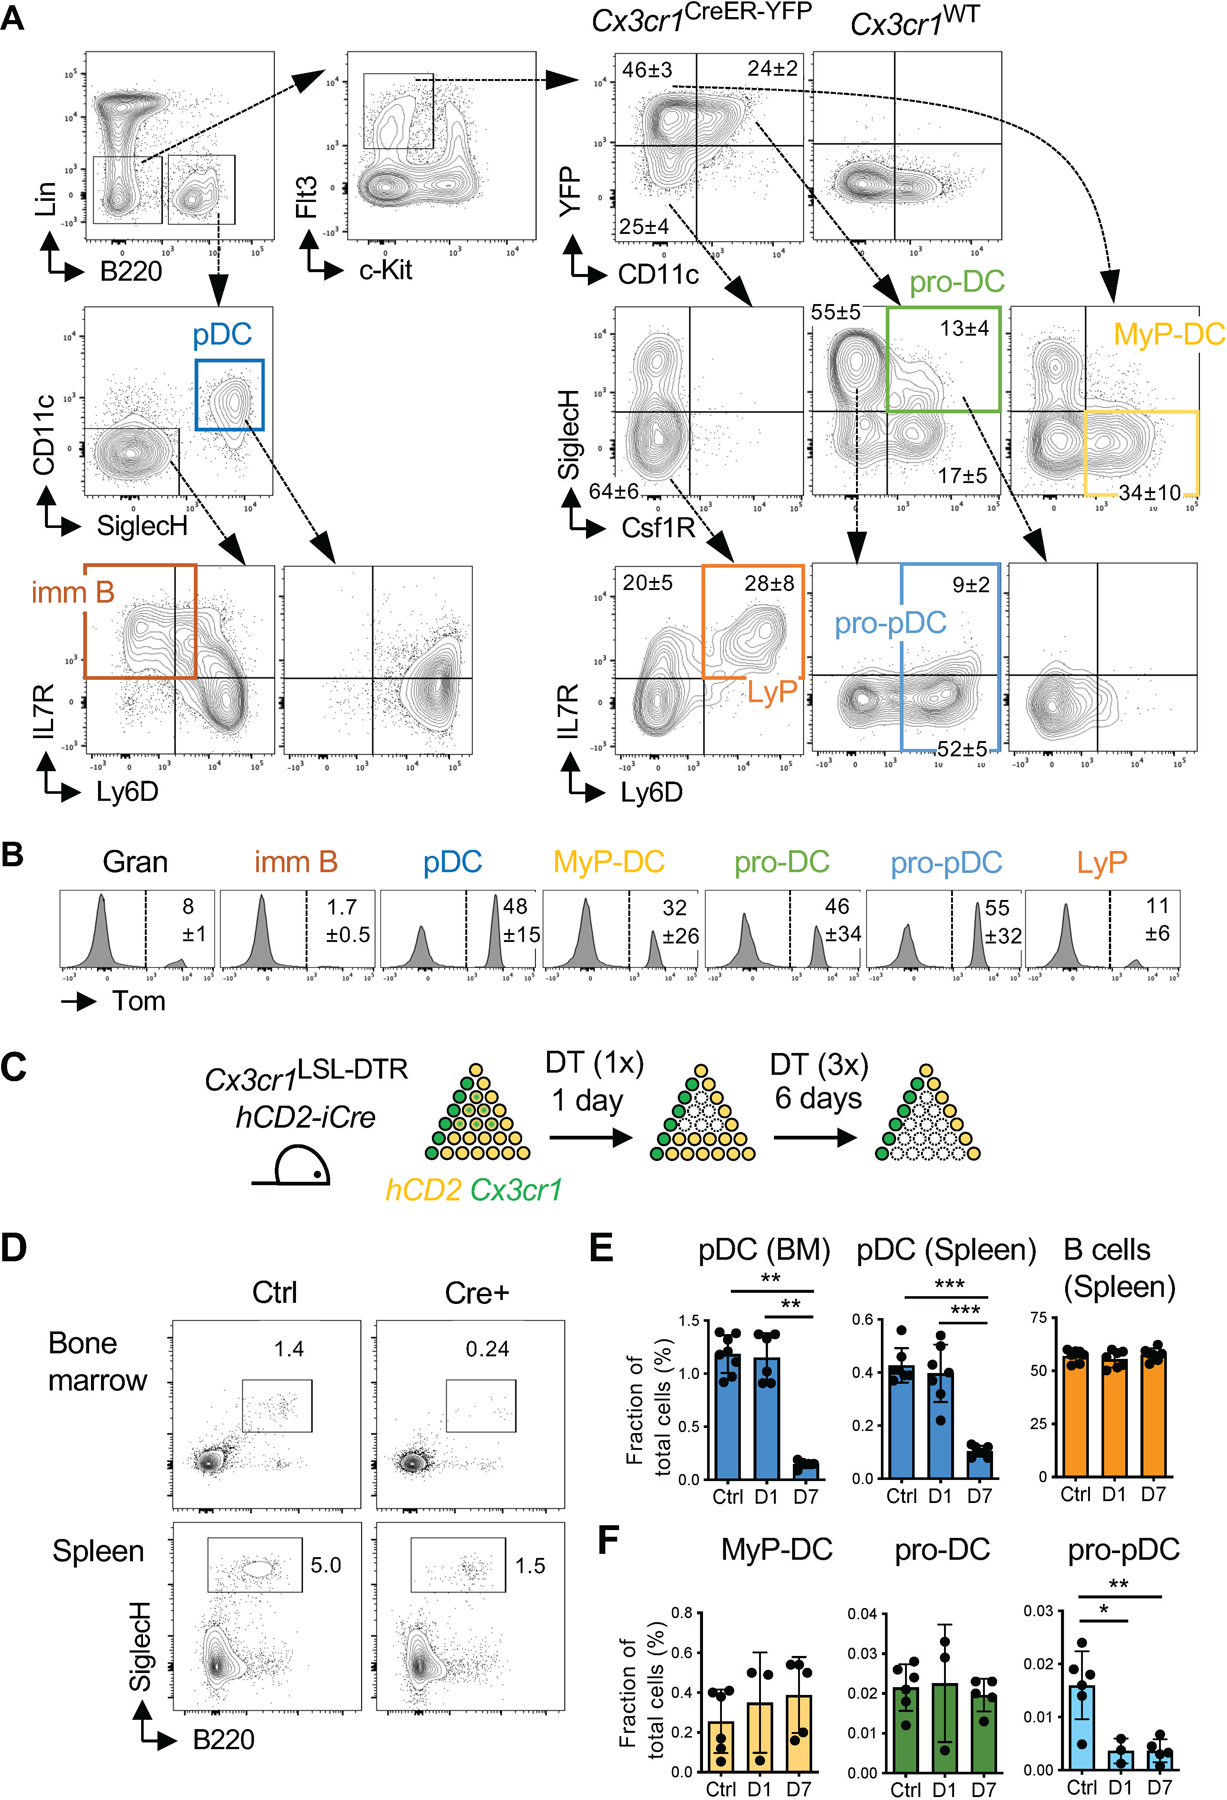
Developmental origins of dendritic cells (DCs) including conventional DCs (cDCs, comprising cDC1 and cDC2 subsets) and plasmacytoid DCs (pDCs) remain unclear. We studied DC development in unmanipulated adult mice using inducible lineage tracing combined with clonal DNA "barcoding" and single-cell transcriptome and phenotype analysis (CITE-seq). Inducible tracing of Cx3cr1+ hematopoietic progenitors in the bone marrow showed that they simultaneously produce all DC subsets including pDCs, cDC1s, and cDC2s. Clonal tracing of hematopoietic stem cells (HSCs) and of Cx3cr1+ progenitors revealed clone sharing between cDC1s and pDCs, but not between the two cDC subsets or between pDCs and B cells. Accordingly, CITE-seq analyses of differentiating HSCs and Cx3cr1+ progenitors identified progressive stages of pDC development including Cx3cr1+ Ly-6D+ pro-pDCs that were distinct from lymphoid progenitors. These results reveal the shared origin of pDCs and cDCs and suggest a revised scheme of DC development whereby pDCs share clonal relationship with cDC1s.

Keywords: conventional dendritic cells; hematopoietic progenitors; hematopoietic stem cells; lineage tracing; plasmacytoid dendritic cells.


Conflict of interest statement

Declaration of interests M.S. and P.S. are inventors on a patent related to the CITE-seq method. They are current employees of 10x Genomics, Inc. but were not affiliated with it or any other commercial entity at the time of the work described in this manuscript. B.R. is an adviser for Related Sciences and a co-founder of Danger Bio, which are not related to this work. Other authors declare no competing interests.

Figures

Figure 1.
Figure 1.. The FlipJump system for Cre-inducible transposon mobilization
A. Scheme of the FlipJump allele and its Cre-induced inversion (“Flip”) and mobilization (“Jump”). Inactive and active transcriptional states of the PiggyBac transposase and GFP are indicated by red and green circles, respectively. 3TR and 5TR, the 3’ and 5’ terminal repeats of the PiggyBac transposon, respectively; LoxP and Lox2272, incompatible LoxP sites. B-C. Cre-induced activation of FlipJump in murine ESC. Targeted R26FlipJump ESC were untreated (Ctrl) or treated with cell-permeable TAT-Cre recombinase protein (Cre) and examined 72 hours later. B. Genomic PCR of two targeted ESC clones detecting the native allele configuration and the recombined configuration after PiggyBac mobilization. The PCR products with expected sizes for both alleles are indicated by arrows. Size ladder is shown on the left. C. GFP expression by fluorescent microscopy (scale bar, 100 µm). D. Example of a cloned PiggyBac integration site. Shown are sequencing traces from 5’ and 3’ transposon ends mapped onto the genome, with the TTAA integration site and the restriction sites used for LM-PCR highlighted. E. Cloning and analysis of integration sites of R26FlipJump-encoded PiggyBac transposon. Following LM-PCR cloning and sequencing of integration sites at 3TR and 5TR ends of the transposon, they were filtered and mapped to the genome (step I), combined to define sites cloned from both ends (step II), and selected for sites occurring in only one animal (step III). TTAA, consensus integration site of the PiggyBac transposon; RI and RII, restriction sites used for LM-PCR. Please also see Figure S1.
Figure 2.
Figure 2.. Clonal tracing of DC development from HSC in vivo
A. Clonal tracing of HSC. Pdzk1ip1-CreER R26FlipJump mice were induced with tamoxifen (Tmx) and traced for 6 months. GFP+ HSC and immature B cells (ImmB) from the BM, and DC subsets from the spleen were used to clone transposon integration sites (barcodes). B. Histograms of GFP fluorescence at the endpoint in the same animal (representative of 4 animals). C. Fractions of GFP+ cells in HSC, immature B cells and DC subsets. Symbols represent individual mice; bars represent mean ± S.D. D. The distribution of cloned integration sites among elements of the genome. E. Circos plot of the integration site positions (lines) across the mouse genome relative to the transposon donor R26FlipJump allele. F. Proportional Venn diagram of clonal barcode sharing between HSC, immature B cells and DC subsets (pooled from 3 individual mice). G. Distribution of barcodes shared between HSC and DCs among DC subsets. H. Cumulative fractions of barcodes in immature B cells and DC subsets. Symbols represent values from individual mice; bars represent mean ± S.D. I. Proportional Venn diagram of clonal barcode sharing between immature B cells and DC subsets (pooled from 3 individual mice) J. Fractions of barcodes in each DC subset that are unique or shared with immature B cells or other subsets. Please also see Figure S2.
Figure 3.
Figure 3.. Single-cell analysis of DC development from HSCs in vivo
A. Pdzk1ip1-CreER R26Tom mice were induced with tamoxifen; 3–5 weeks later, Lin Flt3+ tdTomato+ BM cells were sorted from three biological replicates and analyzed by CITESeq. B. KNetL clustering of single cells (clusters are numbered and colored randomly). C. Proposed identities of cell clusters. D. Violin plots of transcript expression values for the indicated transcription factors in KNetL-defined cell clusters. The number and proposed identity of each cluster is indicated; clusters were ordered by hierarchical clustering using Euclidean distance. E. Heat maps of transcripts for the indicated phenotypic markers, lymphocyte-specific genes and proliferation-associated genes in the cell clusters defined above. For some surface markers, expression of antibody-derived tags (ADT) is also shown. F. Feature plot of the proliferation gene signature in KNetL-defined clusters (panel C). Cells colored red exhibited stronger correlation to proliferation signature geneset (Table S4) than to a randomly-selected gene set of equal size. G. The fraction of cells from each biological replicate in each cluster. Please also see Figure S3.
Figure 4.
Figure 4.. Clonal tracing of DC development from Cx3cr1+ progenitors in vitro
Cx3cr1CreER-YFP R26FlipJump mice were induced with tamoxifen, and 2 days later total BM was plated in Flt3L for 7 days to generated DCs. A. Definition of pDC, cDC2 and cDC1-like cells in Flt3L-supplemented cultures by surface staining. B. Expression of GFP in DC subsets from one culture (representative of 5 cultures from individual animals). C. Average fraction of GFP+ cells in DC subsets. Symbols represent cultures from individual mice; bars represent mean ± S.D. The lower labeling of pDCs versus cDC1 or cDC2 is statistically significant (p=0.008 by Mann-Whitney test). D. FlipJump was induced in Cx3cr1+ progenitors followed by Flt3L-supplemented culture, and GFP+ DC subsets were used to clone transposon integration sites (barcodes). E The distribution among elements of the genome of the integration sites cloned in Cx3cr1+ progenitor tracing experiments in vitro (this figure) and in vivo (Fig. 5). F. Circos plot of the integration site positions (lines) across the mouse genome relative to the transposon donor R26FlipJump allele. G. Cumulative fractions of barcodes in DC subsets. Symbols represent values from individual mice; bars represent mean ± S.D. H. Proportional Venn diagram of clonal barcode sharing between the DC subsets (pooled cultures from 3 individual mice). I. Fractions of pooled barcodes in each DC subset that are unique or shared with other subsets.
Figure 5.
Figure 5.. Clonal tracing of DC development from Cx3cr1+ progenitors in vivo.
Cx3cr1CreER-YFP R26FlipJump mice were induced with tamoxifen, the expression of GFP (indicative of FlipJump activation) was examined by flow cytometry and used to clone integration sites. A. The expression of GFP vs Cx3cr1-driven YFP among total BM or splenic cells in wildtype mice (Control) or in Cx3cr1CreER-YFP R26FlipJump mice prior to (day 0) or at days 2–8 after tamoxifen administration. B. The expression of Cx3cr1-driven YFP in mature DC subsets. Shown are histograms of YFP fluorescence in the gated DC subsets including transitional DCs (tDCs) and EsamcDC2 (cDC2(E-)). Granulocytes (Gran) and monocytes (Mono) are included as respective negative and positive populations for YFP expression. Representative of >20 animals. C. Average fractions of GFP+ cells in splenic pDC, cDC1 and cDC2 at the indicated time points of tracing. Symbols represent mean ± S.D. of 10, 11 or 3 mice at days 6, 8–9 and 12, respectively. The labeling in pDCs was significantly higher than in cDC2 on day 6 (p=0.005) and lower than in cDC1 on days 8–9 (p=0.003) as determined by Mann-Whitney test; no other differences were significant. D. Expression of GFP in splenic cell types defined above. The fractions of GFP+ cells in each subset are shown at the corresponding time points after tamoxifen administration. Representative of 3 animals on days 2–4 and 10–11 animals on days 6–8. E. Splenic GFP+ DC subsets on day 8 post-tamoxifen were used to clone transposon integration sites (barcodes). F. Cumulative fractions of barcodes in DC subsets. Symbols represent values from individual mice; bars represent mean ± S.D. G. Proportional Venn diagram of clonal barcode sharing between the DC subsets (pooled from 7 individual mice). H. Fractions of pooled barcodes in each DC subset that are unique or shared with other subsets.. Please also see Figures S4 and S5.
Figure 6.
Figure 6.. Single-cell analysis of DC development from Cx3cr1+ progenitors in vivo
A. Cx3cr1CreER-YFP R26FlipJump mice were induced with tamoxifen; at early (2 days) or late (5 days) time points, Lin GFP+ BM cells were sorted from two biological replicates and analyzed by CITE-Seq. B. KNetL clustering of single cells (clusters are numbered and colored randomly). C. Proposed identities of cell clusters (cluster 12 contains cells with poor sequencing quality). D. Violin plots of transcript expression values for the indicated transcription factors in KNetL-defined cell clusters. The number and proposed identity of each cluster is indicated; clusters were ordered by hierarchical clustering using Euclidean distance. E. Heat maps of transcripts for the indicated phenotypic markers, lymphocyte-specific genes and proliferation-associated genes in the cell clusters defined above. For some surface markers, expression of antibody-derived tags (ADT) is also shown. F. Feature plot of the proliferation gene signature in KNetL-defined clusters (panel C). Cells colored red exhibited stronger correlation to proliferation signature geneset (Table S4) than to a randomly-selected gene set of equal size. G. The fraction of cells from the early or late time point in each cluster (mean ± range of biological replicates). Please also see Figure S6.
Figure 7.
Figure 7.. Intersectional tracing of pDC development from Cx3cr1+ progenitors in vivo
A. Definition of progenitor populations in the BM of Cx3cr1CreER-YFP mice by flow cytometry. Wild-type (Cx3cr1WT) mouse is included as a negative control for YFP expression. The fractions of select populations are indicated (mean ± S.D. of 6 mice) B. The expression of tdTomato (Tom) in BM cell populations of Cx3cr1CreER-YFP R26LSL-Tom mice 6 days after tamoxifen induction. Populations were defined as in panel A; the fractions of Tom+ cells are indicated (mean ± S.D. of 3 mice). C. hCD2-iCre Cx3cr1LSL-DTR mice were administered diphtheria toxin (DT) and analyzed one day later to assess the depletion of cells expressing hCD2 and Cx3cr1; or administered DT every second day during subsequent 6 days and analyzed on day 7 to assess the depletion of cells expressing hCD2 and Cx3cr1 and of their progeny. Crenegative Cx3cr1LSL-DTR mice were treated in parallel and used as controls. D. Staining profiles of lineage (CD3,CD19,NK1.1,Ly-6G)-negative BM cells (top) or splenocytes (bottom) from hCD2-iCre Cx3cr1LSL-DTR or control mice after 7 days of continuous DT treatment. The pDC gate is indicated. Representative of 7 animals. E-F. Fractions of indicated cell types among total splenocytes or BM cells from hCD2-iCre Cx3cr1LSL-DTR mice treated for 1 or 7 days, and in control mice treated for 7 days.Symbols represent individual mice; bars represent mean ± S.D.; statistically significant differences are indicated. E. The fraction of pDCs and B cells. F. The fraction of BM progenitors defined as in panel A.. Statistical significance was defined by Mann-Whitney test and shown as follows: *, p <0.05; **, p <0.01; ***, p <0.001.. Please also see Figure S7.

Comment in

References

    1. Allman D, Dalod M, Asselin-Paturel C, Delale T, Robbins SH, Trinchieri G, Biron CA, Kastner P, and Chan S (2006). Ikaros is required for plasmacytoid dendritic cell differentiation. Blood 108, 4025–4034. - PMC - PubMed
    1. Anders S, Pyl PT, and Huber W (2015). HTSeq--a Python framework to work with high-throughput sequencing data. Bioinformatics 31, 166–169. - PMC - PubMed
    1. Babicki S, Arndt D, Marcu A, Liang Y, Grant JR, Maciejewski A, and Wishart DS (2016). Heatmapper: web-enabled heat mapping for all. Nucleic Acids Res 44, W147–153. - PMC - PubMed
    1. Bagadia P, Huang X, Liu TT, Durai V, Grajales-Reyes GE, Nitschke M, Modrusan Z, Granja JM, Satpathy AT, Briseno CG, et al. (2019). An Nfil3-Zeb2-Id2 pathway imposes Irf8 enhancer switching during cDC1 development. Nat Immunol 20, 1174–1185. - PMC - PubMed
    1. Balan S, Arnold-Schrauf C, Abbas A, Couespel N, Savoret J, Imperatore F, Villani AC, Vu Manh TP, Bhardwaj N, and Dalod M (2018). Large-Scale Human Dendritic Cell Differentiation Revealing Notch-Dependent Lineage Bifurcation and Heterogeneity. Cell Rep 24, 1902–1915. - PMC - PubMed

Publication types

Supplementary concepts