. 2022 Mar 17;185(6):1052-1064.e12.
doi: 10.1016/j.cell.2022.01.024. Epub 2022 Feb 2.

Non-cell-autonomous disruption of nuclear architecture as a potential cause of COVID-19-induced anosmia

Affiliations

Non-cell-autonomous disruption of nuclear architecture as a potential cause of COVID-19-induced anosmia

Marianna Zazhytska et al. Cell. .

Abstract

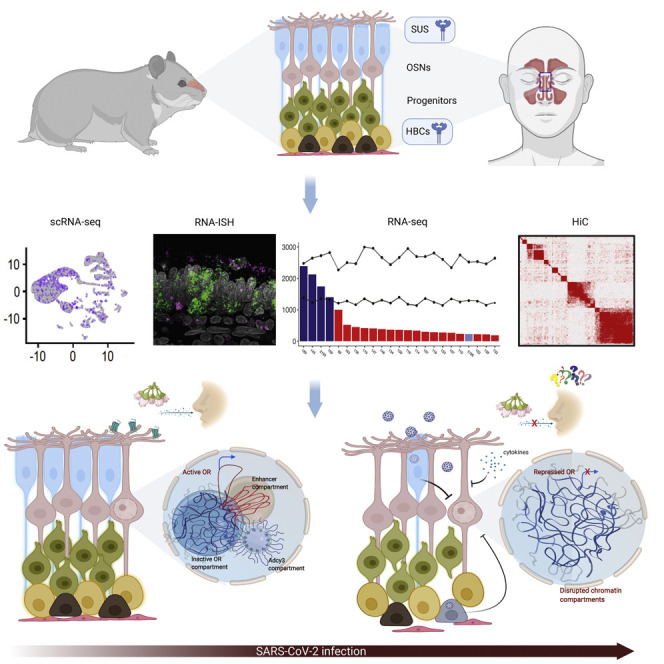
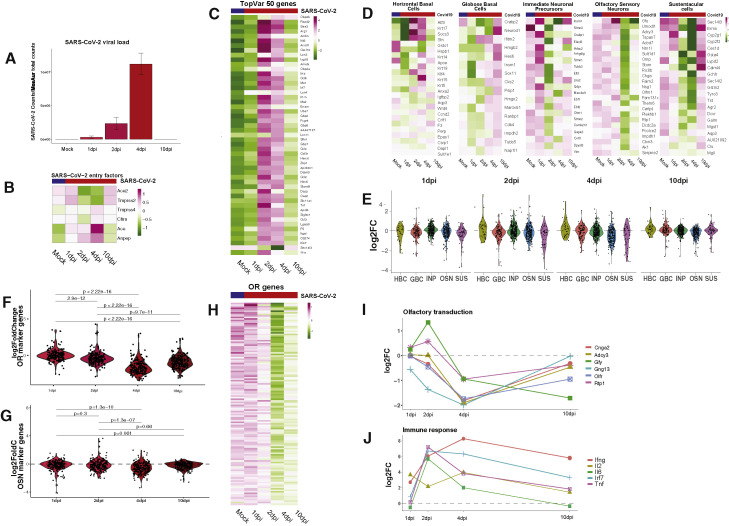
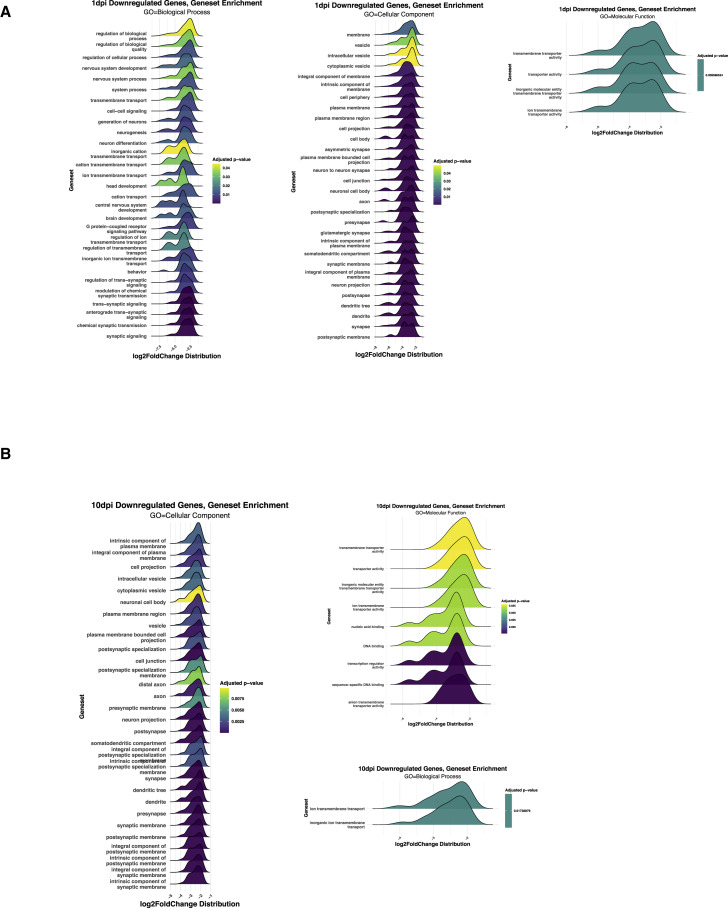
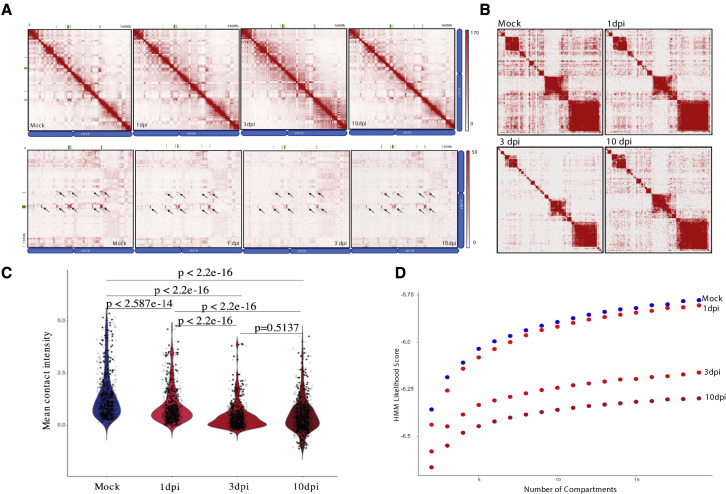
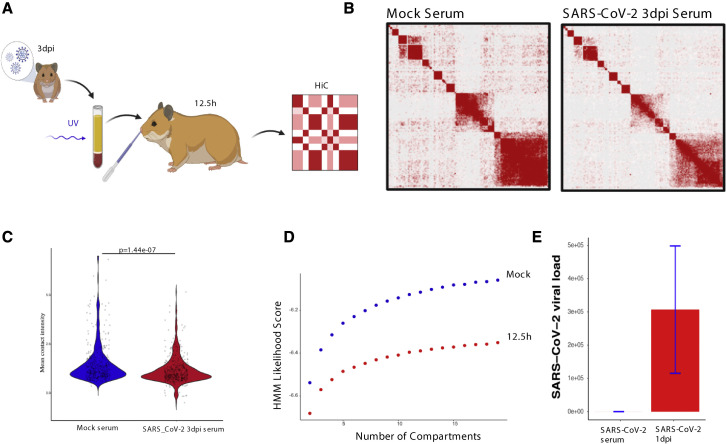
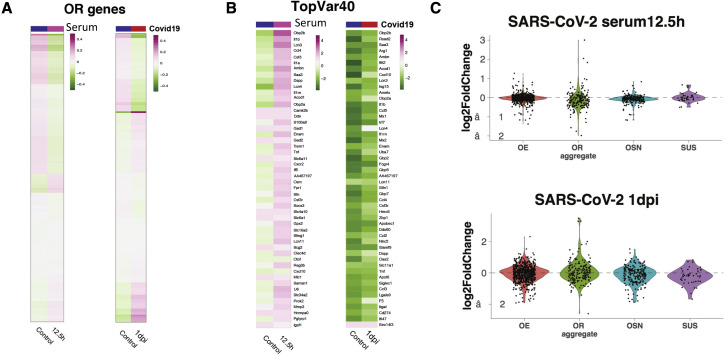
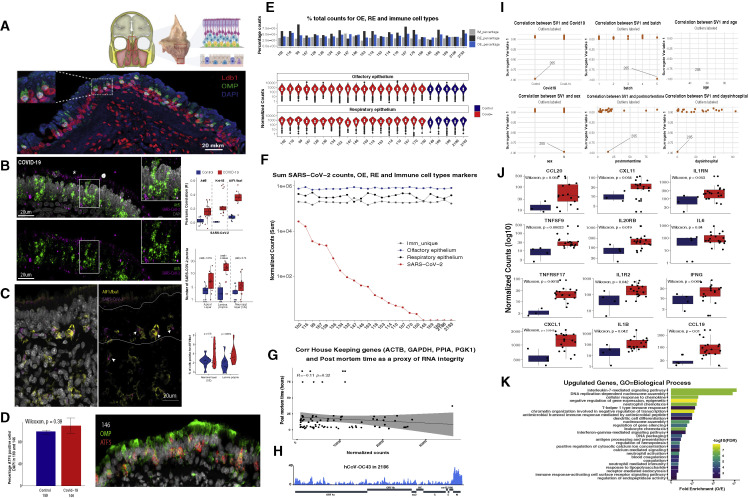
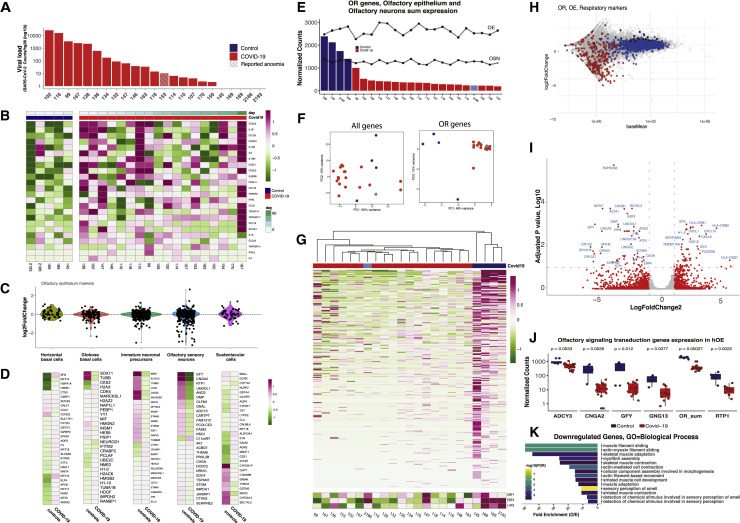
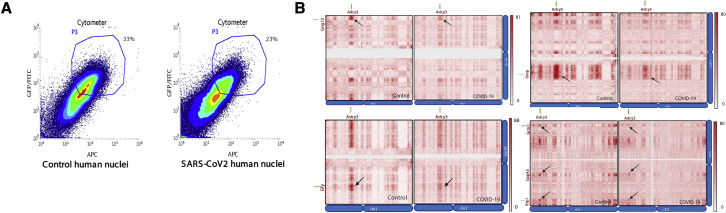
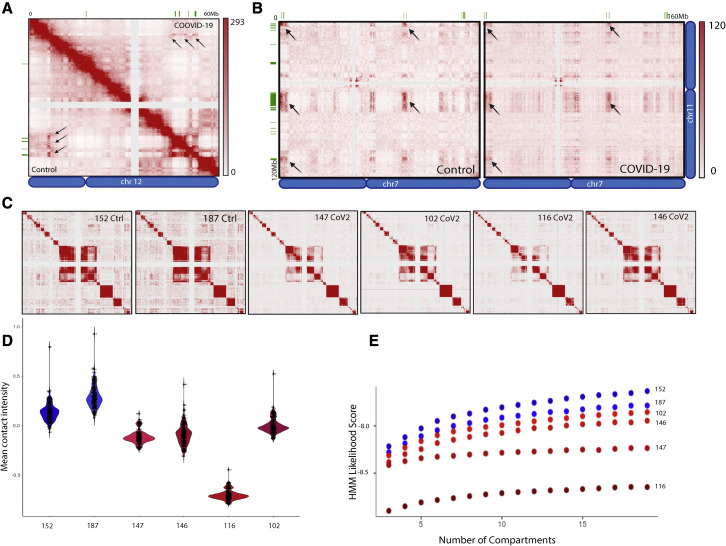
SARS-CoV-2 infects less than 1% of cells in the human body, yet it can cause severe damage in a variety of organs. Thus, deciphering the non-cell-autonomous effects of SARS-CoV-2 infection is imperative for understanding the cellular and molecular disruption it elicits. Neurological and cognitive defects are among the least understood symptoms of COVID-19 patients, with olfactory dysfunction being their most common sensory deficit. Here, we show that both in humans and hamsters, SARS-CoV-2 infection causes widespread downregulation of olfactory receptors (ORs) and of their signaling components. This non-cell-autonomous effect is preceded by a dramatic reorganization of the neuronal nuclear architecture, which results in dissipation of genomic compartments harboring OR genes. Our data provide a potential mechanism by which SARS-CoV-2 infection alters the cellular morphology and the transcriptome of cells it cannot infect, offering insight to its systemic effects in olfaction and beyond.

Keywords: COVID-19; anosmia; nuclear architecture.


Conflict of interest statement

Declaration of interests The authors declare no competing interests.

Figures

None
Graphical abstract
Figure S1
Figure S1
SARS-CoV-2 infects hamster OSNs very infrequently, related to Figure 1 (A) Dot plot showing expression of cell markers across clusters. Cell types are listed on y axis showing expression of 45 selected genes identified by log fold change; genes are listed along x axis. Dot size reflects percentage of cells in a cluster expressing each gene, and dot color represents expression level. The plot shows clusters from 68,951 combined cells extracted from eight OEs with two biological replicates per condition. (B) Feature plot depicting expression of S SARS-CooV-2 transcript in hamster olfactory epithelium. Cell types are same as in Figure 1A (n = 2 biological replicates for each sample). (C) Representative confocal micrograph of IF-FISH experiment labeling RNA-FISH SARS-CoV-2 (magenta) and OMP protein (green) in hamster OE at 4 dpi. Rarely OMP-positive cells colocalize with SARS-CoV-2. No viral particles are detected in the axon bundles (asterisk). The line intensity scan drawn at the center of the OE section shows a discrete distribution of the pixel intensity of the two channels. (D) Top, IF-FISH confocal micrograph of OE tissue section showing colocalization of RNA FISH signal of SARS-CoV-2 (magenta) and antibody staining for OMP (green), suggesting that a small percentage of OSNs is infected. Bottom, IF-FISH in hamster OB section at 4 dpi shows rare RNA-FISH SARS-CoV-2 (magenta) detected in proximity to glomeruli labeled by OMP protein (green). (E) RNA-FISH SARS-CoV-2 signal (magenta) in the OE and lamina propria strongly correlates with the microglia marker AIF1/Iba1 (yellow), as highlighted by the enlarged picture in the white box. The line intensity scan of one single cell shows that SARS-CoV-2 signal is correlated with AIF1/Iba1 suggesting engulfment of viral particles by microglia.
Figure 1
Figure 1
SARS-CoV-2 infects and transiently depletes hamster sustentacular cells (A) UMAP plots of hamster OEs for mock- and SARS-CoV-2-infected hamsters at 1, 3, and 10 dpi. See also Figure S1A for the distribution of cell-specific markers. (B) Representation of cell types in mock- and SARS-CoV-2-infected hamster OEs at 1, 3, and 10 dpi. HBCs, GBCs, and INPs combined as OSN progenitor cells, macrophages, T cells, B cells combined as immune cells, MV1, MV2, olfactory glia, and fibroblasts combined as other. (C) Feature plot showing expression of N SARS-CoV-2 transcript in hamster OEs. See also Figure S1B for expression of S SARS-CoV-2 transcript. (D) Bar charts depicts proportion of SARS-CoV-2 N transcript across the cell types of the OE. Color code of cell types same as B. See also Figures S1C and S1E for histological confirmation of SARS-CoV-2 tropism. (E) Percentage of cells with N and S transcripts in the annotated clusters (HBCs, GBCs, and INPs combined as OSN progenitor cells; macrophages, T cells, B cells combined as immune cells; MV1, MV2, olfactory glia, and fibroblasts combined as other) at 1 and 3 dpi. Each panel (A–E) represents two combined biological replicates, per condition.
Figure 2
Figure 2
SARS-CoV-2 infection induces non-cell-autonomous changes in hamster OSNs (A) Scatter plots showing average expression of mock- and SARS-CoV-2-infected SUS cells at 1, 3, and 10 dpi. Top differentially expressed genes are shown in red boxes, hamster genes highlighted with “MesAur-” prefix, SARS-CoV-2 transcripts with “Cov2-.” (B) Volcano plot showing upregulated and downregulated genes in SARS-CoV-2+ vs SARS-CoV-2 SUS cells from infected OEs at 1 and 3 dpi. Significantly upregulated genes are shown in red, downregulated in blue; top 1% of differentially expressed genes highlighted on the plot. (C) Violin plots representing the log-normalized expression of antiviral genes in OSNs from mock- and SARS-CoV-2-infected OEs at 1, 3, and 10 dpi. See also Figure S2 for feature plots. (D) Violin plots representing the log-normalized expression of key OSN genes from mock- and SARS-CoV-2-infected OEs at 1, 3, and 10 dpi. (E) Confocal micrographs of IF-FISH in hamster OE, mock and 4 dpi, shows decreased ADCY3 protein and mRNA levels in tissues infected with SARS-CoV-2. Left, ADCY3 Ab (green) and SARS-CoV-2 gRNA (magenta). The SARS-CoV-2 probe targets the antisense strand of the S gene, detecting replicating virus. Right, Adcy3 mRNA FISH (red) is reduced in 4 dpi samples compared with mock. (F) ACDY3 protein and mRNA quantifications show significantly lower levels in hamster OE 4 dpi compared with mock controls. Top, distribution of mean intensity ACDY3 antibody staining for individual cells in in control and infected hamster OE sections. Bottom, distribution of integrated density (mean intensity × DAPI area) of ADCY3 mRNA FISH signal in control and infected hamster OE sections.
Figure S2
Figure S2
Evidence for induction of antiviral programs in OSNs upon SARS-CoV-2 infection of hamster OEs, related to Figure 2 Feature plot of Irf7, Irf9, Isg15, and Eif2ak2 (PKR) expression across clusters. Expression of these genes starts at microglia and immune cells at 1 dpi but expands on OSNs and other OE-resident cells by 3 dpi (two biological replicates per condition combined).
Figure 3
Figure 3
SARS-CoV-2 infection causes downregulation of hamster OR and OR signaling genes (A) SARS-CoV-2 genomic counts in hamster OE following intranasal inoculation of SARS-CoV-2 and harvest at 1, 2, 4, and 10 dpi. SARS-CoV-2 raw counts were normalized to the MesAur1.0 genome reads and plotted as DESeq2’s median ratio normalization (MRN). No mapped counts were found in the mock-infected OE. (B) Z-scored expression of SARS-CoV-2 entry genes across infection time course. (C) Z-scored expression of the 50 genes with highest variance. (D) Z-scored expression of HBC, GBC, INP, OSN, and SUS markers (left to right) across SARS-CoV-2 infection time course. (E) Distribution of log2FC for cell-type-specific markers in the OE during SARS-CoV-2 infection time course. (F) Distribution of log2FC for OR genes during SARS-CoV-2 infection time course. (G) Distribution of log2FC for OSN markers during SARS-CoV-2 infection time course. (H) Z-scored expression of OR genes during SARS-CoV-2 infection time course. (I) Aggregate expression of ORs and OR signaling transduction genes during SARS-CoV-2 infection time course. See also Figure S3. (J) Antiviral gene expression during SARS-CoV-2 infection time course. Data for each panel (A–J) represent averages from three biological replicates per condition, except for 1 dpi, which is the average of two biological replicates.
Figure S3
Figure S3
GSE analysis of enriched genes 1 and 10 days post SARS-CoV-2 infection in hamsters, related to Figure 3 (A) GSE analysis for enriched genes at 1 dpi in hamster reveals consequences for neurogenesis and OSNS activity at 1 dpi for three GO domains (biological process, cellular component, and molecular function). (B) GSE analysis for enriched genes at 10 dpi in hamster for three GO domains.
Figure 4
Figure 4
SARS-CoV-2 infection disrupts interchromosomal OR compartments (A) In situ HiC maps of contacts between OR clusters in cis (top) or trans (bottom) for mock, 1, 3, and 10 dpi hamster from pooled in situ HiC data. Pixel intensity represents normalized number of contacts between pair of loci. Maximum intensity indicated at the top of each scale bar. Genomic position of OR clusters indicated as green bars; arrows indicate the same OR compartments for both conditions. (B) Pairwise heatmap shows reduction of in situ HiC contacts between OR clusters (n = 46 clusters) that increases as SARS-CoV-2 infection progresses. (C) Violin plot depicting the mean number of normalized trans in situ HiC contacts between OR clusters genome wide at 100-kb resolution for mock, 1, 3, and 10 dpi. Every dot indicates aggregated contacts for each OR-to-OR cluster pair in trans; p value was computed using Wilcoxon rank test. (D) HMM score for a given number of compartments indicating differences in genomic compartmentalization for mock (blue) and SARS-CoV-2-infected hamsters at 1, 3, and 10 dpi (shades of red). For each panel (A–D), data represent averages from two biological replicates per condition.
Figure 5
Figure 5
Serum from SARS-CoV2-infected hamsters disrupts genomic OR compartments (A) The experimental pipeline used to expose naive hamsters OEs serum from SARS-CoV-2 or mock-infected hamsters prior to in situ HiC analysis. Serum was collected 3 dpi from mock or SARS-CoV-2-infected hamsters, centrifuged, and UV-irradiated before intranasal inoculation to naive hamster OEs for 12.5 h. See also Figure S4. (B) Pairwise heatmap of in situ HiC contacts between OR clusters (n = 46 clusters) from hamster OEs. The heatmap on the left is from OEs exposed to serum from mock-infected hamsters, whereas on the right is from OEs exposed to serum from SARS-CoV-2-infected hamsters. (C) The mean number of normalized trans in situ HiC contacts between OR clusters genome wide at 100-kb resolution for mock and 12.5 h SARS-CoV-2 serum-treated hamster. Every dot indicates aggregated contacts for each OR-to-OR cluster pair in trans; p value was computed using Wilcoxon rank test. (D) HMM score for a given number of compartments indicating differences in genomic compartmentalization upon OE exposure for 12.5 h to serum from mock (blue) and SARS-CoV-2-infected hamsters at 3 dpi (red). (E) SARS-CoV-2 genomic counts in inactivated serum of 3 dpi hamster applied to naive hamster compared with the viral load at 1 dpi hamster. SARS-CoV-2 raw counts were normalized to the MesAur1.0 genome reads and plotted as DESeq2’s median ratio normalization (MRN). No mapped counts were found in the mock-infected OE. For each panel (A–D), data represent averages of three biological replicates per condition.
Figure S4
Figure S4
Subtle transcriptional changes in the hamster OE upon exposure to UV-neutralized serum from infected hamsters, related to Figure 5 (A) Z-scored expression of OR genes from OEs exposed to mock- versus SARS-CoV-2-infected serum for 12.5 h (left) or from OEs that were mock infected versus SARS-CoV-2 infected for 1 day (right). (B) Z-scored expression of the top 40 most variable genes upon serum exposure (left). For comparison, Z-scored expression of top 40 genes at 1 dpi identified in SARS-CoV-2-infected hamster and harvested at different time points (mock, 1 dpi, 2 dpi, 4 dpi, and 10 dpi) (right). (C) Violin plots showing the effect of exposure to serum from SARS-CoV2 versus mock-infected hamsters for 12.5 h at the transcription of OR genes, OE, OSN, and SUS markers. For comparison, we plot the same groups at SARS-CoV-2-infected (1 dpi) versus mock-infected hamsters. For each panel (A–C), data represent averages of three biological replicates per condition.
Figure S5
Figure S5
Quality control analyses of human OE autopsies, related to Figure 6 (A) (Top) En bloc resection of the cribriform plate along with underlying mucosa from the olfactory cleft, which contains OE more superiorly and respiratory epithelium below. (Bottom) Section of this human olfactory epithelium stained for OMP (green) and LDB1 (red), OSN-specific and OSN-enriched markers, respectively. Nuclei are labeled with DAPI (blue). (B) Confocal micrograph of RNA FISH for SARS-CoV-2 gRNA (magenta) and OSN/OSN progenitor marker ATF-5 (green) in COVID-19+ human OE. The SARS-CoV-2 probe targets the antisense strand of the S gene, detecting replicating virus. Nuclei are stained with DAPI. SARS-CoV-2 signal is detected in the apical layers of the epithelium (asterisk), proximal to SUS cells, and in the basal layer where HBCs reside. Correlation of the RNA-FISH SARS-CoV-2 signal and markers for OSNs (ATF5), sustentacular cells (Krt-18), and microglia (AIF1/Iba1) is measured by Pearson’s correlation coefficient (R) in COVID-19 (red) and control (blue) human OE autopsies (top right panel). Quantification of RNA-FISH signal was measured as local maxima at the apical, neuronal, and basal layers for a total of 2,140 cells in infected and 1,819 cells in control OEs. Only apical and basal layers have significantly enriched signal in infected OEs. (C) RNA-FISH SARS-CoV-2 signal (magenta), detected in the neuronal layer (OE), marked in between the two white lines, and lamina propria. S probe signal (magenta) strongly correlates with microglia marker AIF1/Iba1 (yellow) immunofluorescence (IF) signal, as indicated by arrows. The number of AIF1/Iba1-positive cells is measured over the number of total cells counted (right panel). In COVID-19 patients, a significantly enrichment of microglia is observed in the lamina propria, while in the neuronal layer (OE), more variability between images is observed. (D) Bar plot of the percentage of Atf5 RNA+ cells over total number of DAPI-positive cells on sections of COVID-19 (146) and control (189) human OEs. No significant difference between samples is detected (n = 508 for 146, n = 458 for 189). Cells with more than two RNA puncta were counted as positive. On the right, a representative image of sample 146 for Atf5 RNA-FISH (red) and OMP protein (green). (E) Percentage of total counts of OE, RE, and immune-cell-type genes. Pairwise Wilcoxon test shows no significant difference between samples. Distribution of normalized counts for OE and RE genes for each sample (bottom panels). (F) SARS-CoV-2 counts plotted in decreasing order (red) together with normalized counts for OE (blue), RE (black), and immune cells (gray). (G) Correlation of house-keeping genes (ACTB, GAPDH, PPIA, and PGK1) and post-mortem times were used as a proxy of RNA integrity. Pearson’s test shows no significant correlation. (H) Coverage map for hCoV-OC43 in sample 2,186. (I) Surrogate variable analysis reveals sample 205 as an extreme outlier. SV1 does not correlate with known variables (COVID-19, processing batch, age, sex, post-mortem time, or days after symptoms onset), but rather in all cases distinguishes sample 205 from other samples. (J) Box plot depicting normalized counts between pooled control and infected samples for antiviral genes. (K) GO analysis for upregulated genes depicting significant enrichment for genes involved in immune/antiviral responses.
Figure 6
Figure 6
SARS-CoV-2 infection of human OEs coincides with downregulation of OR/OR signaling genes (A) SARS-CoV-2 genomic counts from the OE of 18 COVID-19 patients (red) and 4 controls (blue). SARS-CoV-2 raw counts were normalized to the hg38 genome reads using DESeq2’s median ratio normalization (MRN). The striped bar highlights the only sample with known anosmia. See also Figure S5 for histological confirmation of SARS-CoV-2 detection. (B) Z score for inflammatory makers for each sample shows variability of inflammatory response among patients. See also Figure S4J for aggregate analysis of log2FC of antiviral/inflammatory markers. (C) Distribution of log2FC for cell-type-specific markers in the OE. A subset of OSN markers is downregulated. (D) Z-scored expression of inflammatory makers calculated across samples shows variability of inflammatory response among COVID-19 patients. Samples are ordered according to the number of days after symptoms onset (top). See also Figure S4J. (E) Distribution of aggregated normalized OR genes counts across all human OEs. Transformed aggregate expression of OE and OSN markers are plotted for each sample as dots. Infected samples depicted in red and control samples in blue. The self-reported anosmic patient marked with stripes (153) and hCoV-OC43+ is marked in light blue (2186). (F) COVID-19 samples (red) and controls (blue) do no cluster in PCA analysis with all genes (left) but do cluster when only OR genes (right) are considered. Sample with coronavirus hCoV-OC43 is highlighted in light blue (2186). (G) Z-scored expression of OR genes (top). Unsupervised clustering using only OR genes distinguish COVID-19 and control samples. Sample 2186 (light blue, hCov-OC43+), clusters with COVID-19 samples. (Bottom) Z score for Ebf1, Ebf2, and Lhx2, transcription factors with known role in the expression of OR/OR signaling genes. (H) MA-plot with OE genes (blue), OR genes (red), and RE genes (black). (I) Volcano plot of COVID-19 versus control RNA-seq data. Log2FC genes with abs(log2FC) ≥ 1 highlighted in red. Gene with padj < 0.05 are identified with blue fonts. (J) Boxplot representation of the normalized counts (MRN) grouped in COVID-19 positive and control specimens for Adcy3, Cnga2, Gfy, Gng13, aggregate OR, and Rtp1. Significance was calculated using Wilcoxon test. Significance value for OR downregulation does not change if we omit the most lowly expressed ORs (shown in the chevron-shaped distribution of the MA plot). (K) GO analysis for downregulated genes reveals enrichment for genes involved in sensory perception of smell. See also Figure S5K for GO analysis of upregulated genes.
Figure S6
Figure S6
FACS and HiC of OSN nuclei from human OE autopsies, related to Figure 7 (A) FACS data for control and COVID-19 human OE. Fixed DAPI positive, Lhx2/Atf5 double positive nuclei were collected for in situ HiC. (B) Reduction in HiC contacts in compartments formed by Adcy3, Gng3, Gfy, OMP, Grm7, Gap43, and Rtp1 genes.
Figure 7
Figure 7
SARS-CoV-2 infection of human OEs disrupts genomic OR compartments (A) In situ HiC maps from human OSNs depicting contacts between OR clusters in cis. Control is the lower triangle below the diagonal, and COVID-19 the upper triangle. Pixel intensity represents normalized number of contacts between pair of loci. Maximum intensity indicated at the top of each scale bar. Genomic position of OR clusters indicated as green bars; arrows indicate the same OR compartments for both conditions. (B) Contact maps revealing decrease in trans in situ HiC contacts in COVID-19+ OE versus control. Pixel intensity represents normalized number of contacts between pair of loci. Maximum intensity indicated at the top of each scale bar. Genomic position of OR clusters indicated as green bars; arrows indicate the same OR compartments for both conditions. (C) Heatmap depicting contacts between every human OR gene cluster (n = 82 OR clusters) arranged by chromosome. In situ HiC was performed on FAC-sorted OSNs from two control and four infected human OE autopsies. Reduction in OR contacts is observed both in trans and in cis. (D) Violin plot depicting the mean number of normalized trans HiC contacts between OR clusters genome wide at 100-kb resolution for each sample. Every dot indicates aggregated contacts for each OR-to-OR cluster pair in trans; p value < 0.05 was computed using Wilcoxon rank test. (E) HMM score for a given number of compartments indicating differences in genomic compartmentalization between two control (blue) and four infected samples (red).

Update of

Comment in

References

    1. Albers M.W., Tabert M.H., Devanand D.P. Olfactory dysfunction as a predictor of neurodegenerative disease. Curr. Neurol. Neurosci. Rep. 2006;6:379–386. - PubMed
    1. Baharlou H., Canete N.P., Bertram K.M., Sandgren K.J., Cunningham A.L., Harman A.N., Patrick E. AFid: A tool for automated identification and exclusion of autofluorescent objects from microscopy images. bioRxiv. 2019 - PubMed
    1. Bashkirova E., Lomvardas S. Olfactory receptor genes make the case for inter-chromosomal interactions. Curr. Opin. Genet. Dev. 2019;55:106–113. - PMC - PubMed
    1. Bashkirova E., Monahan K., Campbell C.E., Osinski J.M., Tan L., Schieren I., Barnea G., Xie X.S., Gronostajski R.M., Lomvardas S., et al. Homeotic regulation of olfactory receptor choice via NFI-dependent heterochromatic silencing and genomic compartmentalization. bioRxiv. 2020
    1. Bilinska K., Jakubowska P., Von Bartheld C.S., Butowt R. Expression of the SARS-CoV-2 entry proteins, ACE2 and TMPRSS2, in cells of the olfactory epithelium: Identification of cell types and trends with age. ACS Chem. Neurosci. 2020;11:1555–1562. - PMC - PubMed

Publication types

Substances