. 2022 May 4;110(9):1532-1546.e4.
doi: 10.1016/j.neuron.2022.01.025. Epub 2022 Feb 17.

Differential dendritic integration of long-range inputs in association cortex via subcellular changes in synaptic AMPA-to-NMDA receptor ratio

Affiliations

Differential dendritic integration of long-range inputs in association cortex via subcellular changes in synaptic AMPA-to-NMDA receptor ratio

Mathieu Lafourcade et al. Neuron. .

Abstract

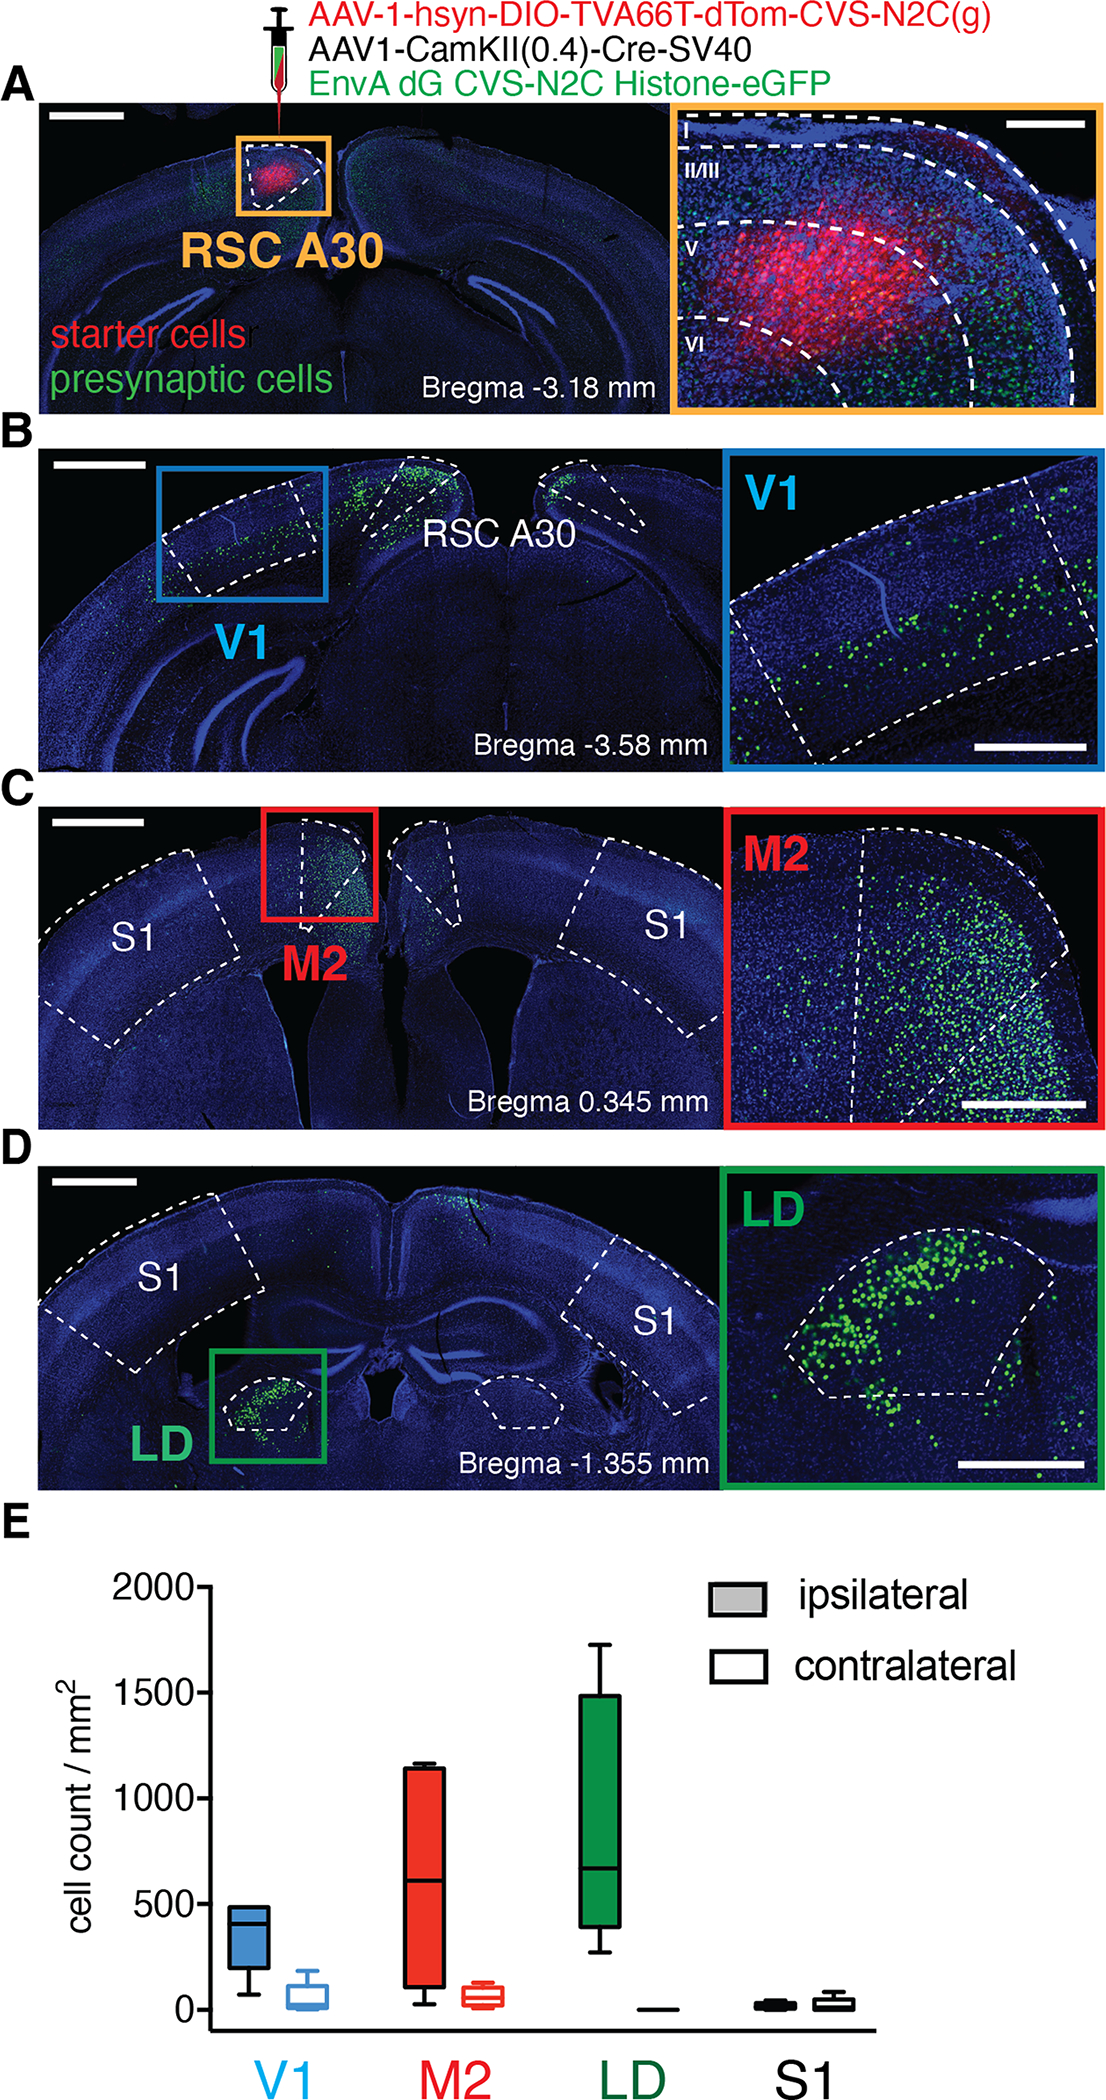
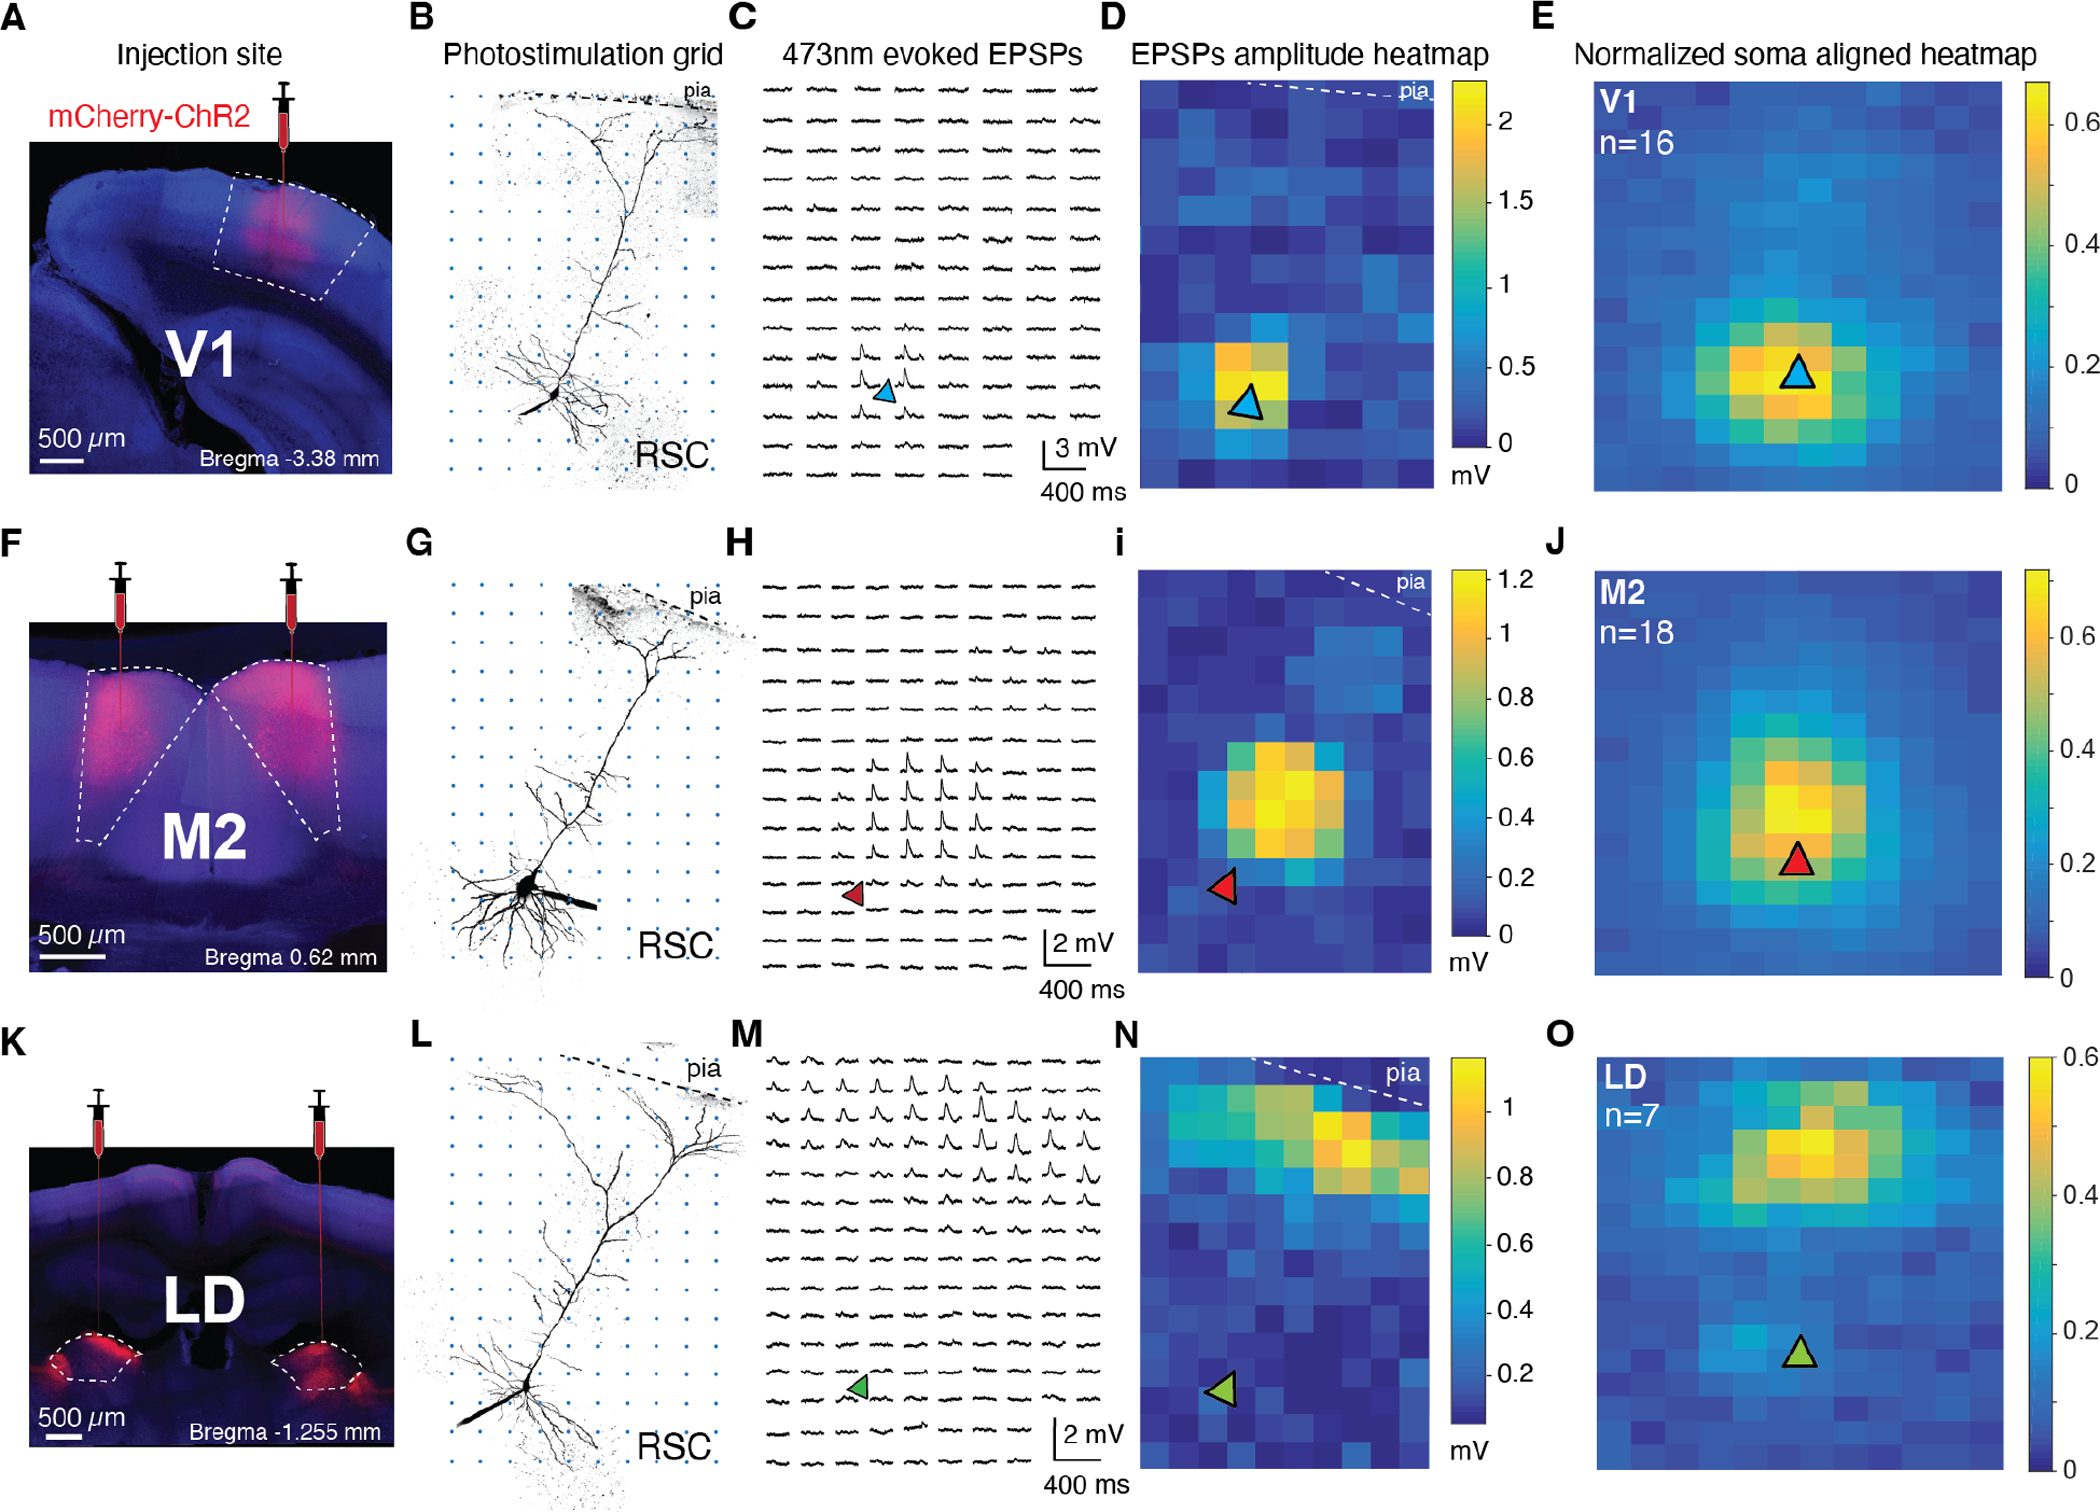
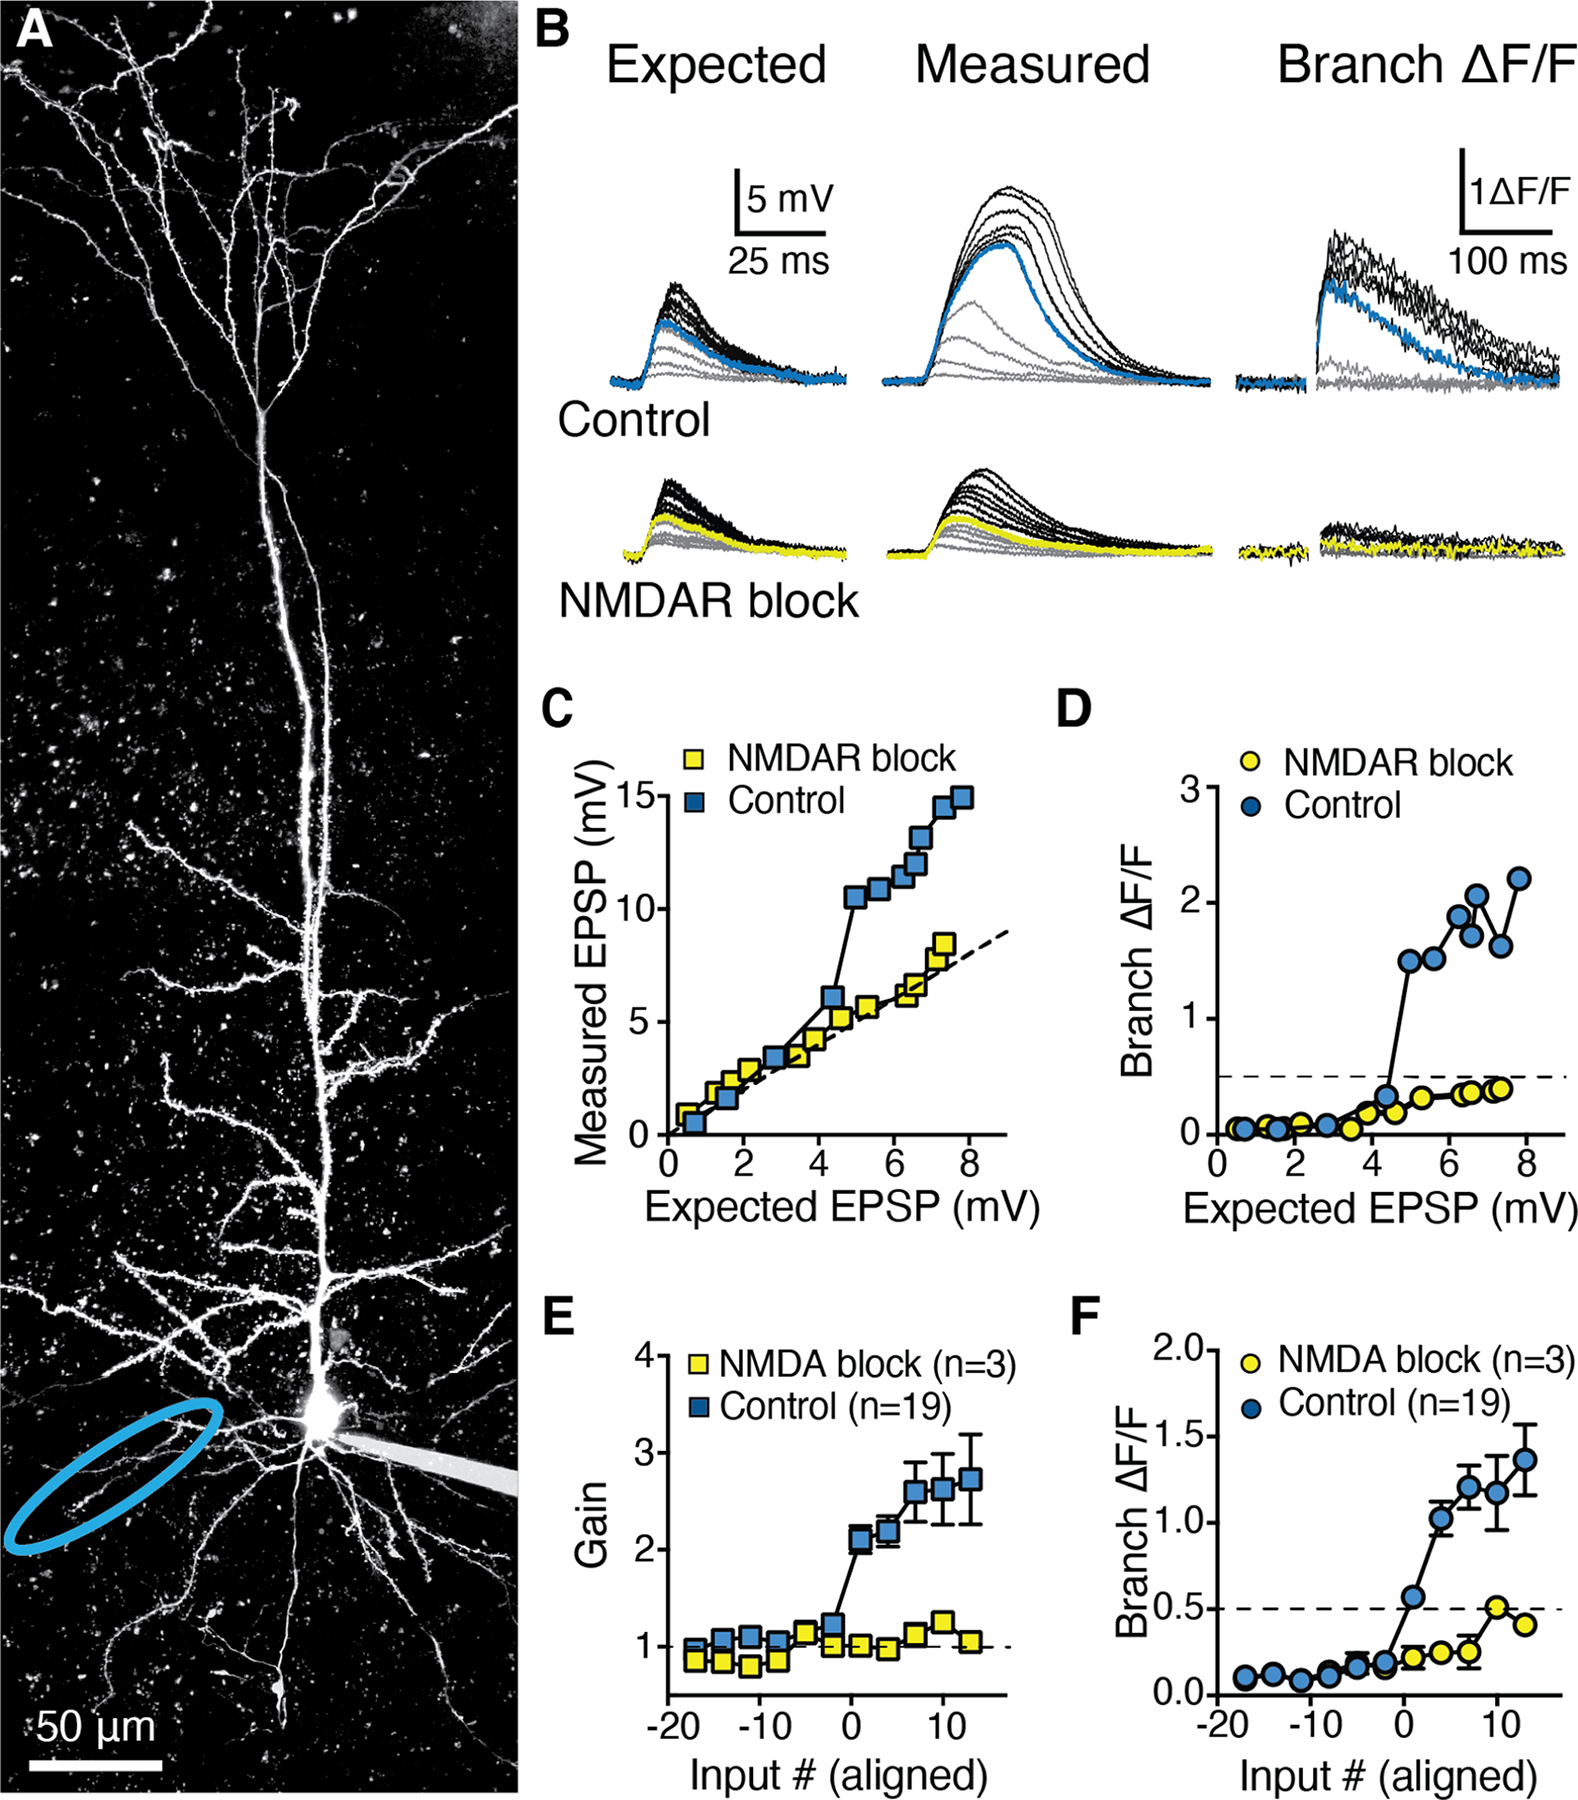
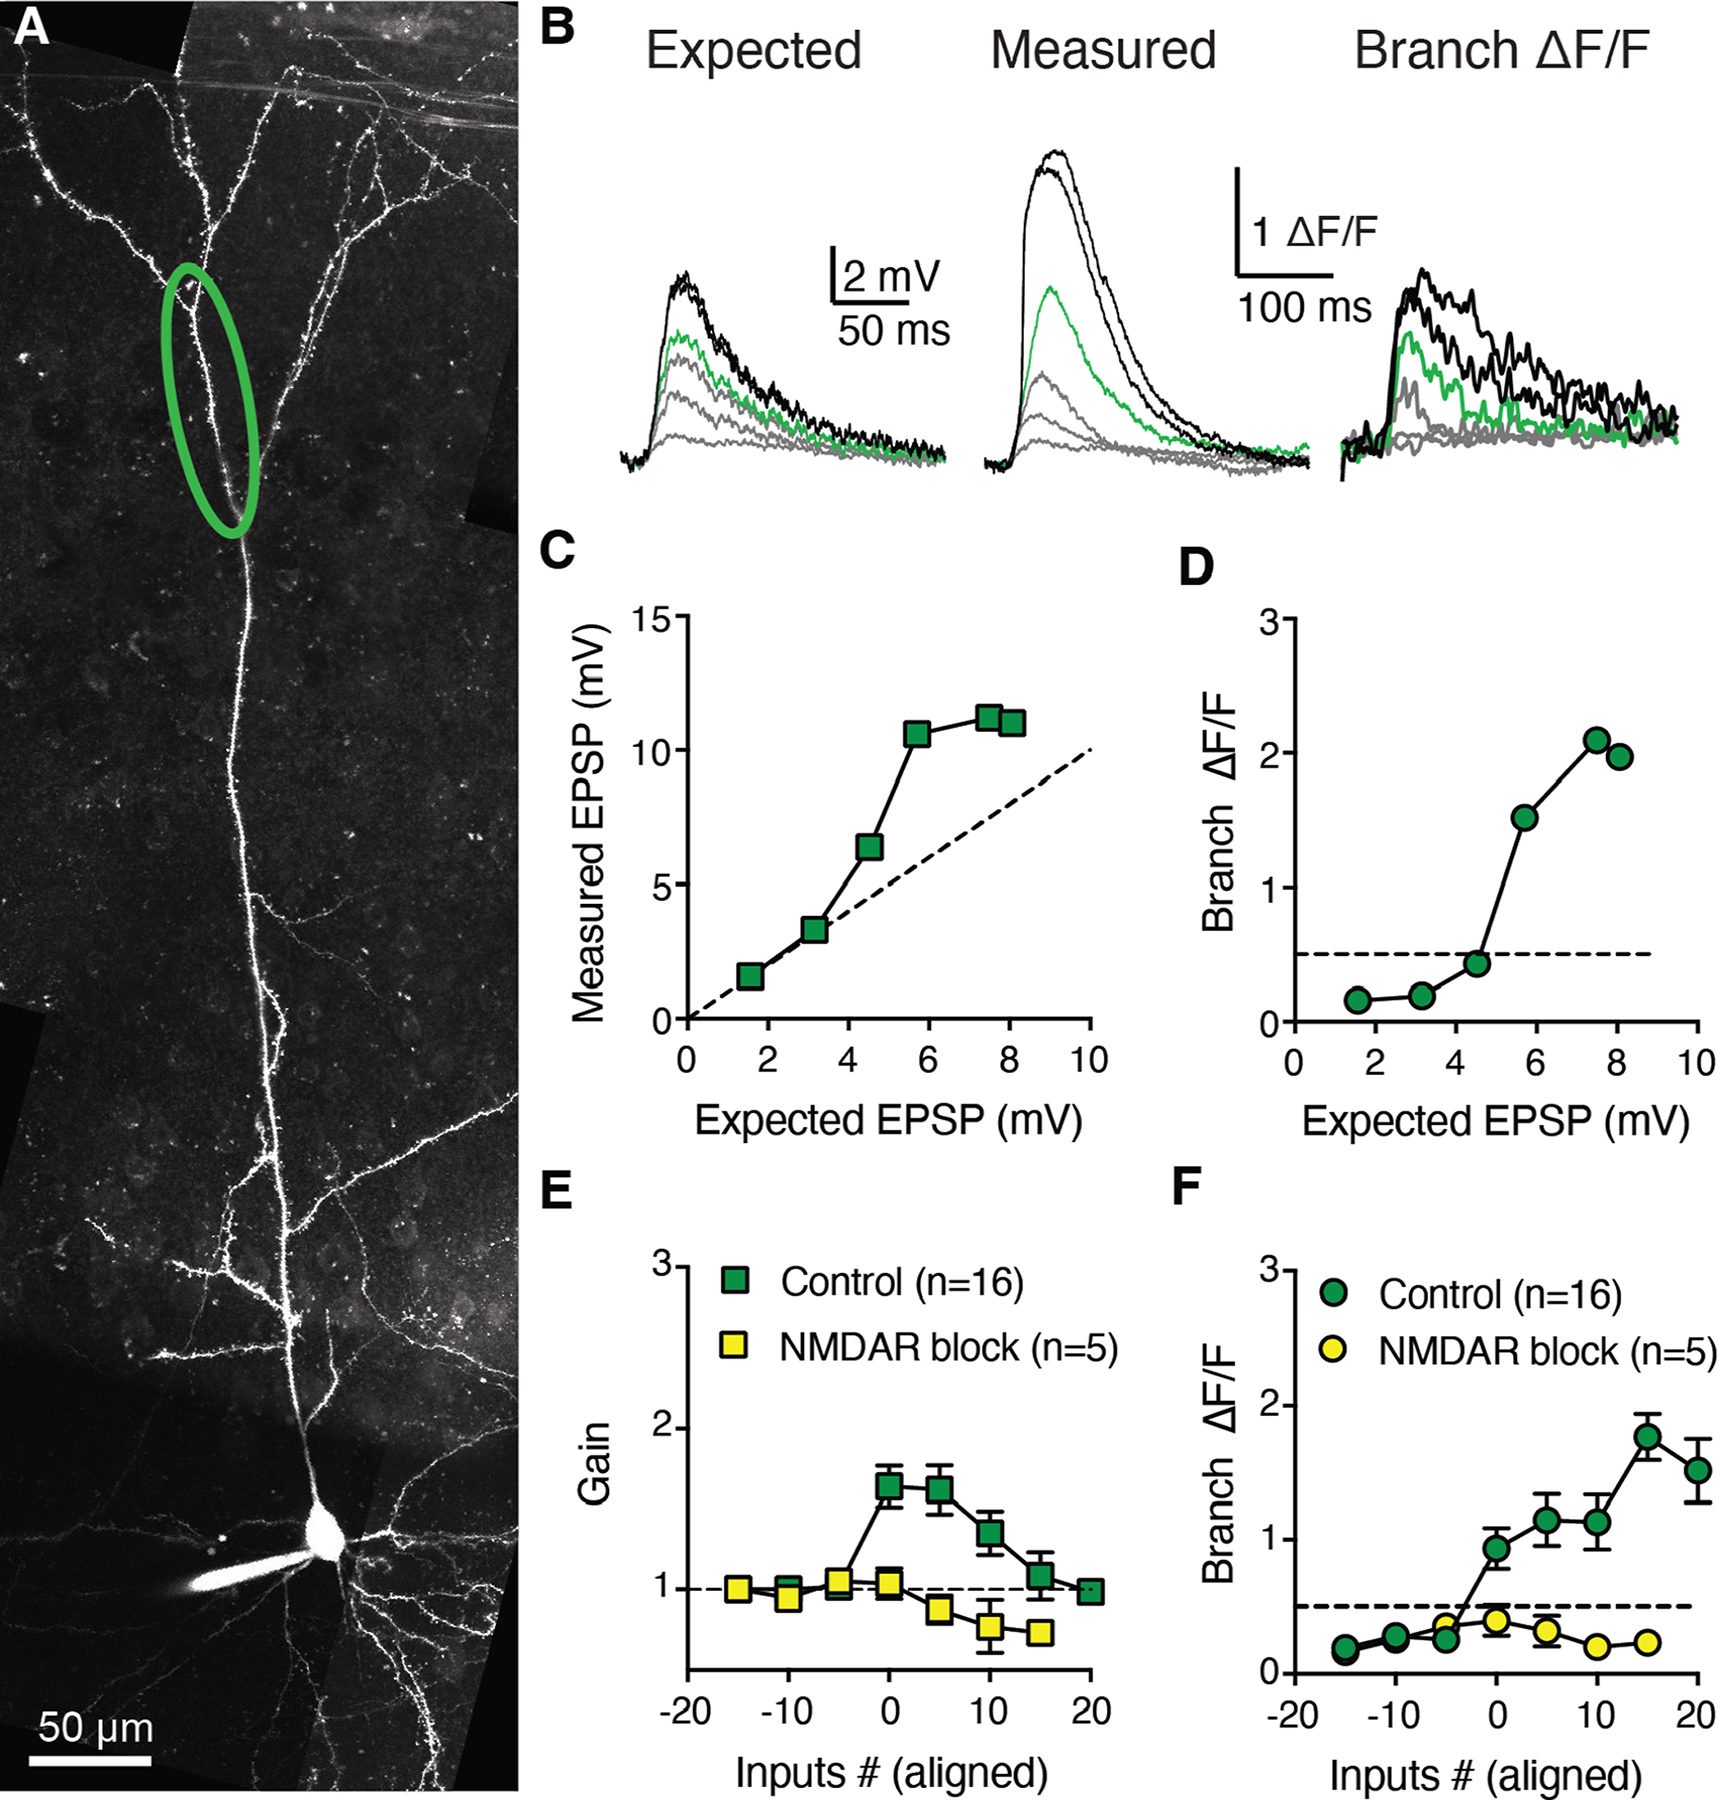
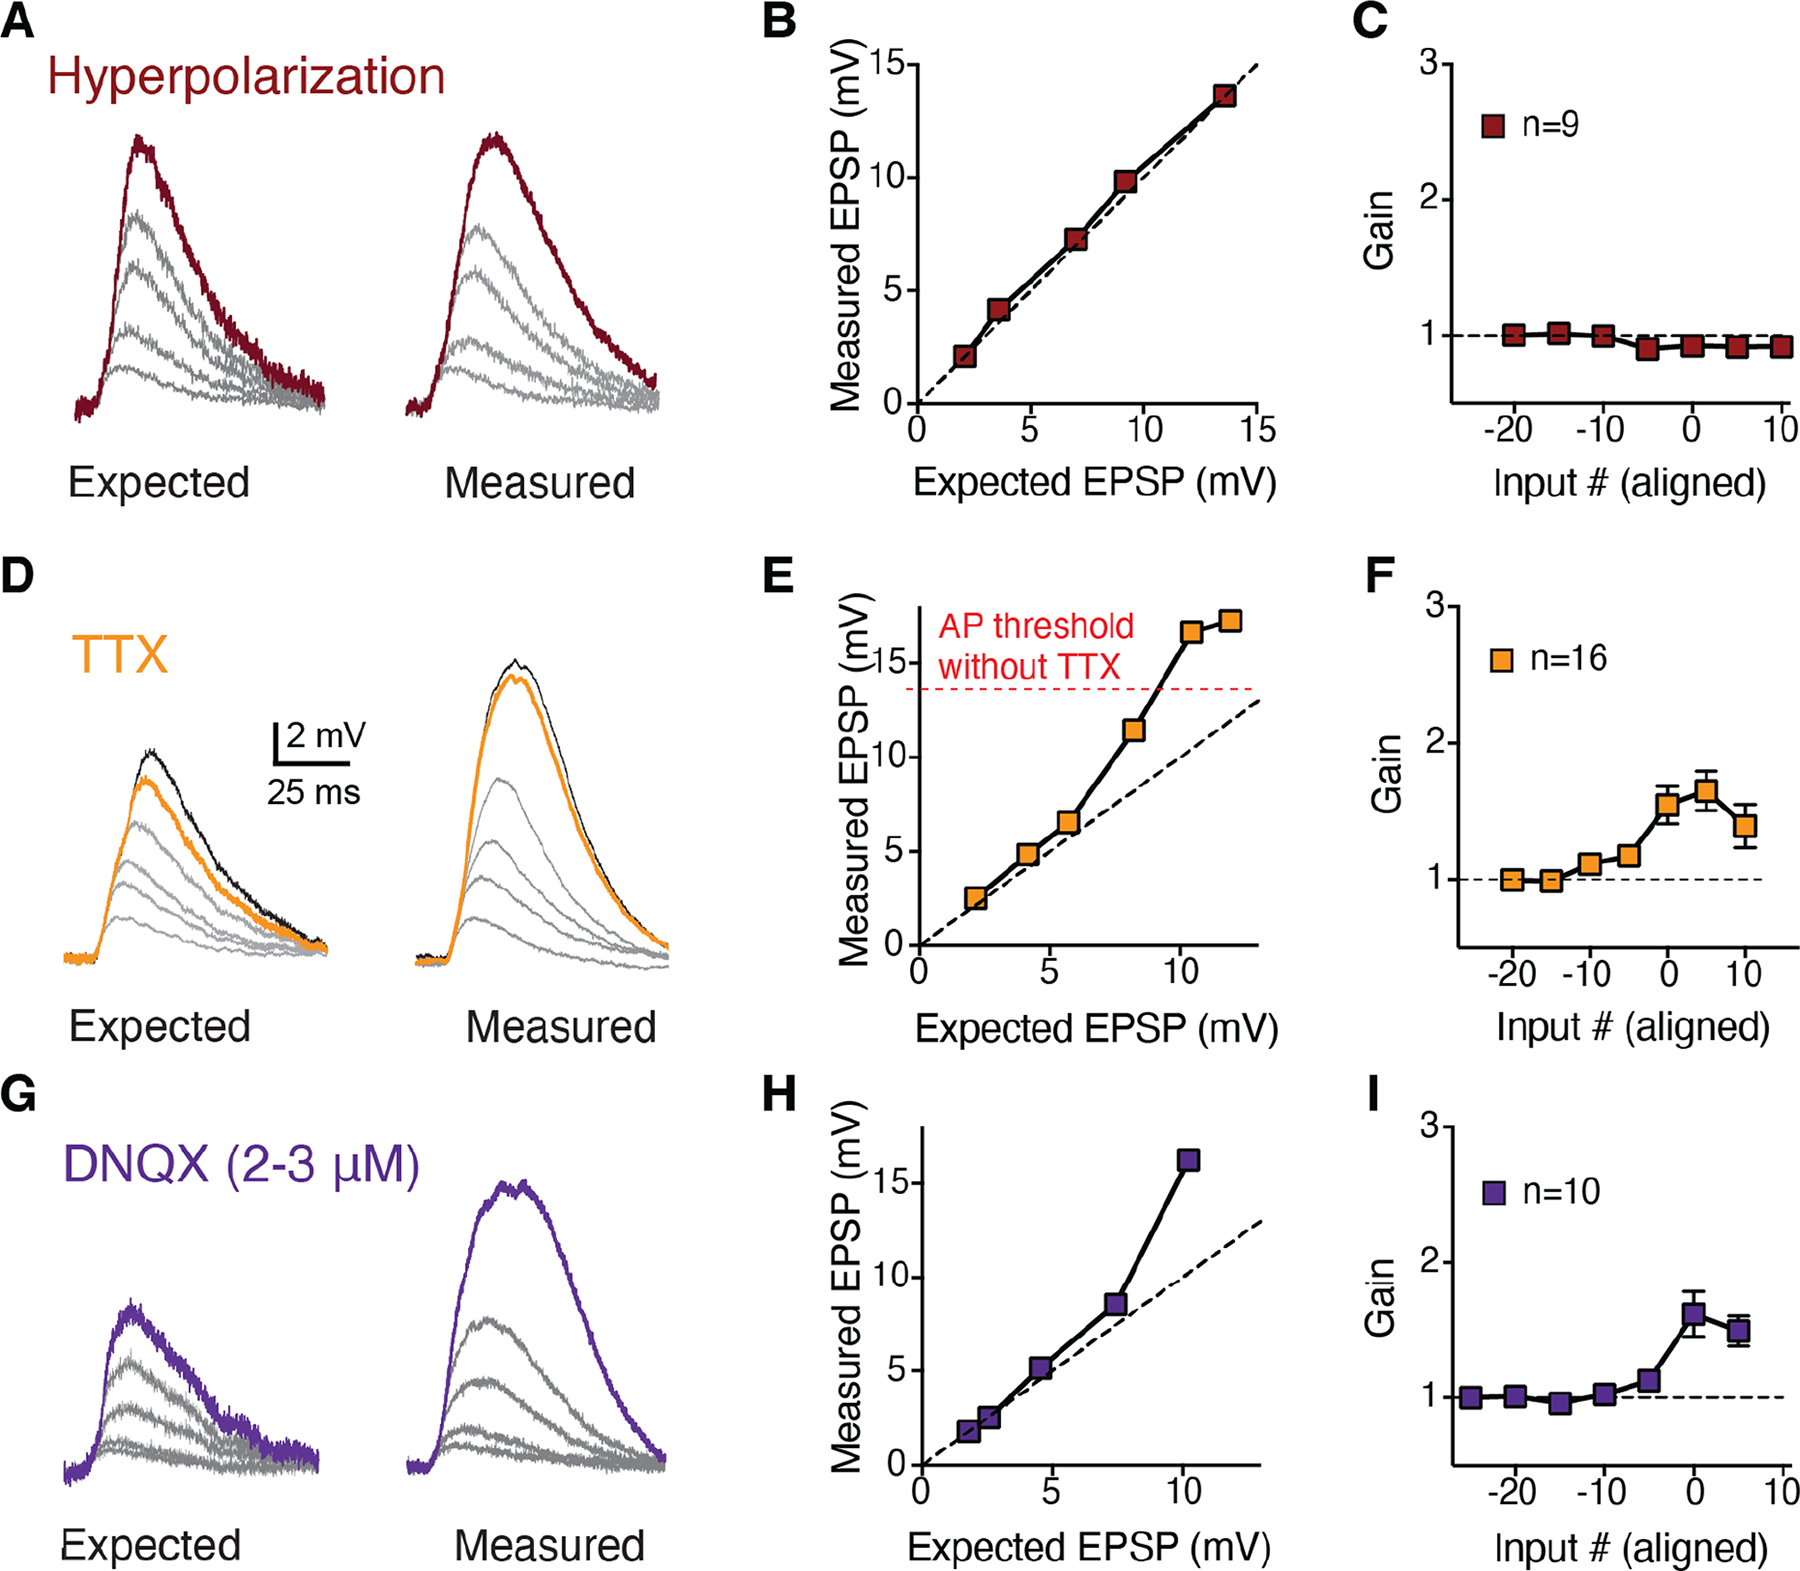
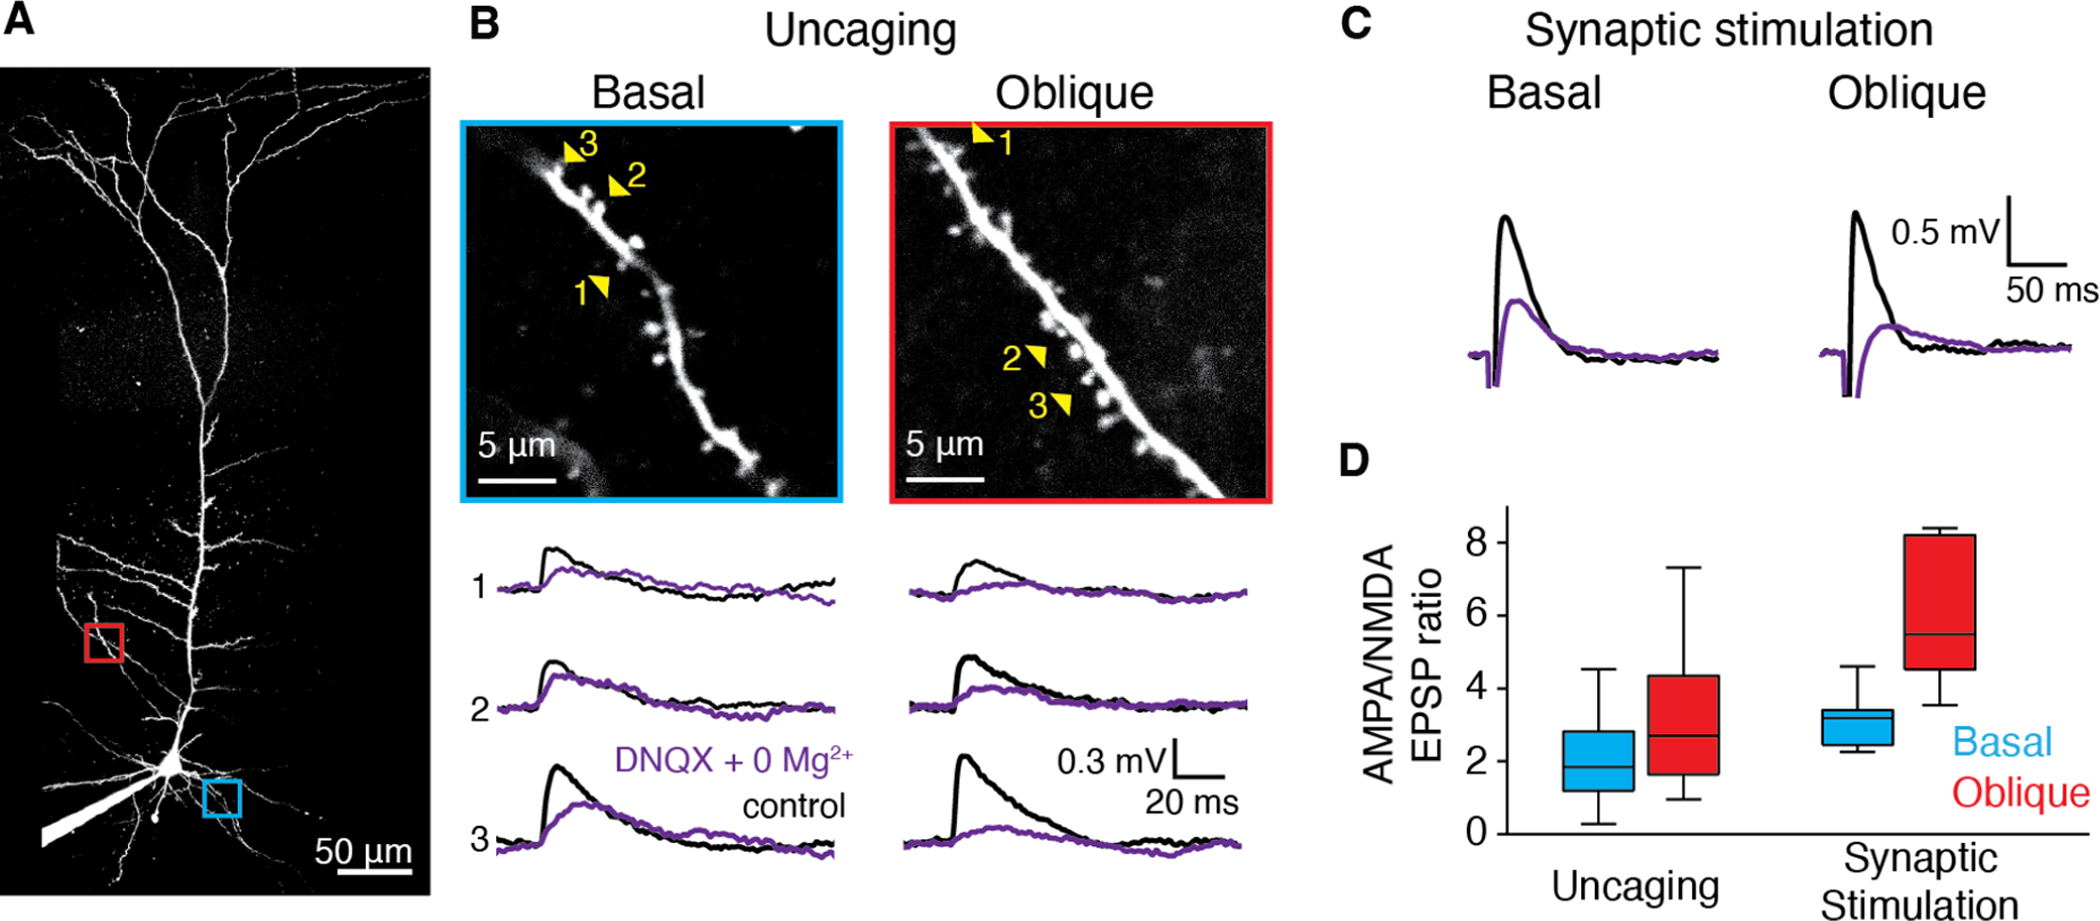
Synaptic NMDA receptors can produce powerful dendritic supralinearities that expand the computational repertoire of single neurons and their respective circuits. This form of supralinearity may represent a general principle for synaptic integration in thin dendrites. However, individual cortical neurons receive many diverse classes of input that may require distinct postsynaptic decoding schemes. Here, we show that sensory, motor, and thalamic inputs preferentially target basal, apical oblique, and distal tuft dendrites, respectively, in layer 5b pyramidal neurons of the mouse retrosplenial cortex, a visuospatial association area. These dendritic compartments exhibited differential expression of NMDA receptor-mediated supralinearity due to systematic changes in the AMPA-to-NMDA receptor ratio. Our results reveal a new schema for integration in cortical pyramidal neurons, in which dendrite-specific changes in synaptic receptors support input-localized decoding. This coexistence of multiple modes of dendritic integration in single neurons has important implications for synaptic plasticity and cortical computation.

Keywords: AMPA; L5b pyramidal cells; NMDA; dendritic integration; retrosplenial cortex; sCRACM.


Conflict of interest statement

Declaration of interests The authors declare no competing interests.

Figures

Figure 1:
Figure 1:. RSC Layer 5 cells receive monosynaptic input from V1, M2, and LD.
A, Unilateral injection of monosynaptic rabies-based retrograde tracing viruses in RSC A30. Left, confocal image of a coronal brain slice at the injection site, starter cells are labeled with tdTomato (red) and presynaptic cells with eGFP (green). Scale bar 0.5 mm. Right: Magnified orange square from left overlaid with cortical layer boundaries (from Allen Brain Atlas) showing starter cell infection localized to layer 5. Scale bar 200 μm. B, C, D, Presynaptic cells were found in V1, M2, and LD, respectively. Left images scale bar 1.0 mm. Right insets: magnified area of interest from right, scale bar 0.5 mm. E, Quantification of presynaptic cells (normalized by area) for V1, M2, LD, and S1 for both ipsi- (filled bars) and contra-lateral (empty bars) hemispheres (n=5 mice). Whisker plots include the medians (center lines), the first interquartile range (boxes) and the ±1.5 × interquartile range (whiskers). Values out of the 99.3 % coverage (outliers) have been excluded.
Figure 2:
Figure 2:. Excitatory monosynaptic inputs from V1, M2, and LD target distinct dendritic domains of RSC A30 L5b PCs.
A, F, K, Coronal slices showing injection sites of AAV2.hSyn-mCherry-ChR2 in V1, M2, and LD, respectively. See Fig. S2 for a summary of injection sites per region. B, G, L, Two-photon z-stacks of exemplar RSC A30 L5b PCs from animals injected in V1 (top), M2 (middle), and LD (bottom). Axons from injected brain regions were excited by a 473 nm photo-stimulation grid (50 μm spacing) over the recorded neurons, which were filled with Alexa-488 for post-hoc two-photon reconstruction. C, H, M, ChR2-evoked EPSPs from the exemplar cells at left recorded at each photo-stimulation location. EPSPs are only apparent when photo-stimulation spots activate functional synaptic contacts between injected brain regions and recorded cells in RSC. D, I, N, Corresponding exemplar heatmaps of EPSP amplitudes for the cells at left. E, J, O, Average normalized EPSP amplitude heatmaps aligned to soma position (triangle) for V1 (16 cells from 11 mice), M2 (18 cells from 13 mice), and LD (7 cells from 5 mice).
Figure 3:
Figure 3:. Highly supralinear integration in basal dendrites of RSC A30 L5b PCs mediated by NMDARs.
A, Two-photon z-stack of a L5b RSC A30 PC filled via somatic patch pipette with Alexa-594. B, Top: Expected uEPSPs calculated as the linear sum of somatic responses to glutamate uncaging at individual spines (left) versus measured uEPSPs recorded at the soma (middle) and local branch OGB-6F Ca2+ signals (right) for synchronous uncaging at increasing numbers of inputs. Blue traces indicate supralinear threshold (>50% ΔF/F) number of inputs in control conditions. Bottom: same as top, but in the presence of D-APV (50 μM) and MK-801 (10 μM) for the same branch. Yellow traces indicate the previous supralinear threshold from top. C, Measured uEPSP amplitude and D, Local branch ΔF/F, both as a function of expected uEPSP amplitude in control condition (blue) and in presence of NMDAR blockers (yellow) for the branch and traces shown in A and B. Dashed line indicates linearity (C) and supralinearity threshold (50% ΔF/F; D). E, Population input-output gain in control condition (blue squares, 19 basal branches from 14 neurons) and in presence of NMDAR blockers (yellow squares, paired experiments in 3 basal branches from 3 neurons), aligned by threshold number of inputs (>50% ΔF/F local branch Ca2+). See also Figure S4. F, Corresponding population branch Ca2+ signal in control condition and in presence of NMDAR blockers. Data points in E and F are mean±sem.
Figure 4:
Figure 4:. Modest, saturating NMDAR-dependent supralinear integration in tuft dendrites of RSC A30 L5b PCs.
A, Two-photon z-stack of a layer 5b RSC pyramidal neuron filled via somatic patch pipette with Alexa-594. B, Expected uEPSPs calculated as the linear sum of somatic responses to glutamate uncaging at individual spines (left). Measured uEPSPs recorded at the soma (middle) and local branch OGB-6F Ca2+ signals (right) for synchronous uncaging at increasing numbers of inputs. Green traces indicate supralinear threshold (>50% ΔF/F). C, Measured uEPSP amplitude as a function of expected uEPSP amplitude in control condition. Dashed line indicates linearity. D, Local branch ΔF/F as a function of expected uEPSP amplitude. Dashed line indicates supralinearity threshold (50% ΔF/F). E, Population input-output gain in control condition (green squares, 16 tuft branches from 12 L5b RSC neurons) and in presence of NMDAR blockers (yellow squares, paired experiments from 5 tuft branches), aligned by threshold number of inputs. F, Corresponding population branch Ca2+ signal relationship in control condition and in presence of NMDAR blockers. Data points in E and F are mean±sem.
Figure 5:
Figure 5:. Linear integration in RSC A30 L5b PC oblique dendrites.
A, Two-photon z-stack of an RSC A30 L5b PC filled via somatic patch pipette with Alexa-594 with an oblique branch of interest indicated in red. B, Expected uEPSPs calculated as the linear sum of somatic responses to glutamate uncaging at individual spines (left). Measured uEPSPs recorded at the soma (middle) and local branch OGB-6F Ca2+ signals (right) for synchronous uncaging at increasing numbers of inputs. Red traces indicate supralinear threshold (>50% ΔF/F) in control conditions concomitant with axonal action potential initiation. C, Measured uEPSP amplitude as a function of expected uEPSP amplitude in control condition for the cell, branch, and traces shown in a and b. Dashed line indicates linearity, light red boxes indicate AP initiation. D, Local branch ΔF/F as a function of expected uEPSP amplitude. Dashed line indicates supralinearity threshold (50% ΔF/F) E, Population input-output gain for control (red squares, 45 oblique branches from 34 neurons) and paired NMDAR blockade (yellow squares, 6 branches from 6 neurons), aligned by threshold. F, Corresponding population analysis of branch Ca2+ signals. Data points in E and F are mean±sem.
Figure 6:
Figure 6:. Linear integration in oblique dendrites is consistent with increased synaptic AMPA:NMDA.
A, Example traces of increasing numbers of activated spines for expected (left) and measured (right) uEPSPs after hyperpolarizing the somatic membrane potential to decouple potential branch Na+ spikes from the axon. B, Measured versus expected plot of the data in a. Dashed unity line represents linear integration. C, Summary of uEPSP gain as a function of input number for 9 hyperpolarization experiments, aligned by pre-hyperpolarization AP threshold. D, Example traces of increasing numbers of activated spines for expected (left) and measured (right) uEPSPs in the presence of TTX to block axonal AP initiation, revealing supralinearity at depolarized potentials previously masked by APs. E, Measured versus expected plot of the data in D. F, Population input-output gain in TTX for 16 branches, aligned by threshold local branch Ca2+ signal. G, Example traces of to increasing numbers of activated spines for expected (left) and measured (right) uEPSPs in the presence of subsaturating DNQX to decrease AMPA:NMDA. H, Measured versus expected plot of the data in G. I, Population input-output gain for 10 subsaturating DNQX experiments shows supralinear branch integration prior to AP initiation. Data points in C, F and I are mean±sem.
Figure 7:
Figure 7:. Synapses at apical oblique dendrites exhibit higher AMPA:NMDA receptor ratio than those at basal dendrites.
A, Two-photon z-stack of an RSC A30 L5b PC filled via somatic patch pipette with Alexa-488. Basal branch of interest indicated in blue and oblique branch of interest indicated in red. B, Magnified view of basal and oblique branches from A. C, Example averaged voltage traces recorded in current clamp mode at the soma in response to glutamate uncaging at individual spines indicated by numbered yellow arrowheads in B, for basal (left) and oblique (right) branches in control aCSF (black) and after wash in of Mg+2-free plus 20 μM DNQX aCSF (purple). C, Same as b, but for focal extracellular synaptic stimulation. D, Ratio of averaged peak somatic uEPSPs in control and Mg+2-free plus 20 μM DNQX aCSF for uncaging at single spines (left) and focal synaptic stimulation (right). Left: n=66 spines on basal (blue) branches (from 6 cells, 3 mice) versus 64 spines on oblique (red) branches (from 6 cells, 3 mice), p=0.0005, Mann-Whitney U test. Right: n=6 basal (blue) branches (from 6 cells, 4 mice) and 6 oblique (red) branches (from 6 cells, 4 mice) p<0.01, Mann-Whitney U test. Whisker plots show medians (center lines), first interquartile range (boxes) and ±1.5 × interquartile range (whiskers). Values out of the 99.3% coverage (outliers) have been excluded.

Comment in

References

    1. Abrahamsson T et al. (2012) ‘Thin Dendrites of Cerebellar Interneurons Confer Sublinear Synaptic Integration and a Gradient of Short-Term Plasticity’, Neuron. Elsevier Inc, 73(6), pp. 1159–1172. doi: 10.1016/j.neuron.2012.01.027. - DOI - PubMed
    1. Alexander AS et al. (2020) ‘Egocentric boundary vector tuning of the retrosplenial cortex’, Science Advances, 6(8). doi: 10.1126/sciadv.aaz2322. - DOI - PMC - PubMed
    1. Alexander AS and Nitz DA (2015) ‘Retrosplenial cortex maps the conjunction of internal and external spaces’, Nature Neuroscience, 18(8), pp. 1143–1151. doi: 10.1038/nn.4058. - DOI - PubMed
    1. Andrásfalvy BK and Magee JC (2001) ‘Distance-dependent increase in AMPA receptor number in the dendrites of adult hippocampal CA1 pyramidal neurons’, Journal of Neuroscience, 21(23), pp. 9151–9159. doi: 10.1523/jneurosci.21-23-09151.2001. - DOI - PMC - PubMed
    1. Ariav G, Polsky A and Schiller J (2003) ‘Submillisecond precision of the input-output transformation function mediated by fast sodium dendritic spikes in basal dendrites of CA1 pyramidal neurons’, Journal of Neuroscience, 23(21), pp. 7750–7758. doi: 10.1523/jneurosci.23-21-07750.2003. - DOI - PMC - PubMed

Publication types

MeSH terms

Substances