. 2022 May:51:102264.
doi: 10.1016/j.redox.2022.102264. Epub 2022 Feb 12.

Voltage Dependent Anion Channel 3 (VDAC3) protects mitochondria from oxidative stress

Affiliations

Voltage Dependent Anion Channel 3 (VDAC3) protects mitochondria from oxidative stress

Simona Reina et al. Redox Biol. 2022 May.

Abstract

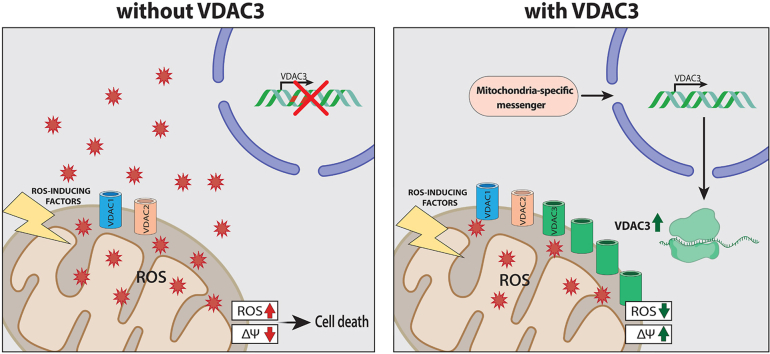
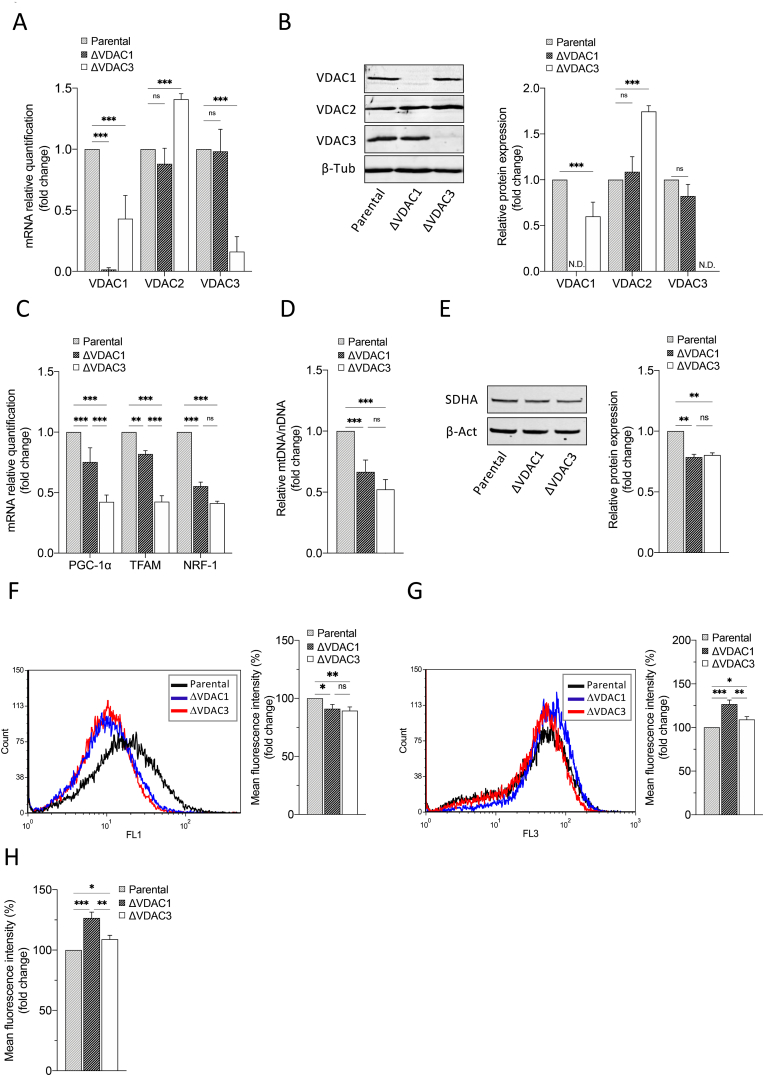
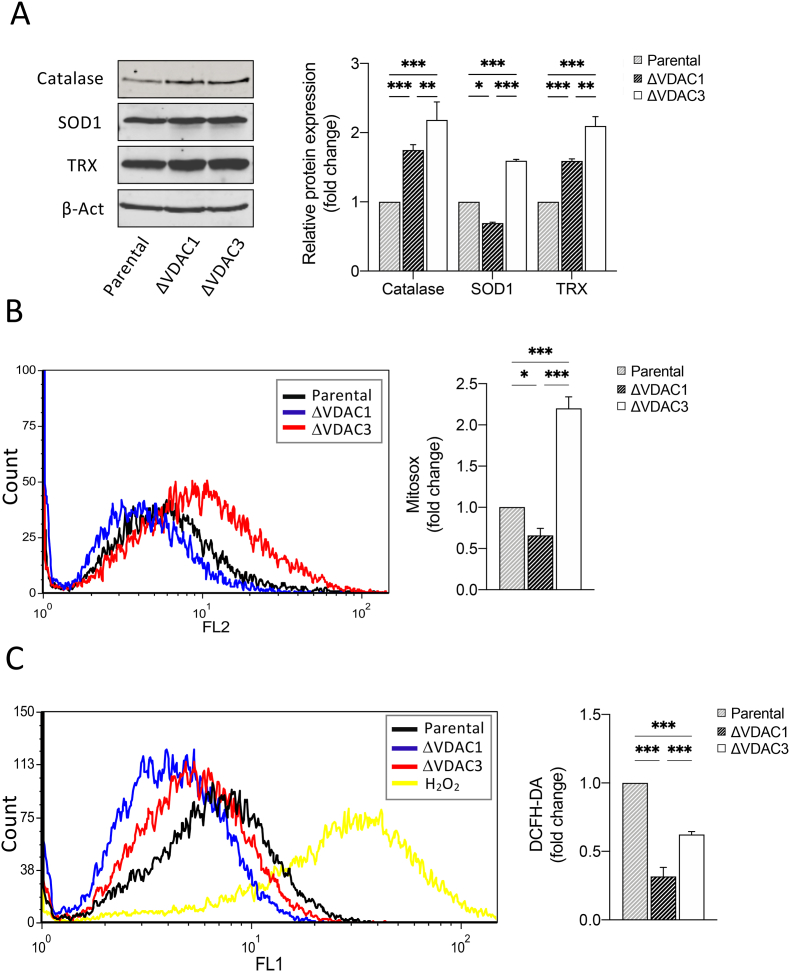
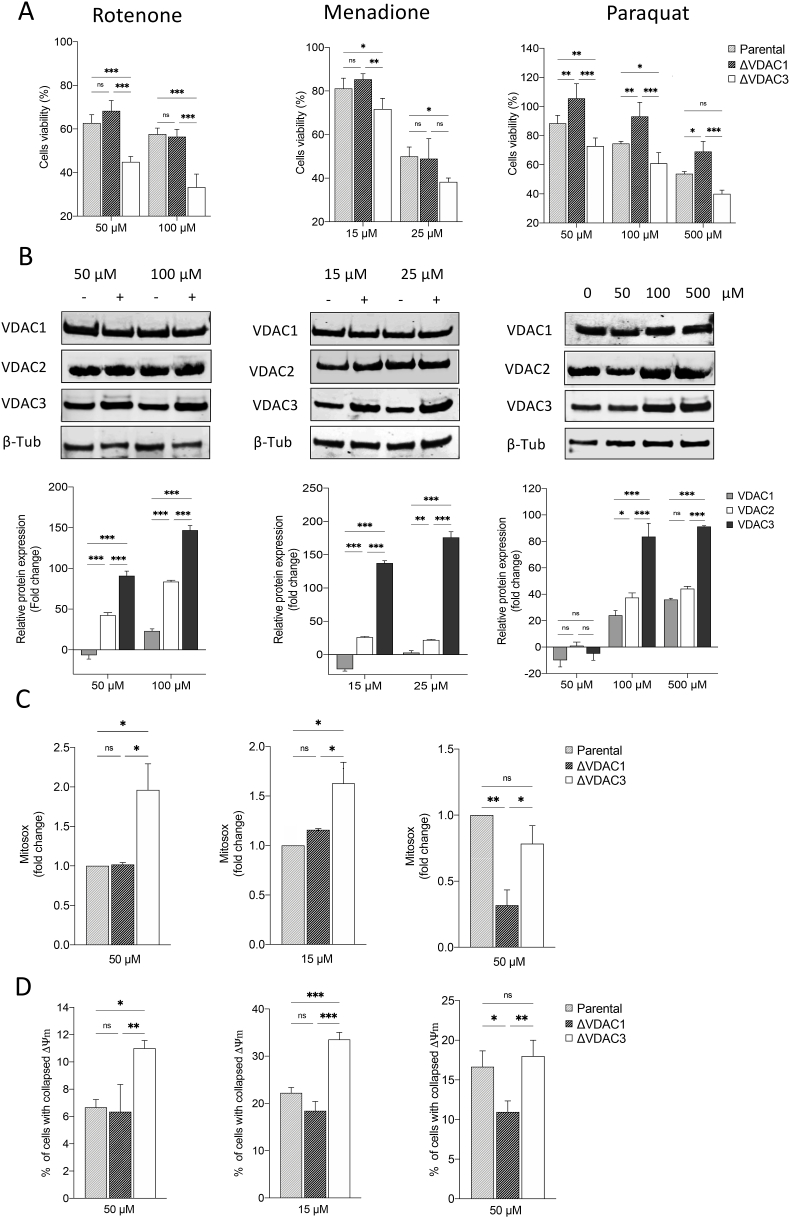
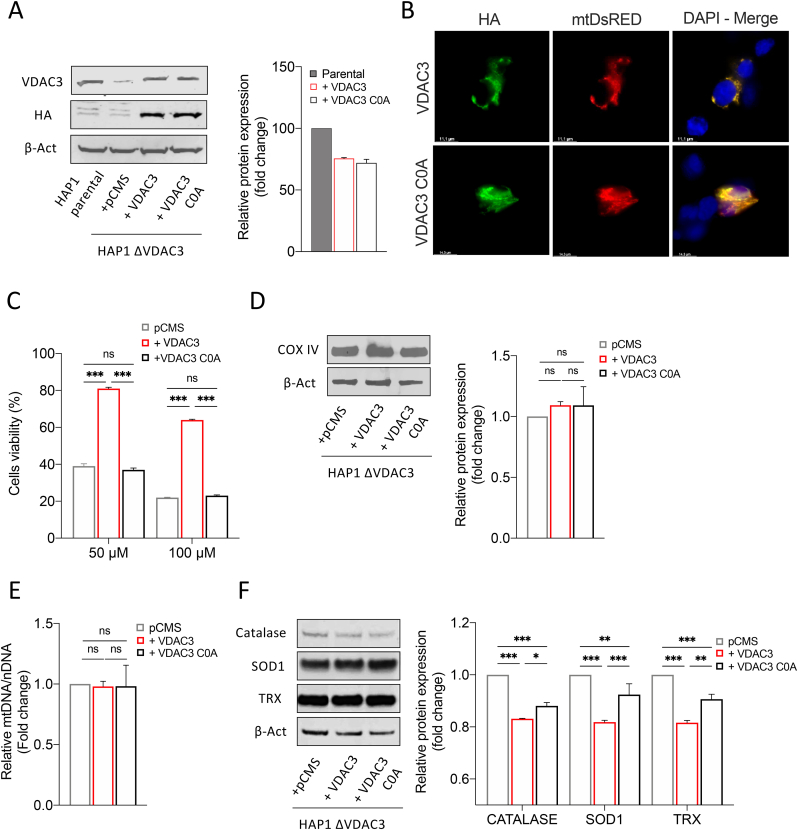
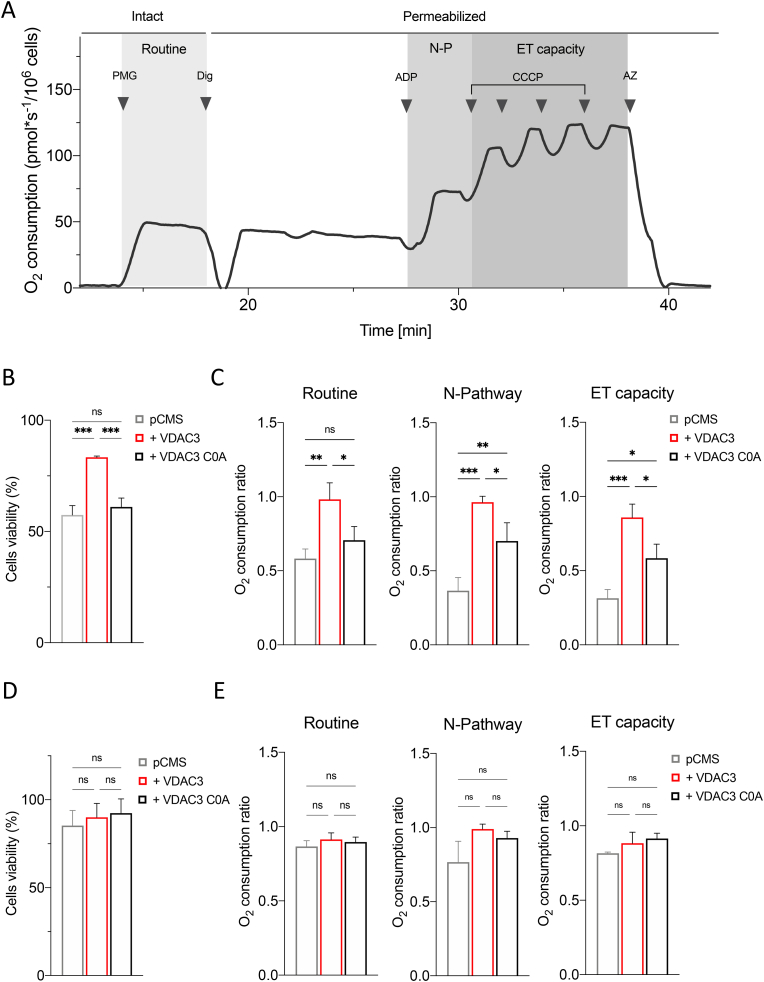
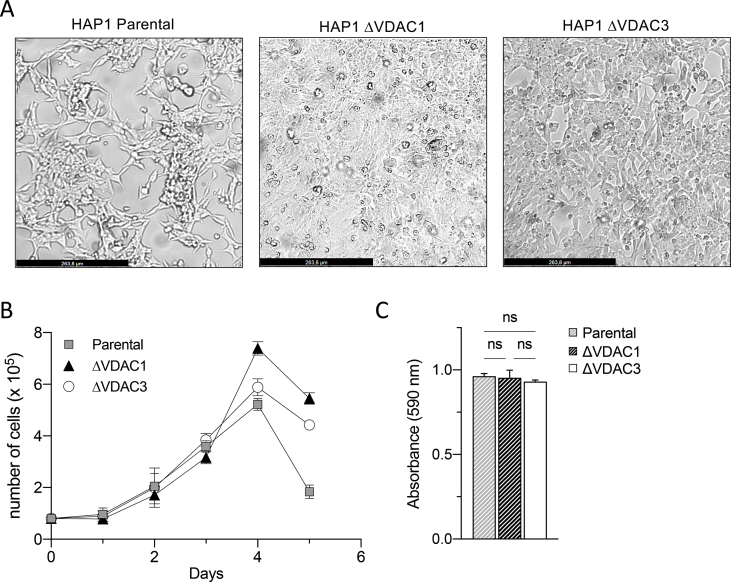
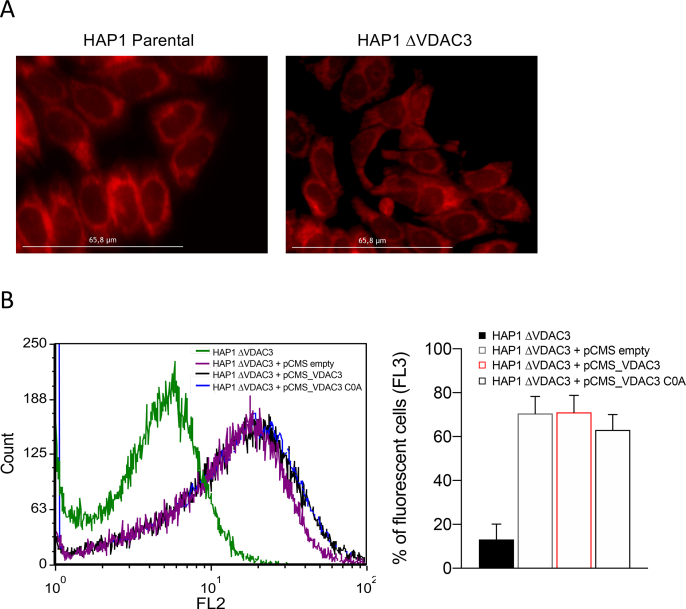
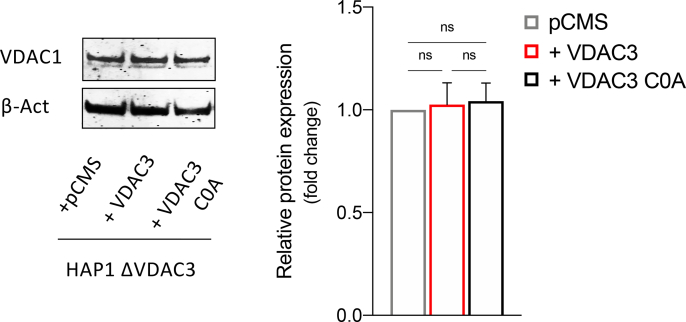
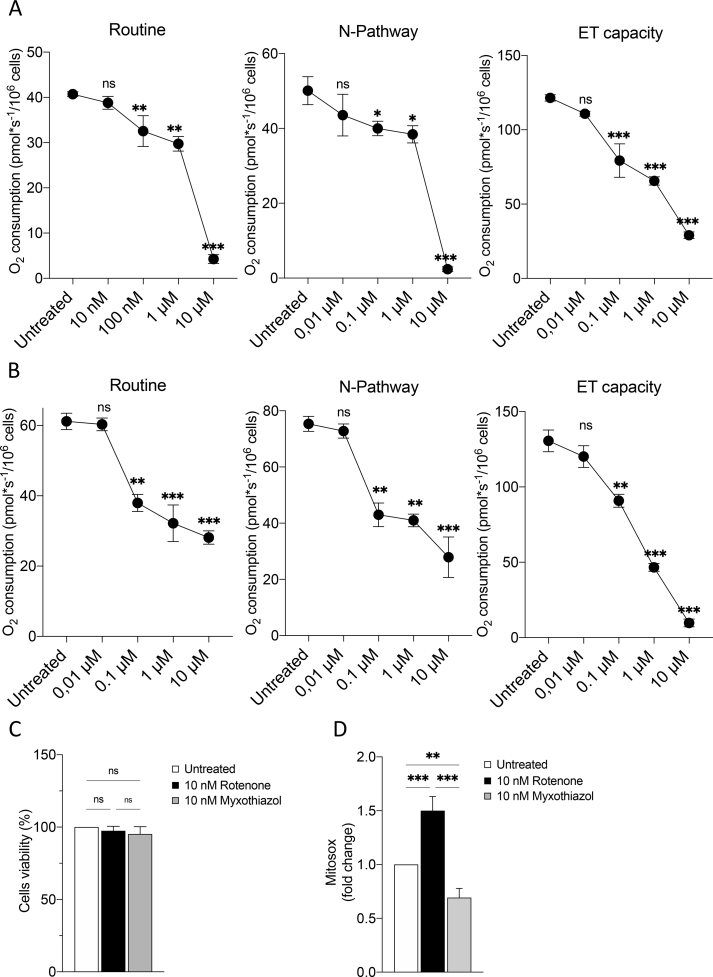
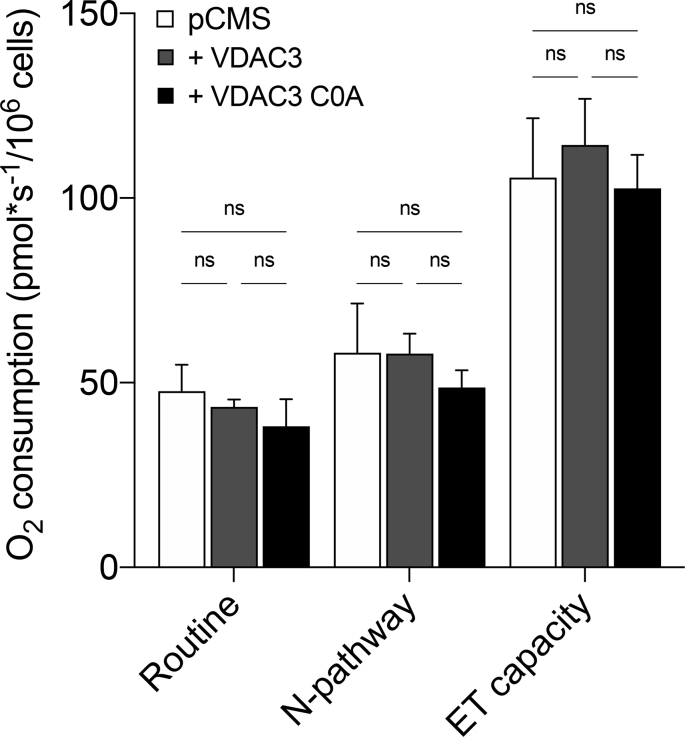
Unraveling the role of VDAC3 within living cells is challenging and still requires a definitive answer. Unlike VDAC1 and VDAC2, the outer mitochondrial membrane porin 3 exhibits unique biophysical features that suggest unknown cellular functions. Electrophysiological studies on VDAC3 carrying selective cysteine mutations and mass spectrometry data about the redox state of such sulfur containing amino acids are consistent with a putative involvement of isoform 3 in mitochondrial ROS homeostasis. Here, we thoroughly examined this issue and provided for the first time direct evidence of the role of VDAC3 in cellular response to oxidative stress. Depletion of isoform 3 but not isoform 1 significantly exacerbated the cytotoxicity of redox cyclers such as menadione and paraquat, and respiratory complex I inhibitors like rotenone, promoting uncontrolled accumulation of mitochondrial free radicals. High-resolution respirometry of transiently transfected HAP1-ΔVDAC3 cells expressing the wild type or the cysteine-null mutant VDAC3 protein, unequivocally confirmed that VDAC3 cysteines are indispensable for protein ability to counteract ROS-induced oxidative stress.

Keywords: Complex I; Cysteine; High-resolution respirometry; Mitochondria; ROS; VDAC3.


Conflict of interest statement

The authors declare that they have no affiliations with or involvement in any organization or entity with any financial interest (such as honoraria; educational grants; participation in speakers’ bureaus; membership, employment, consultancies, stock ownership, or other equity interest; and expert testimony or patent-licensing arrangements), or non-financial interest (such as personal or professional relationships, affiliations, knowledge or beliefs) in the subject matter or materials discussed in this manuscript.

Figures

Image 1
Graphical abstract
Fig. 1
Fig. 1
Molecular characterization of HAP1 cell lines. A. Relative quantification of VDAC1, VDAC2 and VDAC3 mRNAs in HAP1-ΔVDAC1 and HAP1-ΔVDAC3. Data are normalized to the β-actin and expressed as means ± SEM (n = 3) and compared to HAP1 parental cells (equals one). B. Western blot illustration and relative quantification of VDAC1, VDAC2 and VDAC3 protein levels in HAP1-ΔVDAC1 and HAP1-ΔVDAC3. Data are normalized to the β-tubulin, expressed as means ± SEM (n = 3) and compared to HAP1 parental cells. C. Relative quantification of PGC-1α, NRF1 and TFAM (mitochondrial biogenesis markers) mRNAs in HAP1-ΔVDAC1 and HAP1-ΔVDAC3. Data are normalized to the β-actin and expressed as means ± SEM (n = 4) and compared to HAP1 parental cells. D. Quantification of mitochondrial DNA (mtDNA) in HAP1 cell lines devoid of VDAC1 or VDAC3. mtDNA amount was measured by Real-Time PCR of the mitochondrial gene COXII and normalized to the nuclear gene APP. Data are expressed as means ± SEM (n = 3) and compared to HAP1 parental cells. E. Quantification of mitochondrial content. Western blot illustration and relative quantification of mitochondrion-specific protein SDHA level in HAP1-ΔVDAC1 and HAP1-ΔVDAC3. Data are normalized to the β-Actin, expressed as means ± SEM (n = 3) and compared to HAP1 parental cells. F. Measurement of mitochondrial mass using MitoTracker Green. Representative fluorescence profiles of cells populations for the three cells lines. Histogram reports the average of fluorescence intensity measured by flow cytometry for the three HAP1 cell lines after proper gating of fluorescence. Gates were established based on negative and positive controls. Data are indicated as means ± SEM (n = 3) and compared to HAP1 parental cells. G. Detection of mitochondrial membrane potential by Mitotracker Red and measured by flow cytometry in each population of the three HAP1 cell lines. Histograms show the average fluorescence intensity measured for each gated cell population analyzed. Data are indicated as means ± SEM (n = 3) and compared to HAP1 parental cells. H. Quantification of mitochondrial membrane potential normalized for mitochondrial mass in HAP1 cell lines devoid of VDAC1 and VDAC3. Data are expressed as means ± SEM (n = 3) and compared to parental cell line. Data were analyzed with One-Way or Two-Way ANOVA; with *p < 0.05 **p < 0.01 and ***p < 0.001. (For interpretation of the references to colour in this figure legend, the reader is referred to the Web version of this article.)
Fig. 2
Fig. 2
Analysis of mitochondrial superoxide content and quantification of the expression levels of the main antioxidant enzymes in HAP1 cell lines. A. Representative immunoblot and relative protein quantification of antioxidant enzymes (Catalase, superoxide dismutase 1 (SOD1) and Thioredoxin (TRX)) in HAP1-ΔVDAC1 and HAP1-ΔVDAC3. Data are normalized to the β-actin, expressed as means ± SEM (n = 3) and compared to HAP1 parental cell line. B. Mitochondrial superoxide determination by MitoSOX red probe. Representative MitoSOX Red fluorescence profiles evaluated by flow cytometry in each population of HAP1 cell lines (left). Quantitative analysis of the mean fluorescence intensity MitoSOX Red in each population of HAP1 cell line. Results are expressed as the mean ± SD (n = 3) and compared to HAP1 parental cells (right). Results are expressed as the mean ± SD (n = 3) and compared to HAP1 parental cells. C. Intracellular ROS detected by DCFH-DA fluorescence measured by flow cytometer. Representative fluorescence profiles detected by flow cytometry for each cell line (left). Quantitative analysis of the average fluorescence intensity of DCFH-DA (%) in each gated population of HAP1 cell lines (right). Results are expressed as the mean ± SD (n = 3) and compared to HAP1 parental cell line. Data were analyzed with Two-Way ANOVA or One-Way ANOVA; with *p < 0.05 **p < 0.01 and ***p < 0.001. (For interpretation of the references to colour in this figure legend, the reader is referred to the Web version of this article.)
Fig. 3
Fig. 3
Effect of mitochondrial ROS-inducers on cell viability, VDAC isoforms expression and mitochondria functionality. A. Cell viability of HAP1 cell lines treated with different concentrations of mitochondrial ROS-inducers (i.e., rotenone, menadione and paraquat). Data are indicated as the mean ± SE (n = 6) and expressed as the percentage ratio of the treated cells to the untreated ones. B. Relative quantification of VDAC1, VDAC2 and VDAC3 protein levels in HAP1 parental cells treated with increasing concentrations of rotenone, menadione and paraquat. All values are normalized to the β-tubulin endogenous control and expressed as means ± SEM (n = 3). C. Measurement of mitochondrial superoxide production via staining with MitoSOX Red after treatments with drugs. Data are expressed as mean ± SD (n = 3) and compared to HAP1 parental cell line. D. Mitochondrial membrane potential estimated by TMRM fluorescence measured with flow cytometry in HAP1 cell lines after drug administrations. Quantifications of percentage of cells with collapsed Δψm are indicated as means ± SEM (n = 3); mitochondrial membrane potential is normalized to mitochondrial mass value and expressed as the ratio of the treated cells to the untreated. Data were analyzed with Two-Way ANOVA or One-Way ANOVA; with *p < 0.05 **p < 0.01 and ***p < 0.001.
Fig. 4
Fig. 4
Evaluation of HAP1-ΔVDAC3 cell profile upon transfection with VDAC3 wild type and VDAC3 cys-null mutant. A. Transfection efficiency of HAP1-ΔVDAC3 transfected with VDAC3 wild type (+VDAC3) and VDAC3 cys-null (+VDAC3 C0A) mutant was calculated by relative western blot quantification of VDAC3 proteins in HAP1-ΔVDAC3 compared to the endogenous protein level in HAP1 parental cells. Data were normalized with β-actin, expressed as means ± SEM (n = 3). Anti-HA is shown as control. B. Fluorescence microscopy analysis of subcellular distribution of VDAC3 and VDAC3 C0A in HAP1- ΔVDAC3 by indirect immunofluorescence targeting the HA tag. Mitochondria were visualized by expressing the mitochondrial-targeted mtDsRed protein. Both exogenous proteins are co-localized with mitochondria. C. Cell viability of HAP1-ΔVDAC3 upon transfection with an empty vector (pCMS) or plasmid encoding either for the VDAC3 (+VDAC3) or the VDAC3 C0A (+VDAC3 C0A) and treated with different concentration of rotenone. Data show the mean ± SE (n = 3) and are expressed as a percentage ratio of the treated cells to the untreated ones. D. Quantification of mitochondrial content. Immunoblot illustration and relative quantification of mitochondria-specific protein COX IV level in HAP1-ΔVDAC3 upon transfection. Data are normalized to the β-Actin, expressed as means ± SEM (n = 3) and compared to HAP1-ΔVDAC3 transfected with empty vector. E. Quantification of mtDNA in HAP1-ΔVDAC3 upon transfection. mtDNA amount was measured by Real-Time PCR of the mitochondrial gene COXII and normalized to the nuclear gene APP. Data are expressed as means ± SEM (n = 3) and compared to HAP1-ΔVDAC3 transfected with empty vector. F. Quantification of the main antioxidant enzymes in HAP1-ΔVDAC3 upon transfection. Representative immunoblot and relative protein quantification of Catalase, superoxide dismutase 1 (SOD1) and thioredoxin (TRX). Data are normalized to the β-Actin, expressed as means ± SEM (n = 3) and compared to HAP1-ΔVDAC3 transfected with the empty vector. Data were analyzed with One-Way or Two-Way ANOVA; *p < 0.05 **p < 0.01 and ***p < 0.001.
Fig. 5
Fig. 5
Oxygen consumption analysis upon rotenone and myxothiazol exposure. A. Representative curve displaying the respirometry profile of untreated HAP1 parental cells and the SUIT protocol applied. The respiratory states Routine, N-pathway and ET capacity were achieved in intact or permeabilized cells with the specific addition of substrates and inhibitors, as following: PMG, pyruvate, malate and glutamate; Dig, digitonin; CCCP, carbonyl cyanide 3-chlorophenylhydrazone; AZ, sodium azide. B. Cell viability of HAP1-ΔVDAC3 upon transfection with an empty vector (pCMS) or plasmid encoding either for the VDAC3 (+VDAC3) or the VDAC3 C0A (+VDAC3 C0A) and treated with 10 nM rotenone. Data show the mean ± SE (n = 3) and are expressed as a percentage ratio of the treated cells to the untreated ones. C. Quantitative analysis of the oxygen consumption in the analyzed states of HAP1-ΔVDAC3 transfected with empty vector (pCMS) or construct carrying VDAC3 (+VDAC3) or VDAC3 C0A mutant (+VDAC3 C0A) attained after the exposure to 10 nM rotenone. Data are indicated as the mean ± SE (n = 3) and expressed as the ratio of the treated cells to the untreated ones. D. Cell viability of HAP1-ΔVDAC3 upon transfection with an empty vector (pCMS) or plasmid encoding either for the VDAC3 (+VDAC3) or the VDAC3 C0A (+VDAC3 C0A) and treated with 10 nM myxothiazol. Data show the mean ± SE (n = 3) and are expressed as a percentage ratio of the treated cells to the untreated ones. E. Quantitative analysis of the oxygen consumption in the analyzed states of HAP1-ΔVDAC3 transfected with empty vector (pCMS) or construct carrying VDAC3 (+VDAC3) or VDAC3 C0A mutant (+VDAC3 C0A) attained after the exposure to 10 nM myxothiazol. Data are indicated as the mean ± SE (n = 3) and expressed as the ratio of the treated cells to the untreated ones. Data were analyzed by one-way ANOVA, with *p < 0.05, **p < 0.01 and ***p < 0.001.
Fig. S1
Fig. S1
Phenotypic characterization of HAP1 cell lines. A. Bright field images of HAP1 Parental, ΔVDAC1 and ΔVDAC3 cell lines seeding 48 before the pictures were taken. B. Proliferation of HAP1 cells measured over the time (5 days, each 24h) by flow cytometry true volumetric counting. C. Formazan absorbance expressed as a measure of cell viability of the three cell lines in basal conditions. Data are expressed as mean ± SE (n = 3) and analyzed by one-way ANOVA.
Fig. S2
Fig. S2
Mitochondrial morphology of parental and ΔVDAC3 HAP1 cell lines and flow cytometric determination of transfection efficiency. A. Fluorescence microscopy imaging of parental and ΔVDAC3 HAP1 mitochondria stained with the mitochondrial marker Mito Tracker Red DsRed. B. Representative fluorescence profiles evaluated by flow cytometry in HAP1- ΔVDAC3 upon cell transfection (left panel). Transfection yield of HAP1-ΔVDAC3 cells estimated by flow cytometry as the percentage of cells in FL3, based on the fluorescent emission of the transfection marker DsRed. Data are expressed as mean ± SE (n = 3).
Fig. S3
Fig. S3
Analysis of VDAC1 protein expression in HAP1-ΔVDAC3 upon cell transfection. Immunoblot and densitometry quantification of VDAC1 protein level in HAP1-ΔVDAC3 upon transfection with empty vector (pCMS) or plasmid carrying VDAC3 (+VDAC3) or VDAC3 C0A mutant (+VDAC3 C0A). Data are normalized to the β-Actin, expressed as means ± SD (n = 3) and compared to HAP1-ΔVDAC3 transfected with empty vector. Data were analyzed by one-way ANOVA.
Fig. S4
Fig. S4
Characterization of HAP1 parental cell line treated with rotenone and myxothiazol. A. Quantitative analysis of the oxygen consumption in the analyzed states of HAP1 parental cells before and after the exposure to different concentration of rotenone. Data are expressed as means ± SD (n = 3) and compared to untreated cells. B. Quantitative analysis of the oxygen consumption in the analyzed states of HAP1 parental cells before and after the exposure to different concentration of myxothiazol. Data are expressed as means ± SD (n = 3) and compared to untreated cells. C. Cell viability of HAP1 cell lines treated with 10 nM rotenone or 10 nM myxothiazol. Data are indicated as the mean ± SE (n = 3) and compared to untreated cells. D. Measurement of mitochondrial superoxide production via staining with MitoSOX Red after treatments with 10 nM rotenone or 10 nM myxothiazol. Data were expressed as mean ± SD (n = 3) and compared to untreated cells. Data were analyzed by one-way ANOVA, with *p < 0.05, **p < 0.01 and ***p < 0.001.
Fig. S5
Fig. S5
Impact of cell transfection on the respirometry profile of HAP1-ΔVDAC3 cells. Quantitative analysis of the oxygen consumption performed by HRR in the respiratory states Routine, N-pathway and ET capacity upon cell transfection with empty vector (pCMS) or construct carrying VDAC3 (+VDAC3) or VDAC3 C0A mutant (+VDAC3 C0A). Data are expressed as means ± SD (n = 4) and analyzed by one-way ANOVA.

References

    1. Turrens J.F. Mitochondrial formation of reactive oxygen species. J. Physiol. 2003;552:335–344. doi: 10.1113/jphysiol.2003.049478. - DOI - PMC - PubMed
    1. Balaban R.S., Nemoto S., Finkel T. Mitochondria, oxidants, and aging. Cell. 2005;120:483–495. doi: 10.1016/j.cell.2005.02.001. - DOI - PubMed
    1. Adam-Vizi V., Chinopoulos C. Bioenergetics and the formation of mitochondrial reactive oxygen species. Trends Pharmacol. Sci. 2006;27:639–645. doi: 10.1016/j.tips.2006.10.005. - DOI - PubMed
    1. Murphy M.P. Mitochondrial thiols in antioxidant protection and redox signaling: distinct roles for glutathionylation and other thiol modifications. Antioxidants Redox Signal. 2012;16:476–495. doi: 10.1089/ars.2011.4289. - DOI - PubMed
    1. Hanschmann E.-M., Godoy J.R., Berndt C., Hudemann C., Lillig C.H. Thioredoxins, glutaredoxins, and peroxiredoxins--molecular mechanisms and health significance: from cofactors to antioxidants to redox signaling. Antioxidants Redox Signal. 2013;19:1539–1605. doi: 10.1089/ars.2012.4599. - DOI - PMC - PubMed

Publication types

MeSH terms