. 2022 May:51:102262.
doi: 10.1016/j.redox.2022.102262. Epub 2022 Feb 9.

ACSL4 deficiency confers protection against ferroptosis-mediated acute kidney injury

Affiliations

ACSL4 deficiency confers protection against ferroptosis-mediated acute kidney injury

Yue Wang et al. Redox Biol. 2022 May.

Abstract

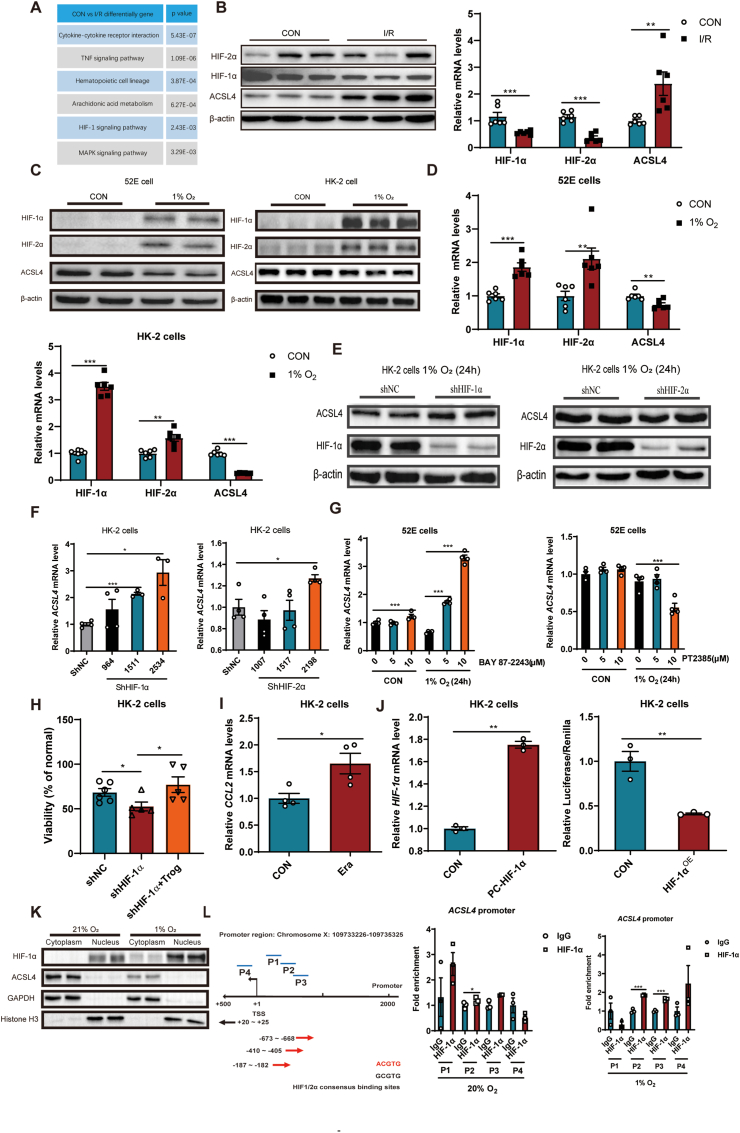
The term ferroptosis coined in 2012 causes acute kidney injury (AKI). However, its pathway mechanism in AKI is poorly understood. In this study, we conducted an RNA-sequence analysis of kidneys in AKI and normal mice to explore the pathway mechanism of ferroptosis. Consequently, differentially expressed genes highlighted Acyl-CoA synthetase long-chain family (ACSL4), a known promotor for ferroptosis. Besides, RT-PCR, Western blot, and immunohistochemical analyses confirmed its upregulation. HIF-1α was downregulated in I/R-AKI mice, and in vitro studies confirmed a negative regulation of HIF-1α on ACSL4. To explore the role of ACSL4 in AKI, we constructed ACSL4 knockout in kidney tubules of mice-as Cdh16Cre-ACSL4F/F mice. Results revealed that ACSL4 knockout significantly reduced ferroptosis and inhibited the functional and pathological injury of AKI mice. Meanwhile, the kidneys of Cdh16Cre-ACSL4F/F mice demonstrated a significantly decreased inflammation and macrophage infiltration. Further, additional explorations were explored to decipher a more thorough understanding of ferroptotic immunogenicity. As a result, neutrophils were not directly recruited by ferroptotic cells, but by ferroptotic cell-induced macrophages. Further, ACSL4 inhibitor rosiglitazone significantly inhibited AKI. Collectively, these data provide novel insights into the AKI pathogenesis, and defined ACSL4 as an effective target in AKI.

Keywords: ACSL4; Acute kidney injury; Ferroptosis; HIF-1α; Macrophages.


Conflict of interest statement

The authors declare no competing financial interests.

Figures

Image 1
Graphical abstract
Fig. 1
Fig. 1
Up-regulation of ACSL4 in AKI. (A) The RNA-seq volcano graphs of the CON and I/R-induced AKI groups. N=3. (B) ACSL4 protein expression in AKI detected by WB. N=4. (C) The expression levels of ACSL4 mRNA after AKI detection by RT-PCR, N=6. (D–E) Representative images showing ACSL4 expression detected by immunohistochemistry. Black arrows indicate ACSL4 expression. The scale bar represents 50 μm. (F–G) Correlation analysis of ACSL4 mRNA levels and kidney function indicator BUN or blood CRE levels in mice. The Pearson correlation statistic test was used for data analysis. N=10. **p < 0.01, ***p < 0.001, compared to the CON group.
Fig. 2
Fig. 2
HIF-1α binds to the ACSL4 promoter and negatively regulates ACSL4. All the cells in the hypoxia environment were cultured for 24 h. (A) A table summarizing the results of the RNA-seq data in CON and I/R groups obtained via gene ontology. N=3. (B) WB and RT-PCR results of HIF-1α, HIF-2α, ACSL4 in I/R-induced AKI kidney tissues. N=6. (C)Protein expression levels of HIF-1α, HIF-2α, ACSL4 determined in 52E and HK-2 cells after culturing cells in 1% O2 hypoxia for 24 h. N=3. (D) RT-PCR results of HIF-1α, HIF-2α, and ACSL4 in 52E and HK-2 cells. N=3. (E) The HIF-1α and HIF-2α knockdown of HK-2 cells cultured under 1% O2 hypoxia for 24 h and WB results showing the expression of HIF-1α, HIF-2α, and ACSL4. N=3. (F, G) RT-PCR results showing the expression of ACSL4 after knockdown of HIF-1α, HIF-2α or after treatment with HIF-1α inhibitor BAY 87–2243 (10 μM) or HIF-2α inhibitor PT2385 (10 μM) for 24 h. N=3. (H) The cell viability detected by SRB after the knockdown of HIF-1α treated with Erastin (1 μM). Troglitazone (1 μM) was added at the same time as Erastin. N=5. (I) RT-PCR results showed the CCL2 mRNA levels in the treated cells. N=4. (J) RT-PCR results showing the efficiency of HIF-1α overexpression in plasmid transfected into HK-2 cells, and Luciferase results showing the interaction between HIF-1α and ACSL4. N=3. (K) WB results showing the distribution and expression of HIF-1α and ACSL4 in HK-2 cells at 21% O2 and 1% O2. N=3. (L) The database predicting the binding site of HIF-1α and ACSL4. The Chip immunoprecipitation experiments of HK-2 cells showed the binding sites at 20% O2 or 1% O2 (24 h). N=3. *p < 0.05, **p < 0.01, ***p < 0.001, compared to CON or shNC groups.
Fig. 3
Fig. 3
Knockout of renal ACSL4 has a protective effect on AKI. (A–B) The knockout efficiency of ACSL4 in normal mice kidney examined using RT-PCR and Western blot. N=6. (C) Representative ACSL4 and CK18 immunofluorescent staining pictures in the kidney tissues of Cdh16Cre/ACSL4F/F and ACSL4F/F normal mice. (D) Representative ACSL4 immunohistochemical staining in the kidney tissues of Cdh16Cre/ACSL4F/F and ACSL4F/F mice after AKI. (E) The expression levels of ferroptosis markers GPX4, Ptgs2, and ACSL4 in Cdh16Cre/ACSL4F/F and ACSL4F/F mice detected by RT-PCR. N=6. (F) The levels of MDA in kidney tissue of Cdh16Cre/ACSL4F/F and ACSL4F/F mice after AKI. N=5–6. (G) The blood CRE and BUN content of Cdh16Cre/ACSL4F/F and ACSL4F/F mice after AKI. N=6. (H) HE staining of Cdh16Cre/ACSL4F/F and ACSL4F/F mice after AKI. N=6. (I) TUNEL staining of Cdh16Cre/ACSL4F/F and ACSL4F/F mice after AKI. N=6. *p < 0.05, **p < 0.01, ***p < 0.001, compared to Sham group; #p < 0.05, ##p < 0.01, ###p < 0.001, compared to ACSL4F/F group.
Fig. 4
Fig. 4
Knockdown of renal ACSL4 inhibits the release of renal inflammatory factors. (A) The heatmap of RNA-seq in the kidney of three groups. N=3. (B) A heatmap showing the differentially expressed genes related to inflammatory responses in ACSL4F/F and Cdh16Cre/ACSL4F/F groups. N=3. (C) RT-PCR analysis of CCL2, IL-6, and IL-1β mRNA in kidney tissues of three groups. N=6. (D) The proportion of macrophages in the kidney tissue of mice detected by flow cytometry. N=6. (E) The blood mononuclear detected through blood routine detection. N=6. (F) Staining of macrophages in kidney tissue. The scale bars represent 100 μm and 50 μm. N=6. (G) Flow cytometry analysis of macrophages phagocytosis of control or ferroptotic cells. Ferroptosis was induced by Erastin. N=6. (H) The mRNA expression of IL-6, iNOS, TNF-α, TGF-β, Arg-1, CXCL1, and CXCL2 in macrophages after co-incubation with ferroptotic cells. N=4. *p < 0.05, **p < 0.01, ***p < 0.001, compared to the Sham group; #p < 0.05, ##p < 0.01, ###p < 0.001, compared with the ACSL4F/F group.
Fig. 5
Fig. 5
Macrophages recruit neutrophils by secreting neutrophil chemokines. (A) RT-PCR analysis of CXCL1 and CXCL2 in kidney tissue of three groups. N=4. (B) Flow cytometry statistics of CD11b+Ly6G+ neutrophils in the kidney of three groups. N=6. (C–D) Blood routine test and immunohistochemical staining showing neutrophil expressions in the kidney of mice. The MPO antibody was stained in the kidney to indicate the neutrophil. The scale bars represent 50 μm. N=6. (E) The migrated neutrophils with crystal violet staining induced by ferroptotic 52E cells. N=3. (F) The expression of CXCL1 and CXCL2 mRNA levels in ferroptotic 52E cells. N=4. (G) The migrated neutrophils with crystal violet staining induced by macrophages and control or ferroptotic 52E cells. N=3. (H) RT-PCR results of CXCL1and CXCL2 in the mice kidneys. N=6. (I) Flow cytometry and analysis of CD11b+Ly6G+ neutrophil cells in the mice kidneys. N=6. *p < 0.05, ***p < 0.001, compared to sham or CON group; #p < 0.05, ###p < 0.001, compared with ACSL4F/F or FA groups. (For interpretation of the references to colour in this figure legend, the reader is referred to the Web version of this article.)
Fig. 6
Fig. 6
ACSL4 inhibitor rosiglitazone (Rosi) protects the renal function of AKI by inhibiting ferroptosis and inflammation. (A–B) BUN and blood CRE levels and kidney coefficient in mice. (C) Representative HE staining and pathological scores of the kidneys. The scale bars represent 50 μm and 100 μm. (D) RT-PCR results of ACSL4, CCL2, CXCL1, and CXCL2 in mice kidneys. (E) Representative F4/80 staining images and mean F4/80 positive cells in the kidney. The scale bar represents 50 μm. (F) The ratio of CD11b+F4/80+ macrophage cells in the kidney tissue of I/R-induced AKI detected by flow cytometry. **p < 0.01, ***p < 0.001, compared to Sham group; #p < 0.05, ##p < 0.01, ###p < 0.001, compared to I/R group. N=6.

References

    1. Lameire N.H., Bagga A., Cruz D., et al. Acute kidney injury: an increasing global concern. Lancet. 2013;382:170–179. - PubMed
    1. Lewington A.J., Cerda J., Mehta R.L. Raising awareness of acute kidney injury: a global perspective of a silent killer. Kidney Int. 2013;84:457–467. - PMC - PubMed
    1. Levey A.S., James M.T. Acute kidney injury. Ann. Intern. Med. 2017;167:ITC66–ITC80. - PubMed
    1. Siew E.D., Parr S.K., Abdel-Kader K., et al. Predictors of recurrent AKI. J. Am. Soc. Nephrol. 2016;27:1190–1200. - PMC - PubMed
    1. Pannu N., Nadim M.K. An overview of drug-induced acute kidney injury. Crit. Care Med. 2008;36:S216–S223. - PubMed