. 2022 Apr 1;82(7):1174-1192.
doi: 10.1158/0008-5472.CAN-21-2807.

Patient-Derived Triple-Negative Breast Cancer Organoids Provide Robust Model Systems That Recapitulate Tumor Intrinsic Characteristics

Affiliations

Patient-Derived Triple-Negative Breast Cancer Organoids Provide Robust Model Systems That Recapitulate Tumor Intrinsic Characteristics

Sonam Bhatia et al. Cancer Res. .

Abstract

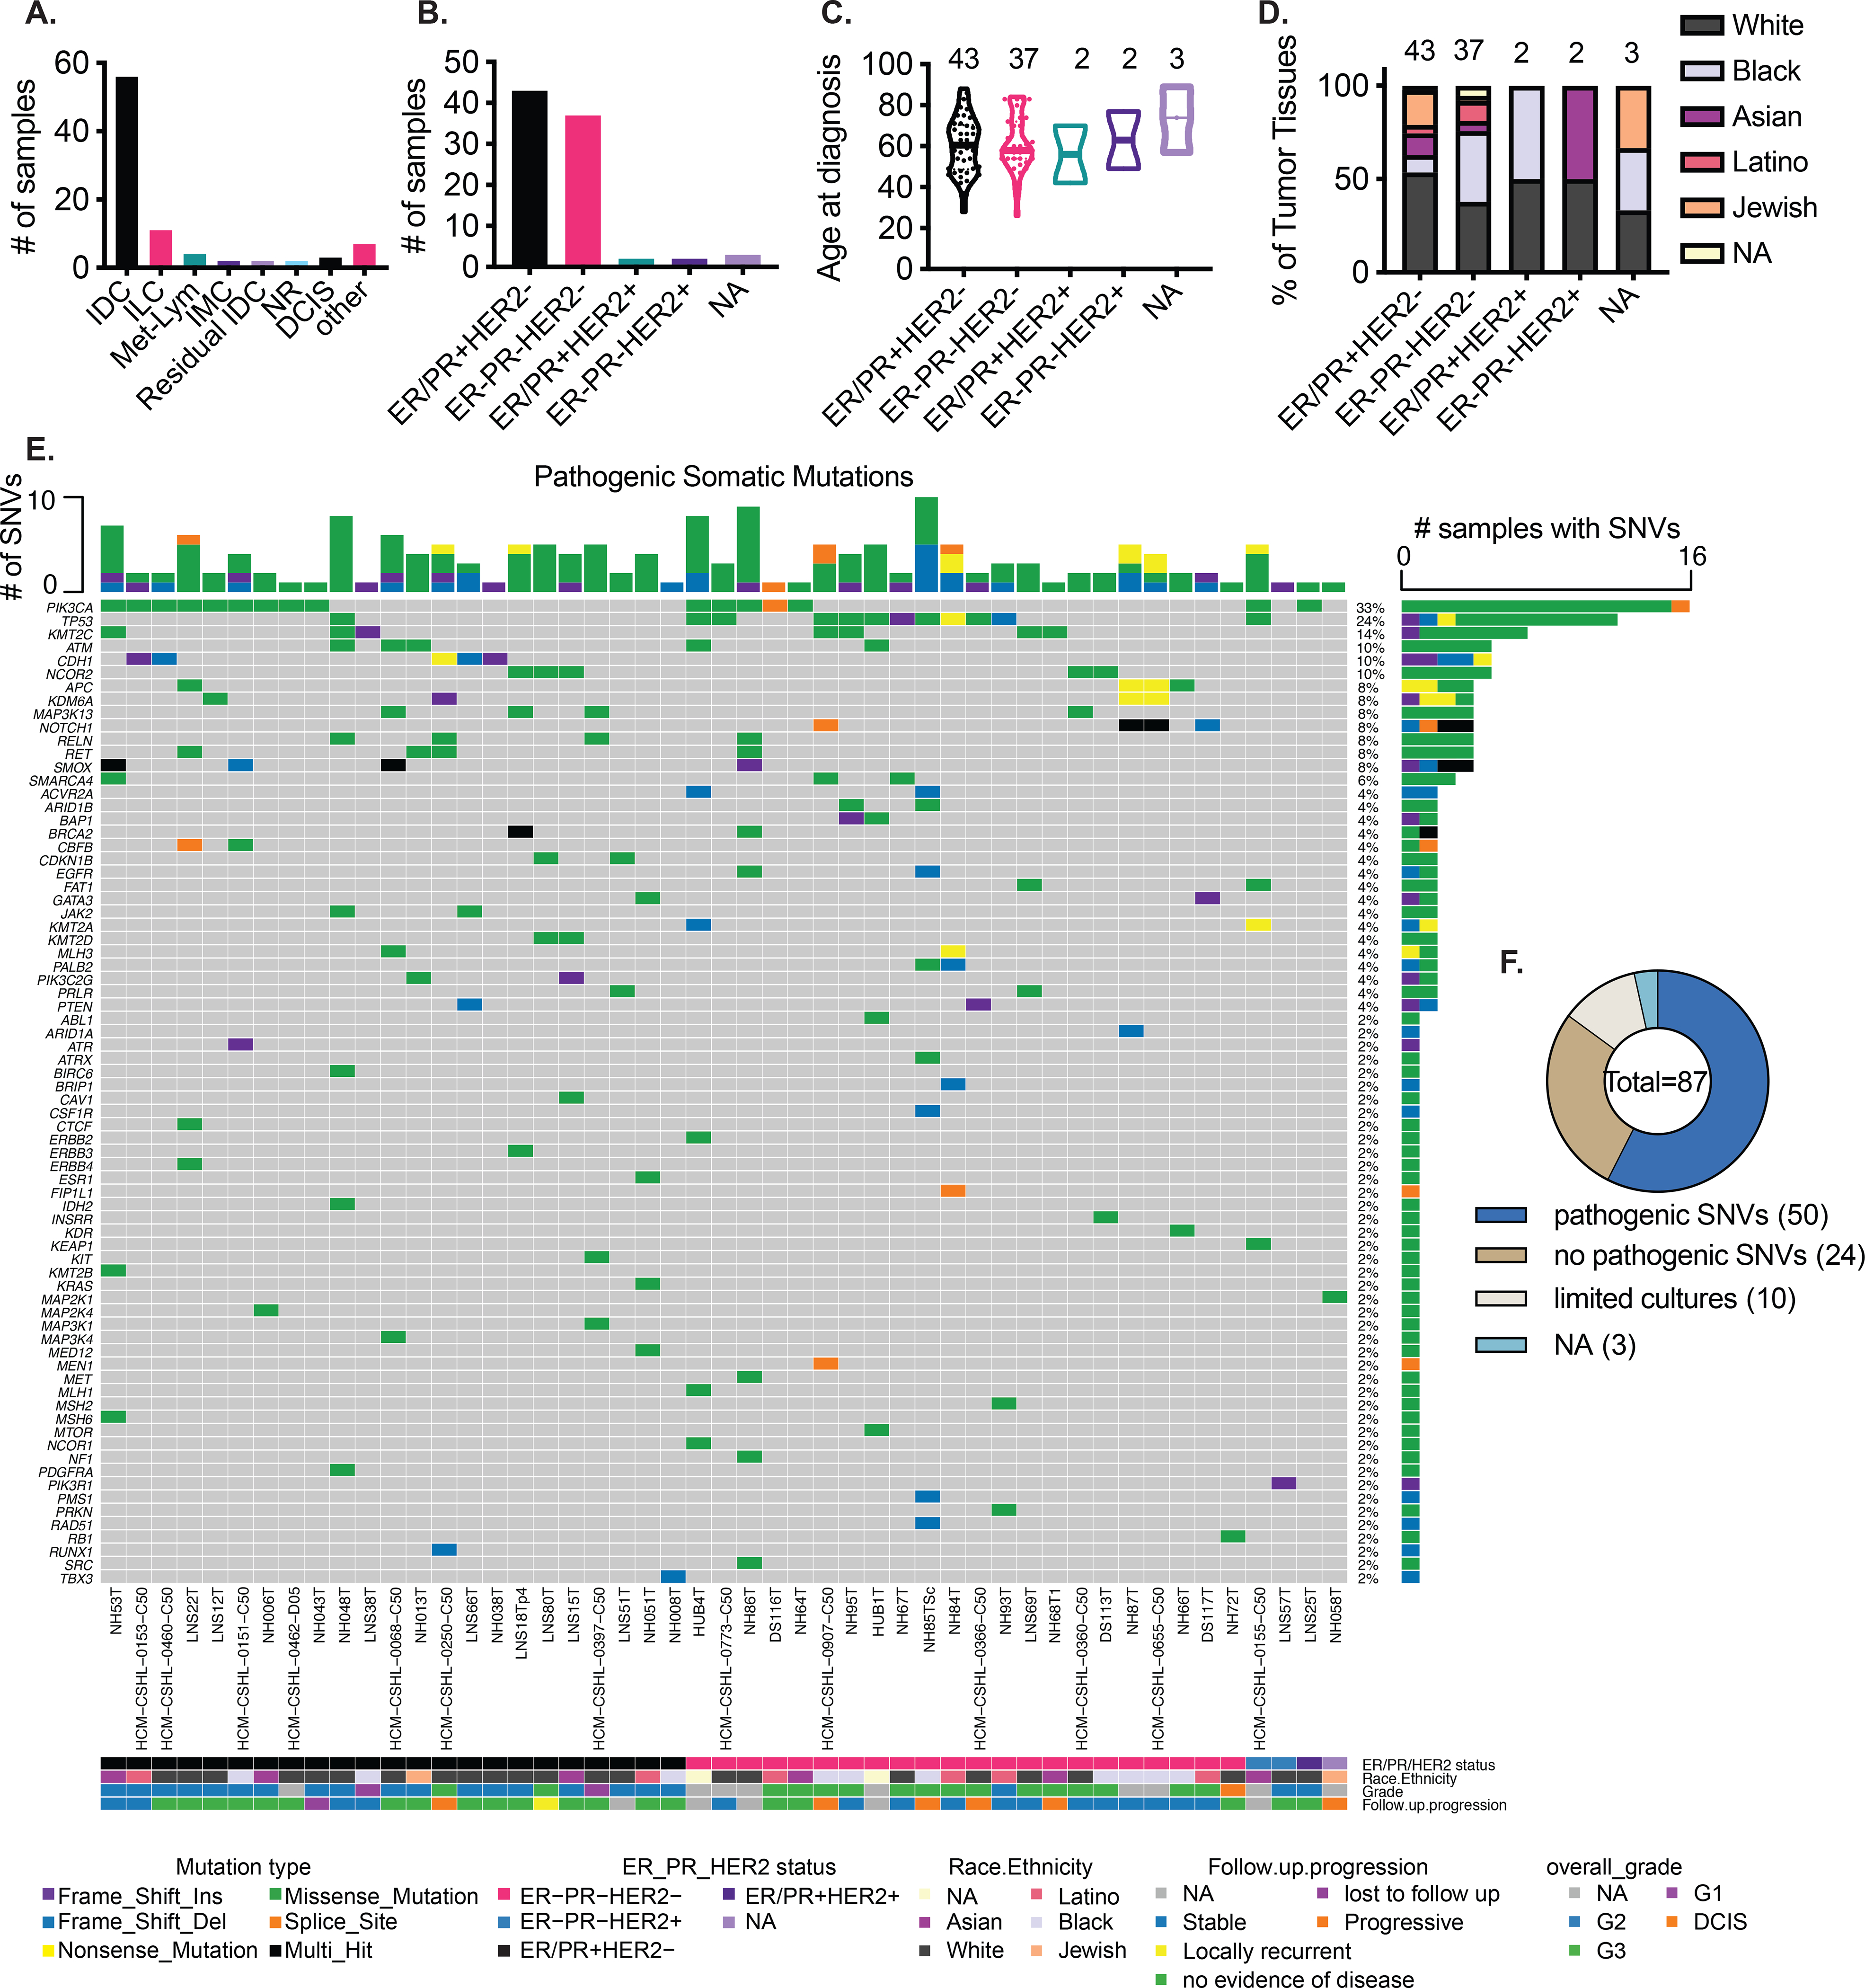
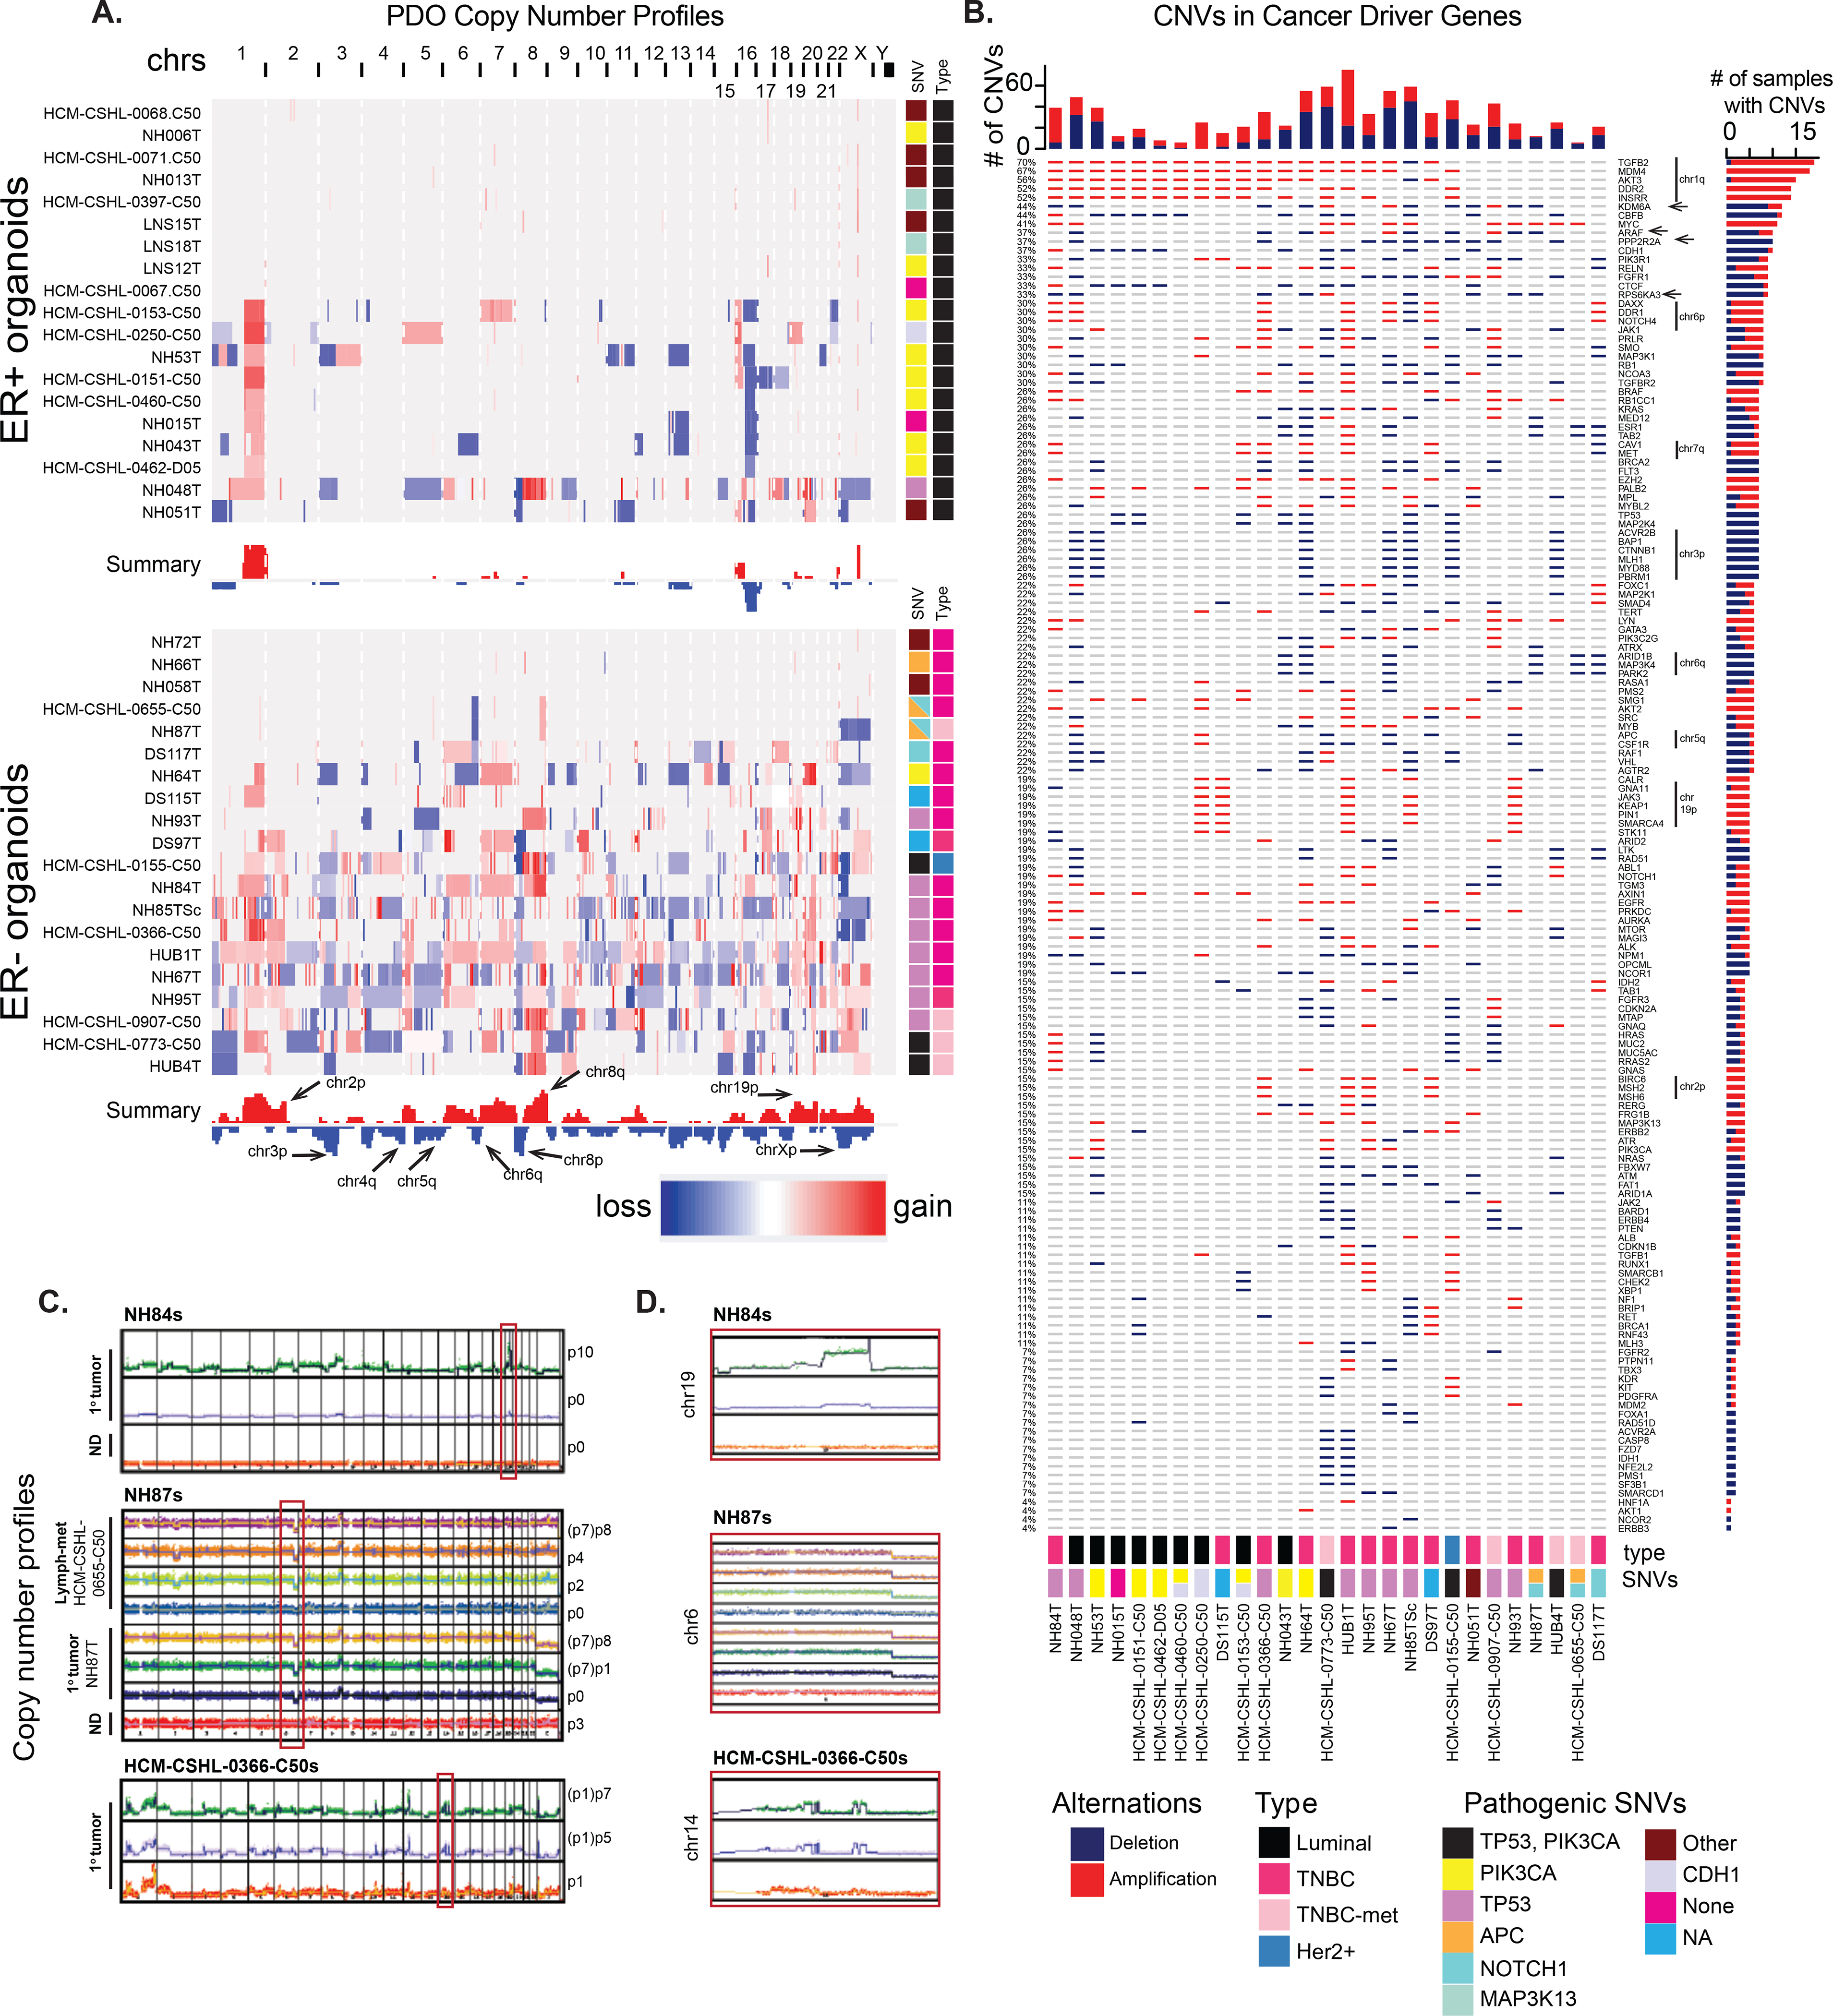
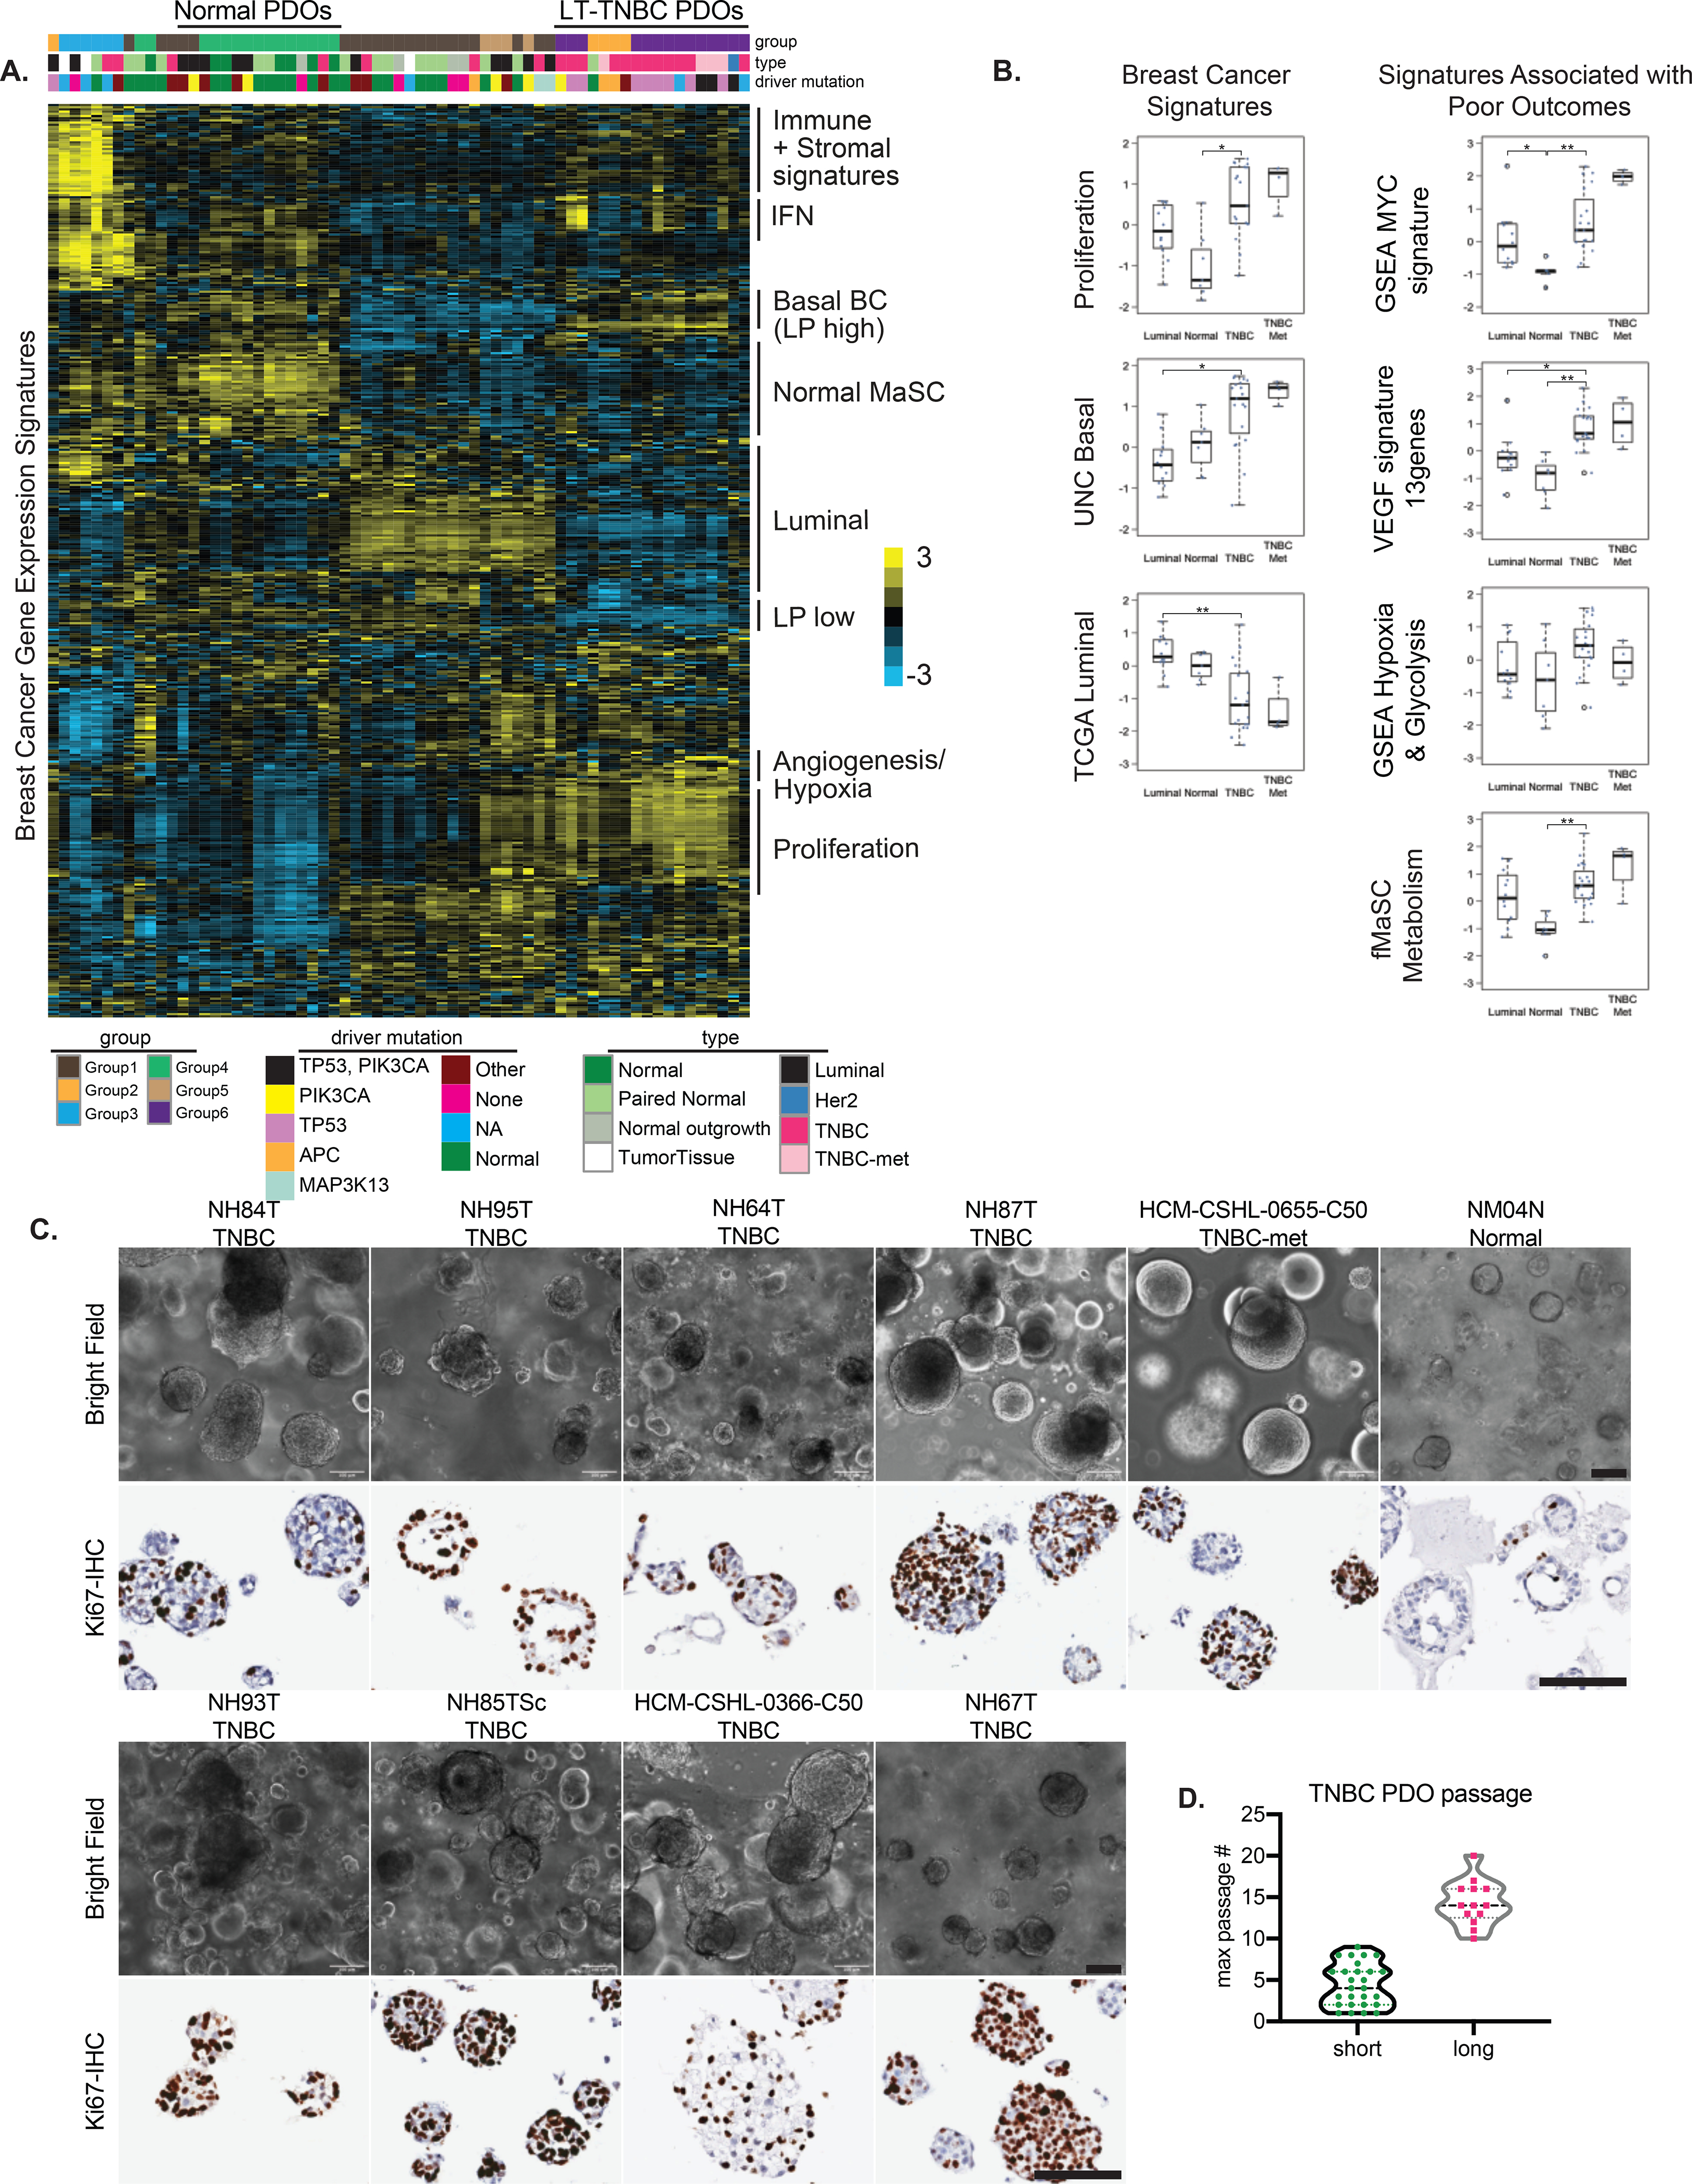
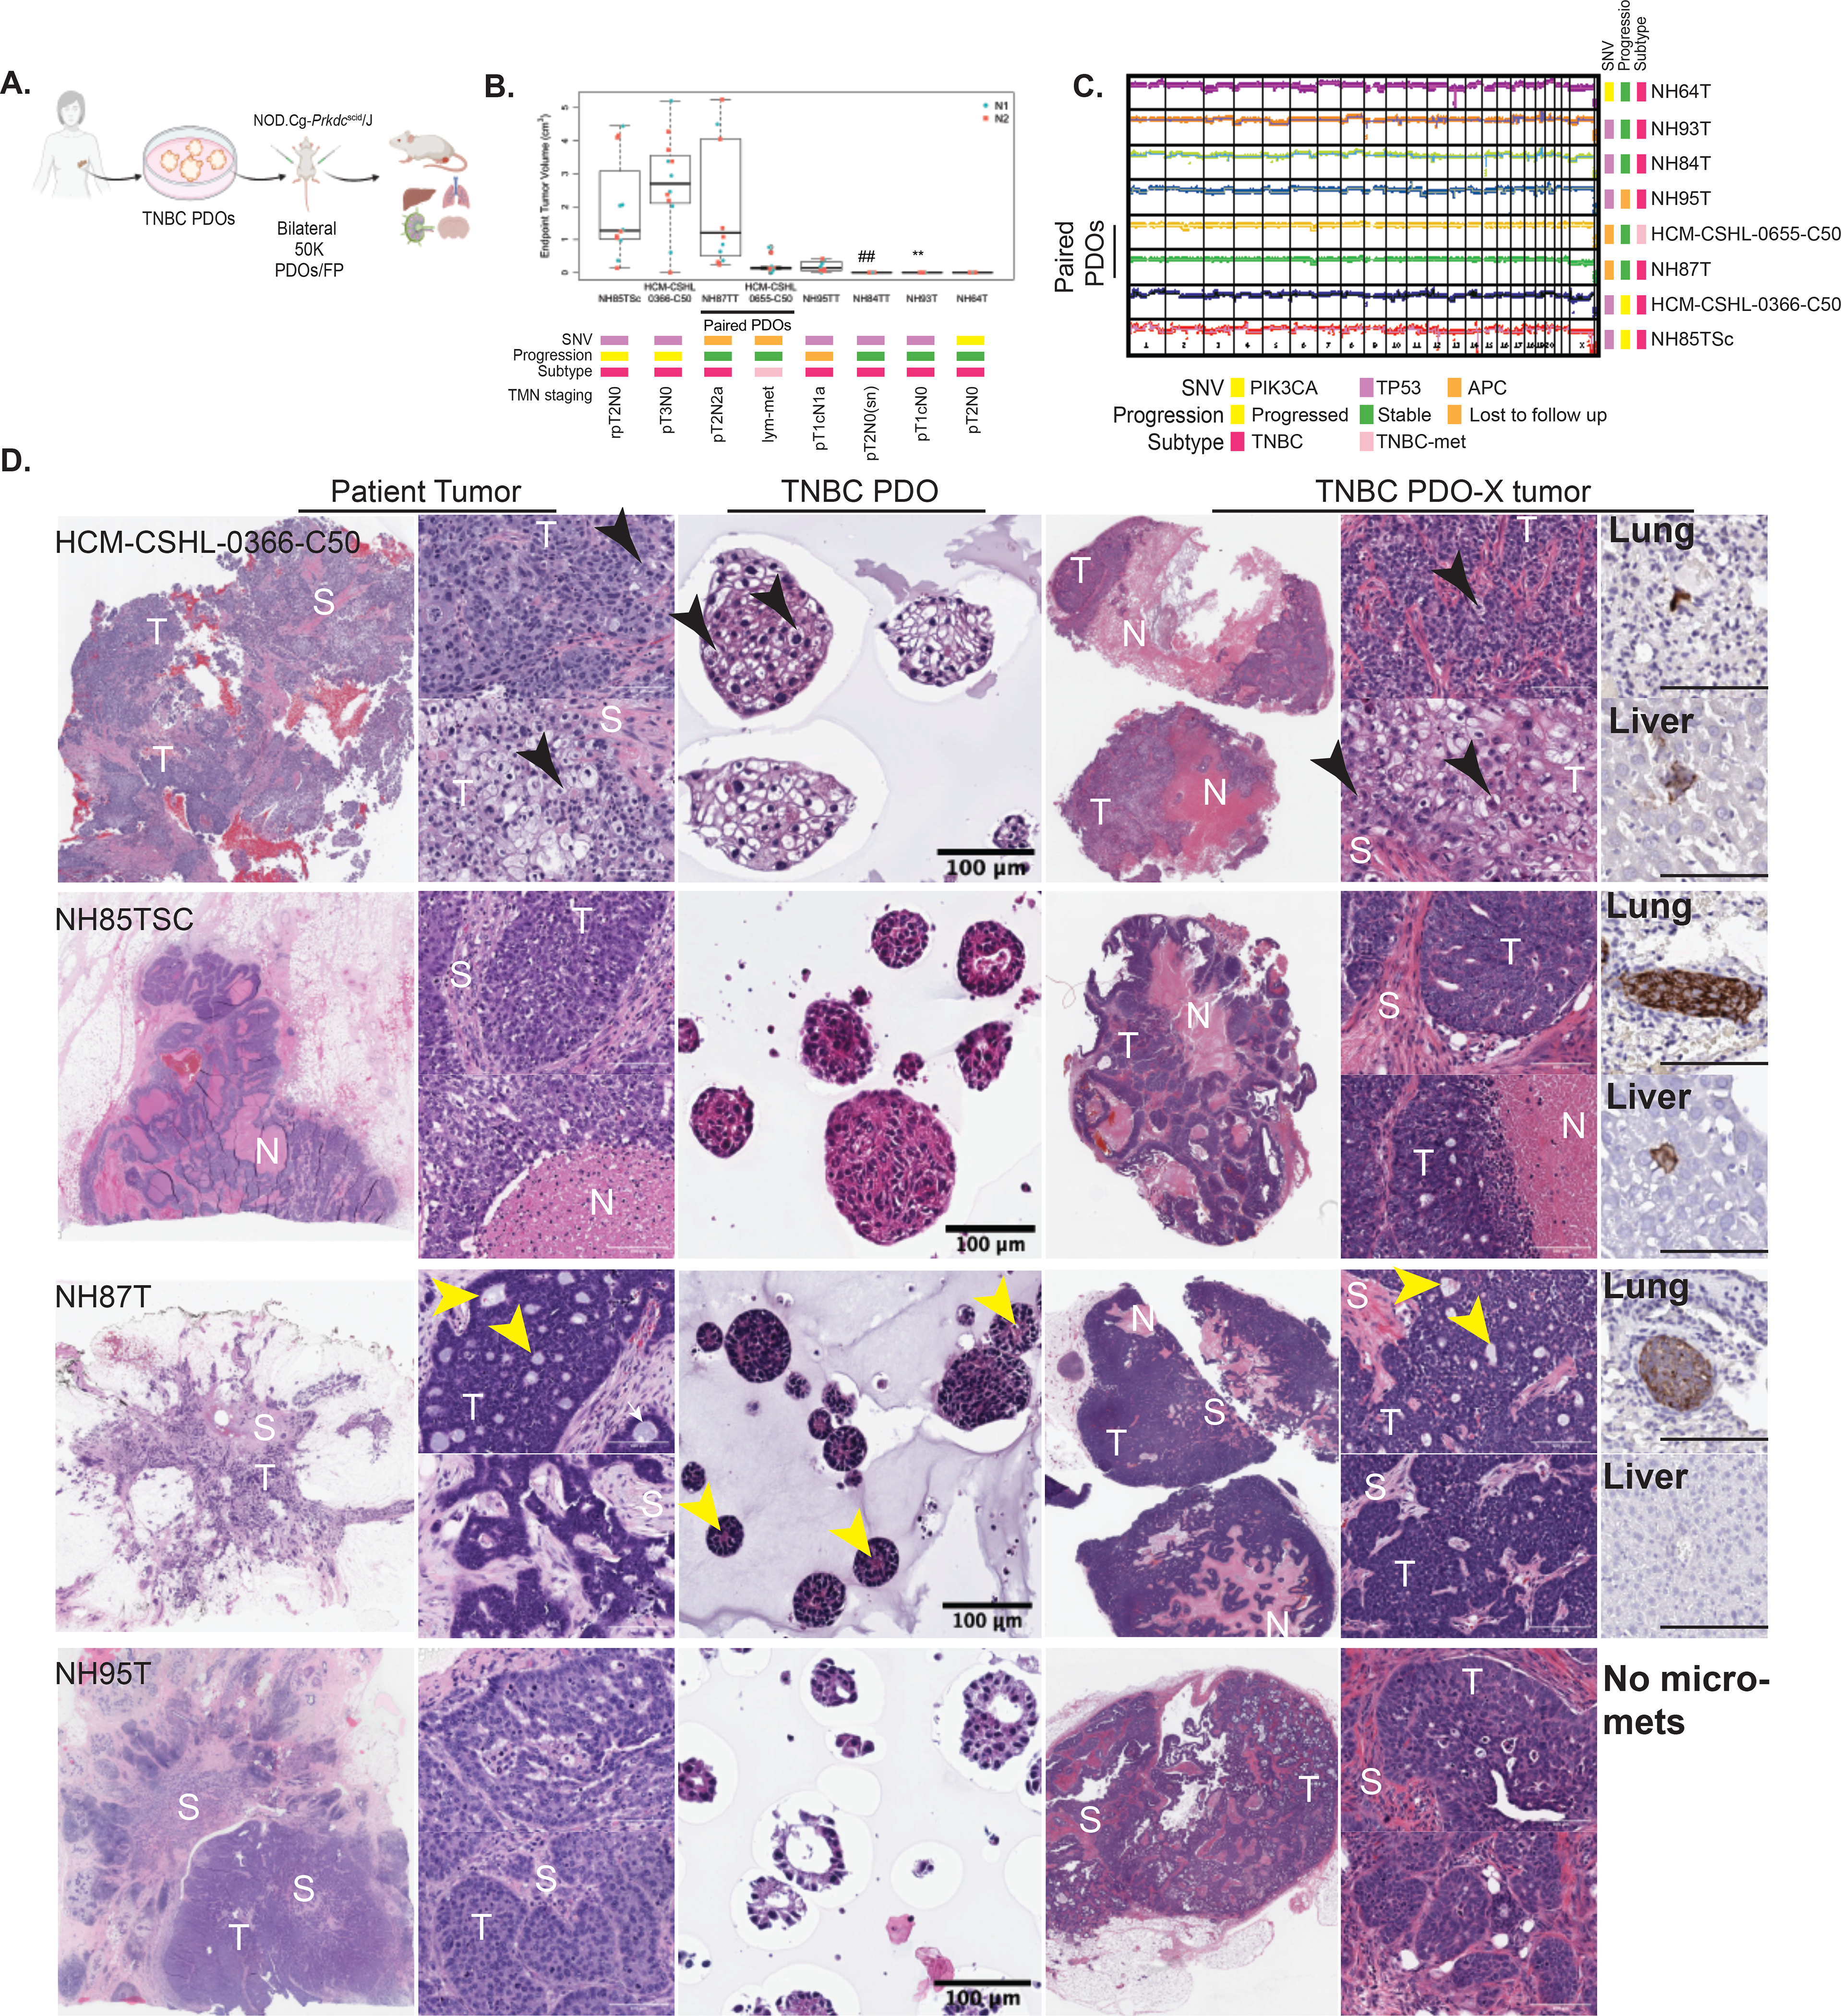
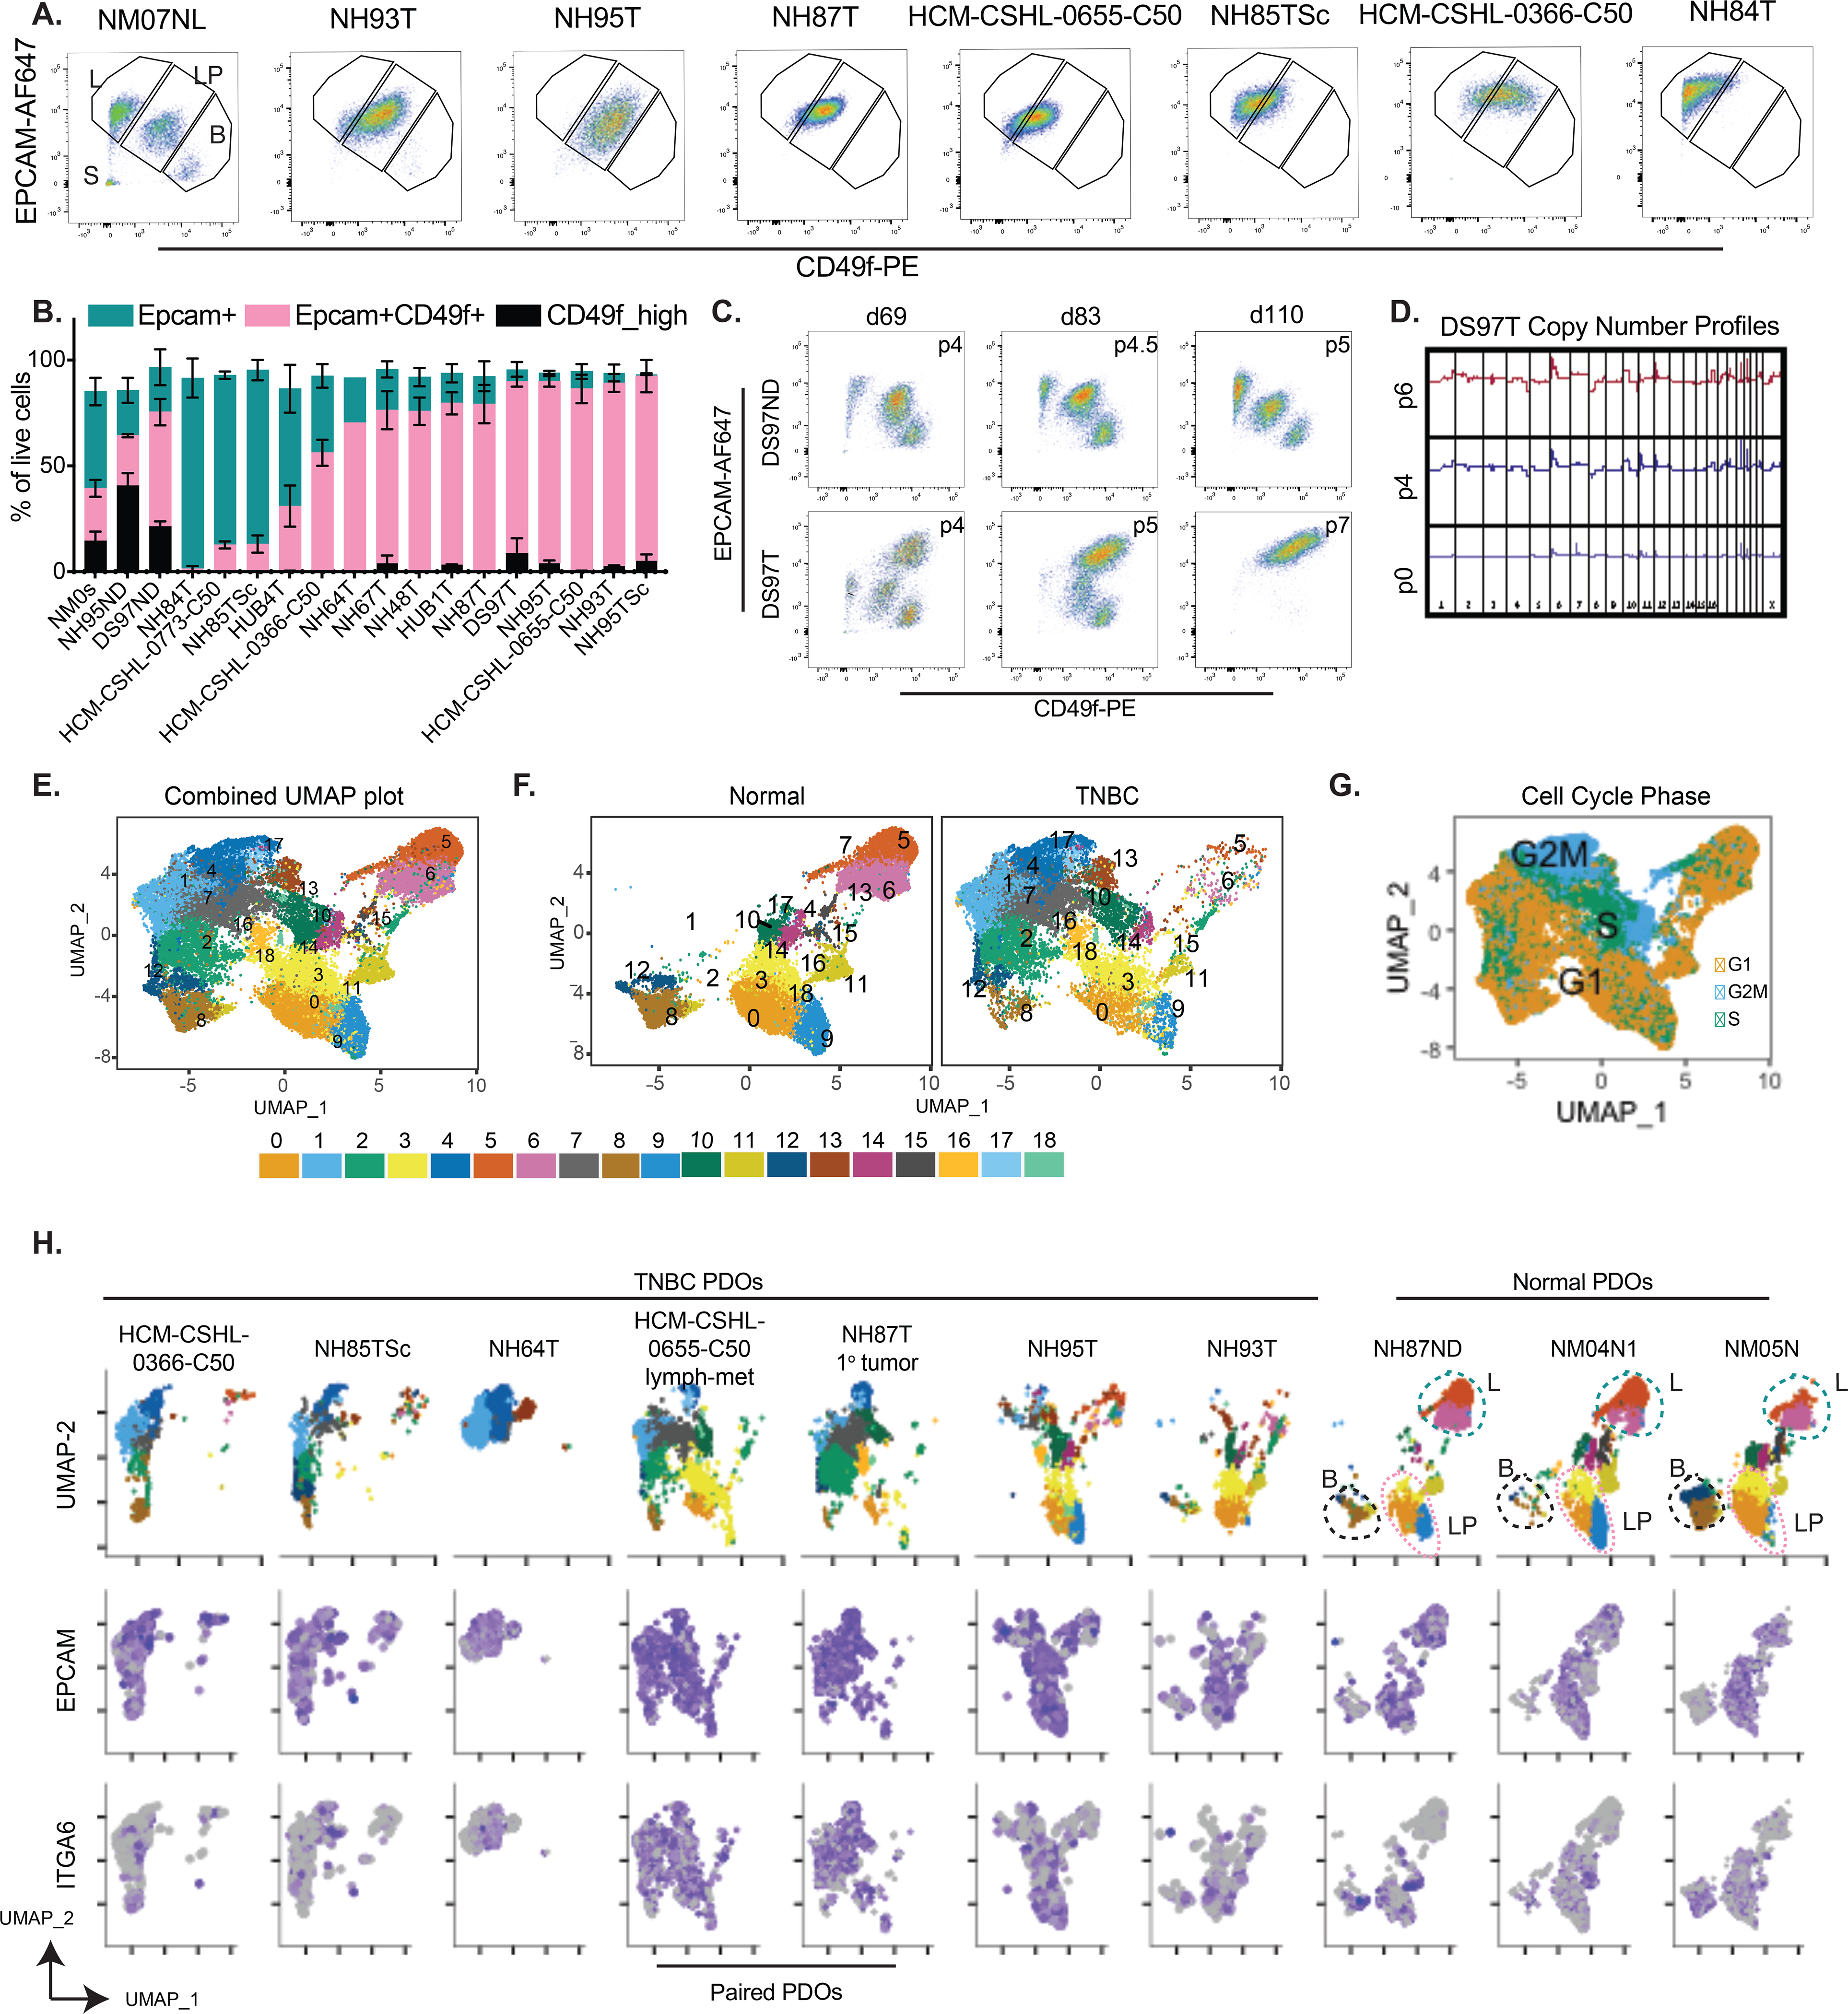
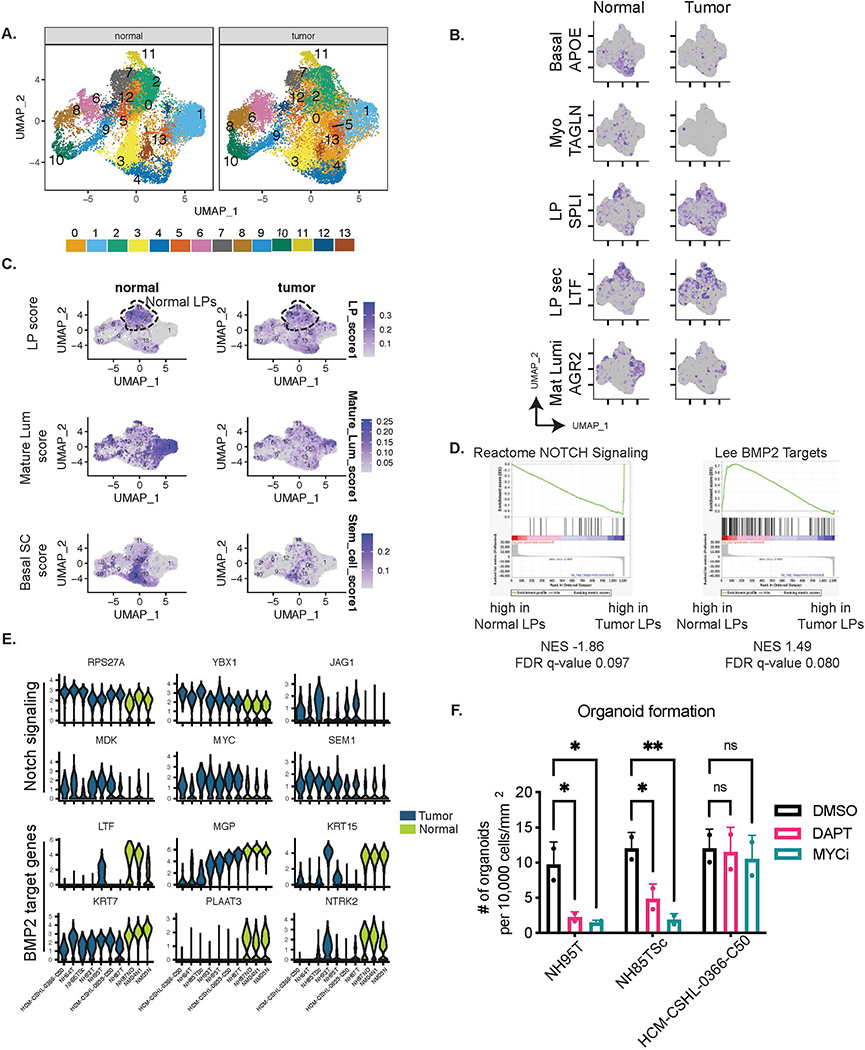
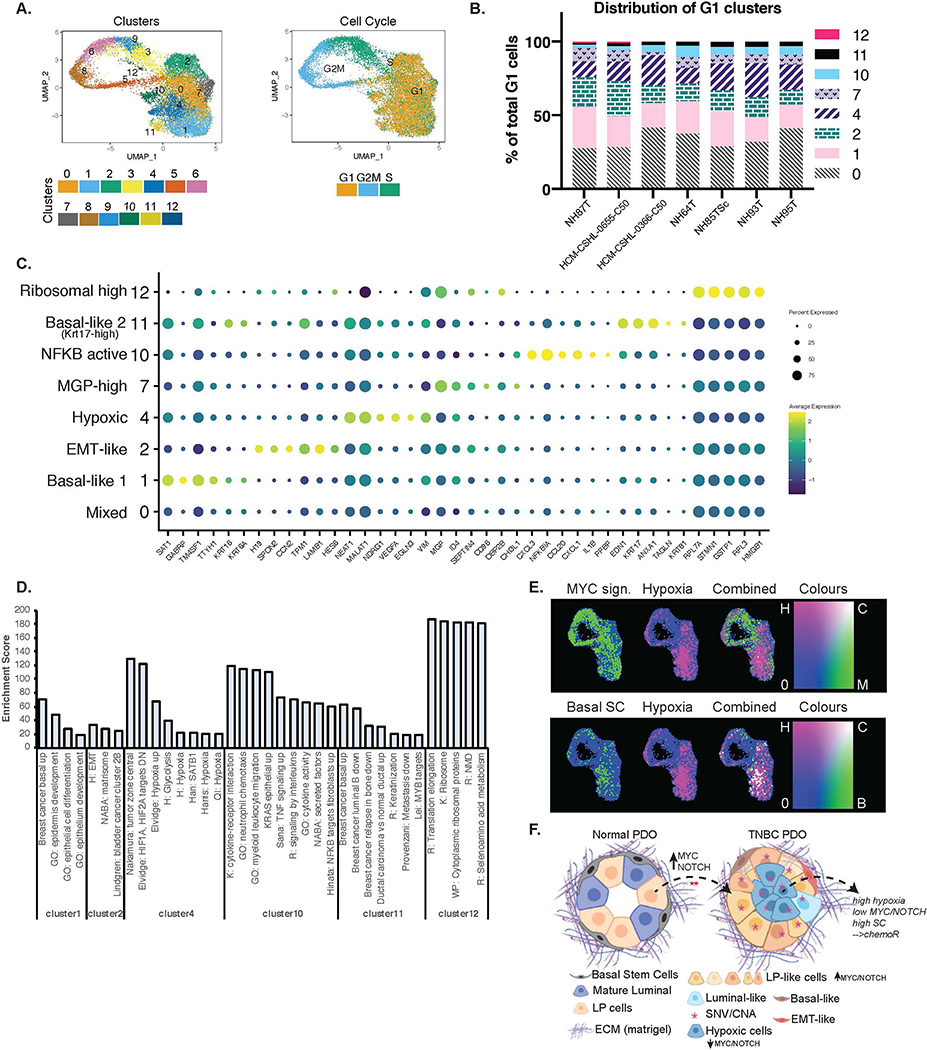
Triple-negative breast cancer (TNBC) is an aggressive form of breast cancer with poor patient outcomes, highlighting the unmet clinical need for targeted therapies and better model systems. Here, we developed and comprehensively characterized a diverse biobank of normal and breast cancer patient-derived organoids (PDO) with a focus on TNBCs. PDOs recapitulated patient tumor intrinsic properties and a subset of PDOs can be propagated for long-term culture (LT-TNBC). Single cell profiling of PDOs identified cell types and gene candidates affiliated with different aspects of cancer progression. The LT-TNBC organoids exhibit signatures of aggressive MYC-driven, basal-like breast cancers and are largely comprised of luminal progenitor (LP)-like cells. The TNBC LP-like cells are distinct from normal LPs and exhibit hyperactivation of NOTCH and MYC signaling. Overall, this study validates TNBC PDOs as robust models for understanding breast cancer biology and progression, paving the way for personalized medicine and tailored treatment options.

Significance: A comprehensive analysis of patient-derived organoids of TNBC provides insights into cellular heterogeneity and mechanisms of tumorigenesis at the single-cell level.


Conflict of interest statement

Conflict of Interest

C.M.P is an equity stock holder and consultant of BioClassifier LLC; C.M.P is also listed as an inventor on patent applications for the Breast PAM50 Subtyping assay.

Figures

Figure 1.
Figure 1.. Establishment and somatic variant profiling of the breast cancer organoid biobank.
A.) Summary of cancer type of the various tumor tissues that were used to generate organoids. IDC: Invasive ductal carcinoma, ILC: Invasive lobular carcinoma, Met-Lym: lymph node metastasis, IMC: Invasive mucinous carcinoma, NR: no residual tumor seen, DCIS: Ductal carcinoma in-situ, other: see Table S1 B.) Histopathological subtypes of the tumor tissues, ER/PR: Estrogen receptor (ER) and/or Progesterone receptor (PR), NA: not assessed C.) Age at diagnosis of the various subgroups of patient tumor tissues D.) Subtype specific, self-identified racial and ethnic breakdown of the patients represented in this biobank E.) Pathogenic single nucleotide variants (SNVs) identified in putative cancer driver genes in patient-derived organoids. F.) Proportion of organoids with pathogenic SNVs identified. Pathogenic SNVs: SNVs called pathogenic by ClinVar, COSMIC or REVEL and MCAP scores from targeted gene-panel sequence (49 samples) or whole exome sequencing (1 sample) (see Table S1), limited cultures: cultures where organoids were established at early passages (p0-p1) but could not be propagated, NA: not assessed
Figure 2.
Figure 2.. Copy number alterations (CNAs) enriched in the organoid models.
A.) Copy number profiles, from IGV, of the various ER+ and ER− tumor derived organoids, along with the summary of overall copy number alterations across all samples. Side panel shows the pathogenic SNVs identified in that sample from Fig 1E. B.) Copy number amplifications or deletions identified in putative cancer driver genes (from Fig 1E). C.) Copy number across different passages of three different sets of patient-derived organoids. D.) Magnified view of the chromosome regions in the red boxes in C.
Figure 3.
Figure 3.. A subset of TNBC organoids recapitulate signatures of aggressive basal-like breast cancers.
A.) Molecular signatures associated with the different organoid lines. The sample legends are type: Normal= reductive mammoplasty derived normal organoids, Paired Normal= Adjacent or Distal to the tumor paired normal, Normal outgrowth= no pathogenic mutations were found, Luminal= ER/PR+ organoids; driver mutation: Other= trace mutations (see Fig 1E), None= no pathogenic mutations were found, NA= not assessed B.) Box-plots showing the breast cancer related and TNBC-specific scores for various gene signatures associated with poor outcomes. Each dot represents a different PDO; Luminal N=12, Normal N= 7, TNBC N= 19, TNBC met= 4. Differences in experimental groups were compared using Kruskal-Wallis test followed by pairwise comparisons using Wilcoxon rank-sum test. Bonferroni-Holm method was used to adjust the family-wise error (** adjusted p-value < 0.005, * adjusted p-value < 0.05) C.) Light microscopy images of the various TNBC- and normal (NM04N) derived organoid lines, along with Ki67-IHC, scale bars=100μm D.) Distribution of maximum passage numbers tested for the various TNBC PDOs. Long-term cultures (long) are defined by p>10 with continued expansion
Figure 4.
Figure 4.. TNBC Organoids can recapitulate tumor morphology and progression in-vivo.
A.) Overview of PDO xenotransplant experiment using TNBC PDOs. B.) Box plots showing the end point tumor volume for the various organoid lines transplanted into the fat-pads of NOD-SCID mice. Each dot represents tumor volume from one injection, N1= experiment 1, N2= experiment 2. ## For NH84T microscopic primary tumors observed in histology sections from 1/10 sites. ** For NH93T microscopic primary tumors observed in histology sections from 6/10 sites. TMN staging: pathologic TMN staging from patient pathology report (Table S1) C.) CNV profiles of the PDOs lines selected for in vivo transplant experiments D.) H&E images of the paired patient tumor tissue, TNBC patient-derived organoids (PDO) and xenografts generated form patient-derived organoids (PDO-X). S= Stroma, T= tumor, N=necrosis. Black arrows point to the cells with spinous connections with adjacent tumor cells. Yellow arrows point to the pseudo-lumen observed within AdCC-like breast cancers. Last column shows human mitochondria IHC in the lung and the liver from a representative mouse injected with the respective PDO (scale bar=100μm).
Figure 5.
Figure 5.. TNBC organoids are enriched in luminal progenitor-like cells.
A.) Representative flow-cytometry plots for normal derived organoid (NM07NL) and various TNBC organoids stained for CD49f-PE on the x-axis and EPCAM-AF647 on the y-axis. The gates are subsets of live single cells within each organoid line and represent various cell types of the mammary epithelium. L=EPCAM-high mature luminal cells, LP= EPCAM+CD49f+ luminal progenitors, B= CD49f+ basal cells, S= stromal compartment. B.) Quantitation of the L, LP and B gates in panel B for multiple TNBC and normal organoid lines over multiple passages (see Table S7). Data-points are plotted as mean ±SEM using GraphPad Prism. NM0s: comprises multiple normal mammoplasty derived organoids from different patients C.) Flux of the epithelial cells during the early passages of organoid derivation for normal distal (DS97ND) and TNBC tumor (DS97T) samples from the same patient D.) Copy number plots of the TNBC organoids DS97T over multiple passages E.) UMAP plot of batch corrected scRNA-seq data from 3 normal and 7 TNBC organoids. Numbers on the plot represent cluster IDs. F. & G.) UMAP plot in A but F.) separated by the normal and tumor samples and G.) colored by cell cycle. H.) UMAP plot in E split by individual tumor and normal samples and showing normalized expression of EPCAM and ITGA6 (gene encoding CD49f) expression patterns in individual cells.
Figure 6.
Figure 6.. Tumor LP-like cells exhibit altered gene expression and have an upregulation of NOTCH and MYC downstream pathways.
A.) UMAP plots for Integrated scRNA-seq data for all samples. The numbers indicate cluster IDs. B.) Marker expression of various cell type specific genes in the adult human breast epithelium (49). C.) Plots showing combined scores for the three mammary epithelial lineages: LP score: Luminal Progenitor score, Mature Lum score: Mature luminal score, MaSC score: Mammary stem cell score (40). Dashed region indicates LP clusters 2,7 and 11 that were used to perform differential expression analysis between normal and tumor LPs. D.) GSEA plots showing enrichment of the differentially expressed genes between normal and tumor LPs. E.) Violin plots showing combined expression in clusters 2,7 and 11 of the leading-edge NOTCH signaling genes and BMP2 target genes as identified in E. F.) Organoid formation from single cells. Significance was assessed by two-way ANOVA ns= not significant, ** pvalue<0.005, * pvalue<0.05
Figure 7.
Figure 7.. TNBC Organoids are comprised of heterogenous cell populations.
A.) UMAP plot of TNBC only integrated scRNA-seq data showing clusters identified and cell cycle phases. B.) Distribution of cells in each of the G1 clusters identified per organoid line. C.) Dot-plot showing the marker genes for each of the G1 clusters and the associated phenotypic identity of that cell cluster. D.) Enrichment scores from GSEA of each of the G1 clusters that showed strong enrichment of some specific pathways or phenotypes. Enrichment score is represented by −10*NES*padj.value. E.) Combined gene set scores for the various phenotypes. Top panel: green= MYC signature, pink= Hypoxia signature. Bottom panel: green= Basal mammary stem cell (SC) signature, pink= Hypoxia signature. White represents positive correlation of the two signatures. F.) Schematic (created using BioRender.com) showing the cellular composition and heterogeneity observed in normal vs TNBC PDOs when cultured in matrigel. TNBC PDOs retain the tumor SNV/CNA profiles, are largely comprised of LP-like cells that might have originated from normal LP cells by the hyperactivation of NOTCH/MYC pathways. TNBC PDOs also have cells with signatures of hypoxia which is anti-correlated with NOTCH/MYC and positively associated with basal mammary stem cell signatures.

References

    1. Parker JS, Mullins M, Cheang MCU, Leung S, Voduc D, Vickery T, et al. Supervised risk predictor of breast cancer based on intrinsic subtypes. Journal of clinical oncology : official journal of the American Society of Clinical Oncology. 2009. Mar;27(8):1160–7. - PMC - PubMed
    1. Perou C, Sørlie T, Eisen M, Rijn MV, Jeffrey S, Rees C, et al. Molecular portraits of human breast tumours. Nature. 2000;406:747–52. - PubMed
    1. Sørlie T, Tibshirani R, Parker J, Hastie T, Marron JS, Nobel A, et al. Repeated observation of breast tumor subtypes in independent gene expression data sets. Proceedings of the National Academy of Sciences of the United States of America. 2003;100:8418–23. - PMC - PubMed
    1. Prat A, Perou CM. Deconstructing the molecular portraits of breast cancer. Molecular Oncology. 2011. Feb;5(1):5–23. - PMC - PubMed
    1. Herschkowitz J, Simin K, Weigman VJ, Mikaelian I, Usary J, Hu Z, et al. Identification of conserved gene expression features between murine mammary carcinoma models and human breast tumors. Genome Biology. 2006;8:R76–R76. - PMC - PubMed

Publication types

Substances