. 2022 Feb 18;5(5):e202101286.
doi: 10.26508/lsa.202101286. Print 2022 May.

Obesity-induced senescent macrophages activate a fibrotic transcriptional program in adipocyte progenitors

Affiliations

Obesity-induced senescent macrophages activate a fibrotic transcriptional program in adipocyte progenitors

Nabil Rabhi et al. Life Sci Alliance. .

Abstract

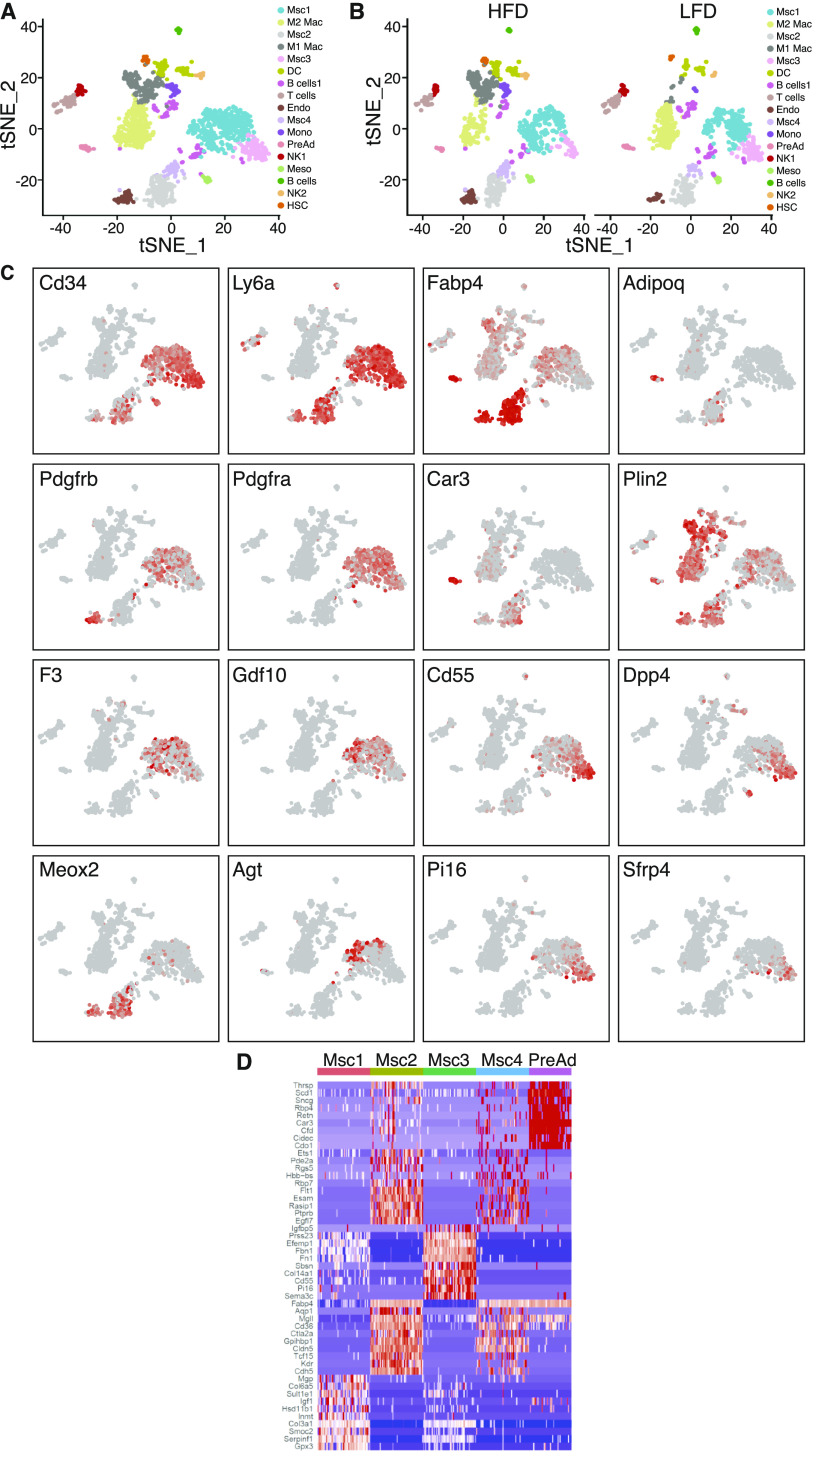
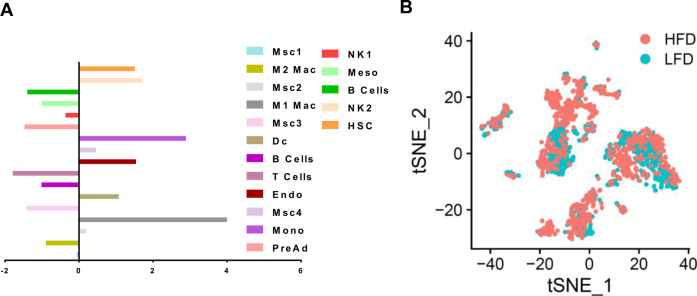
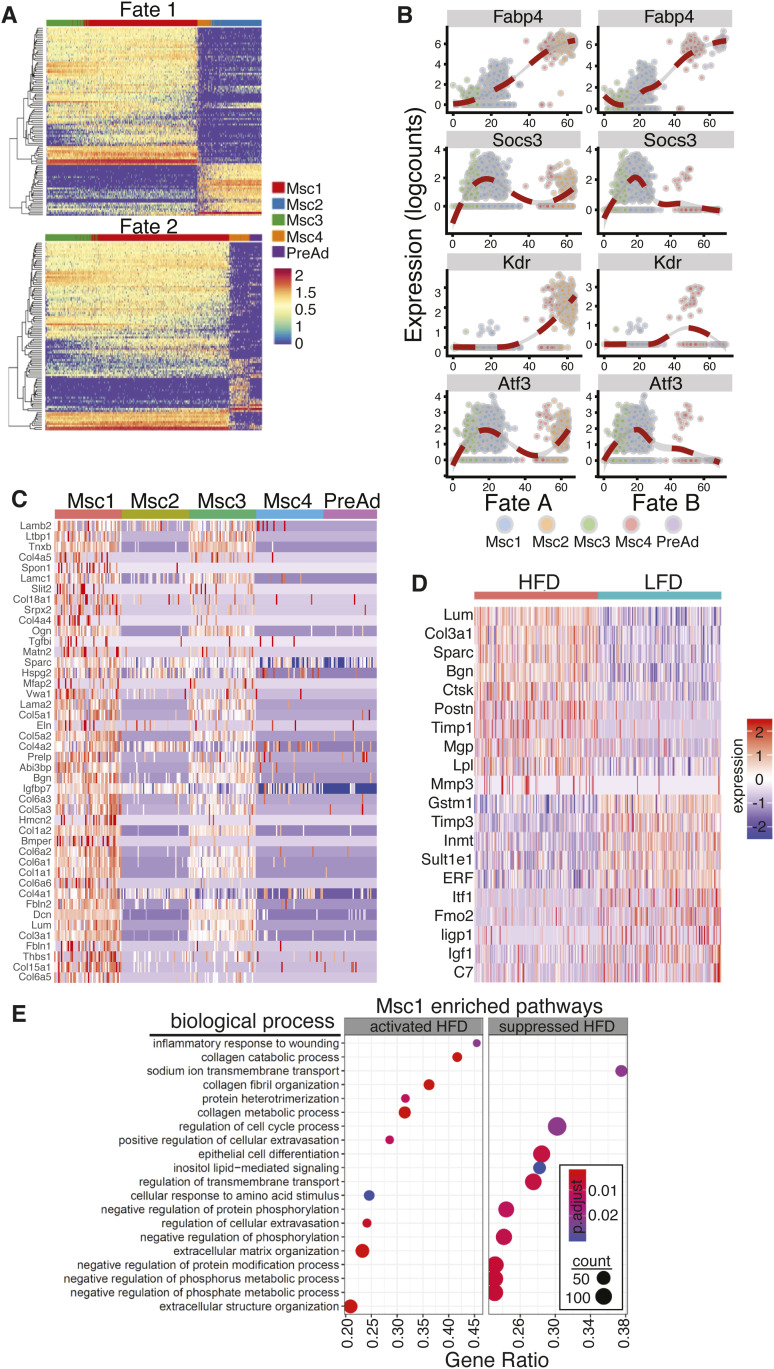
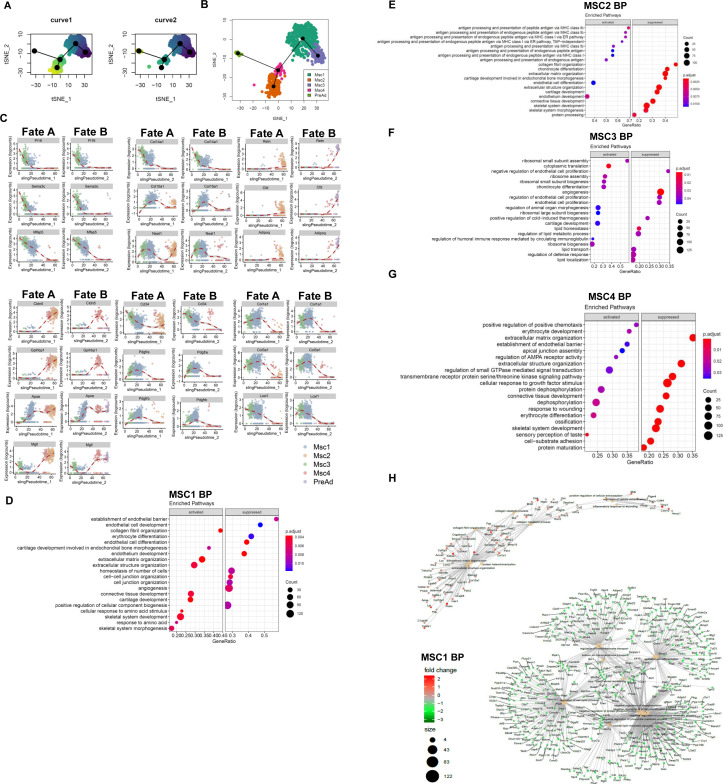
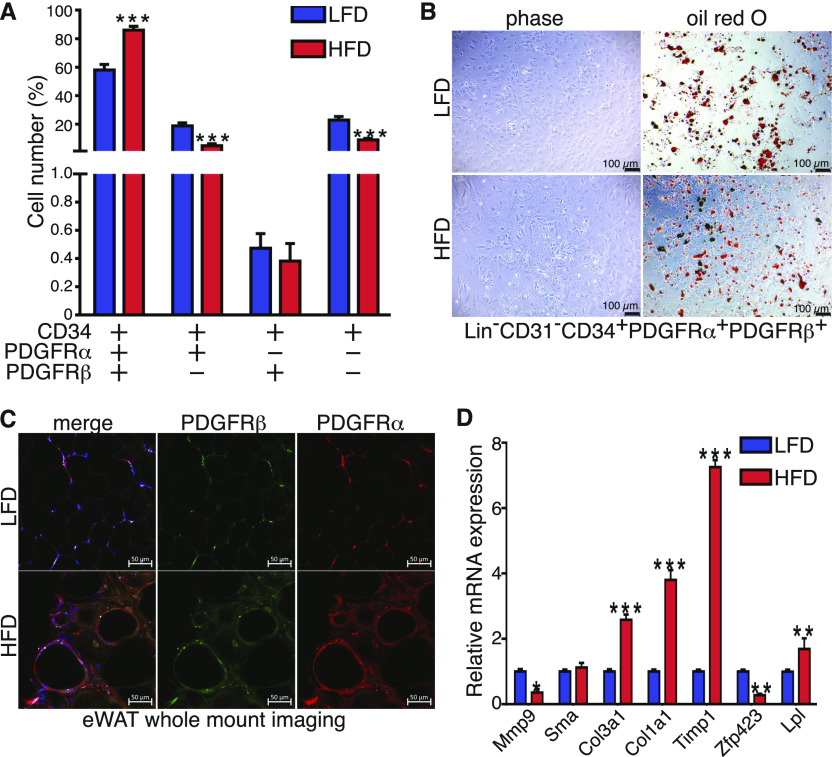
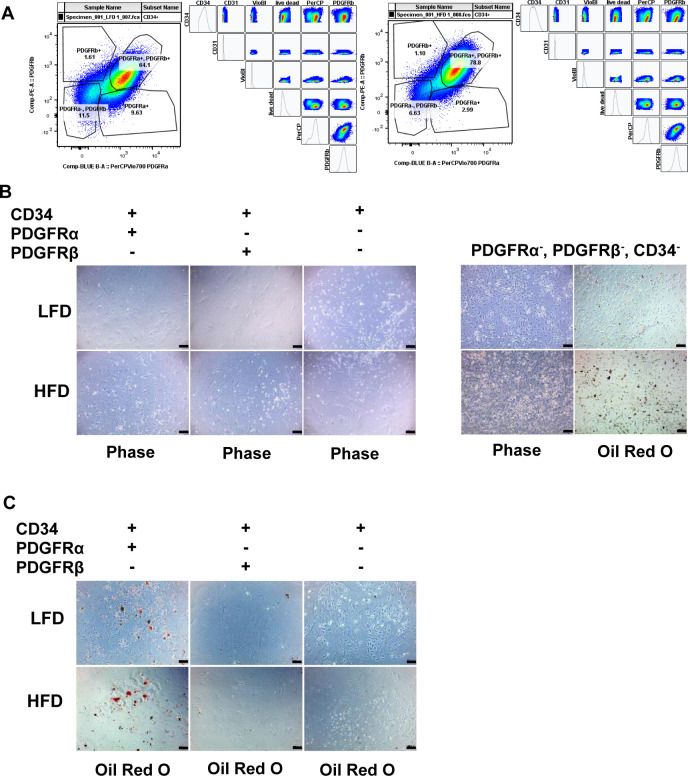
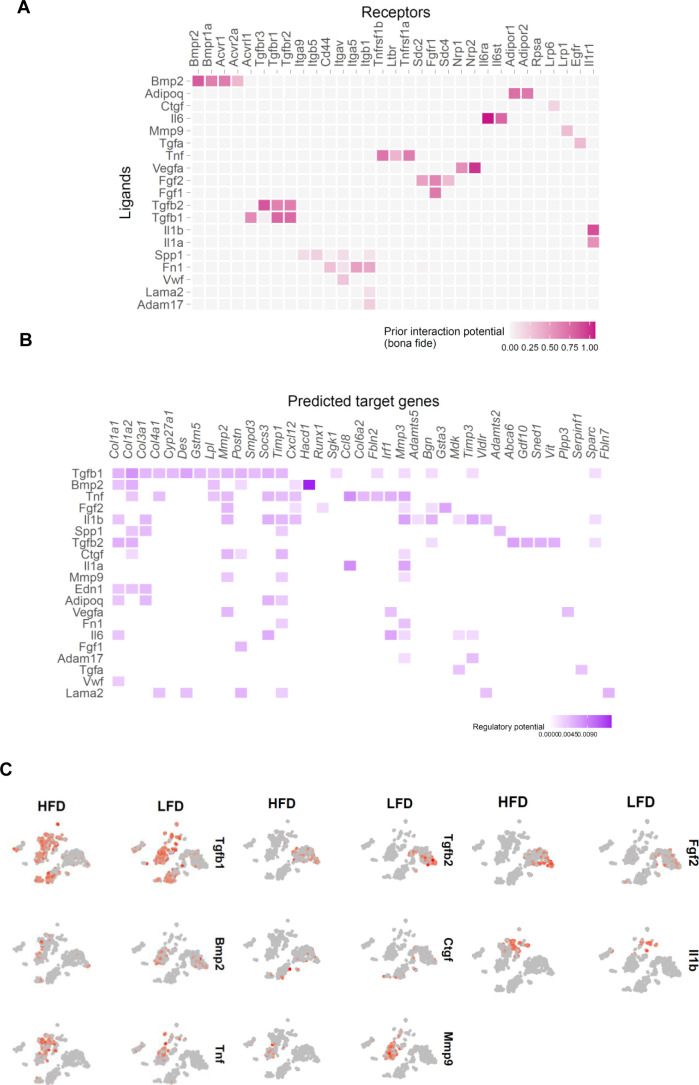
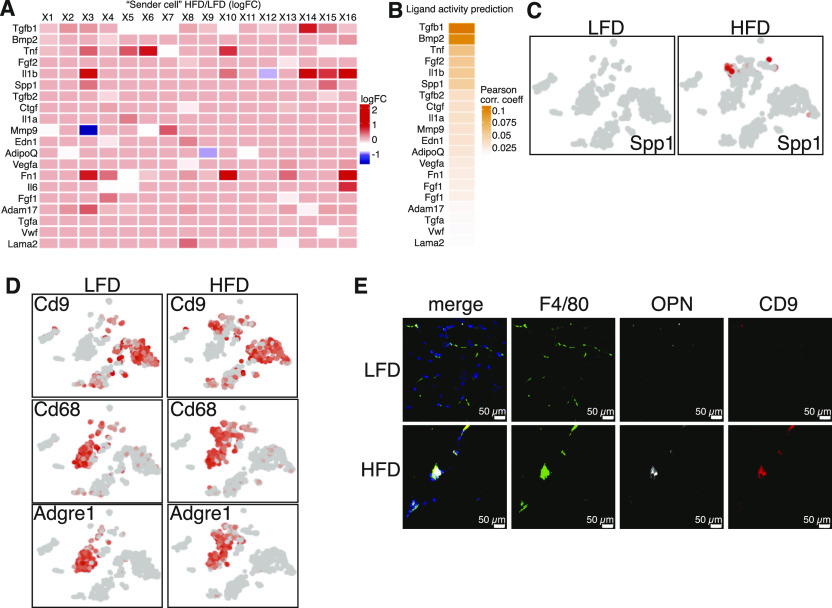
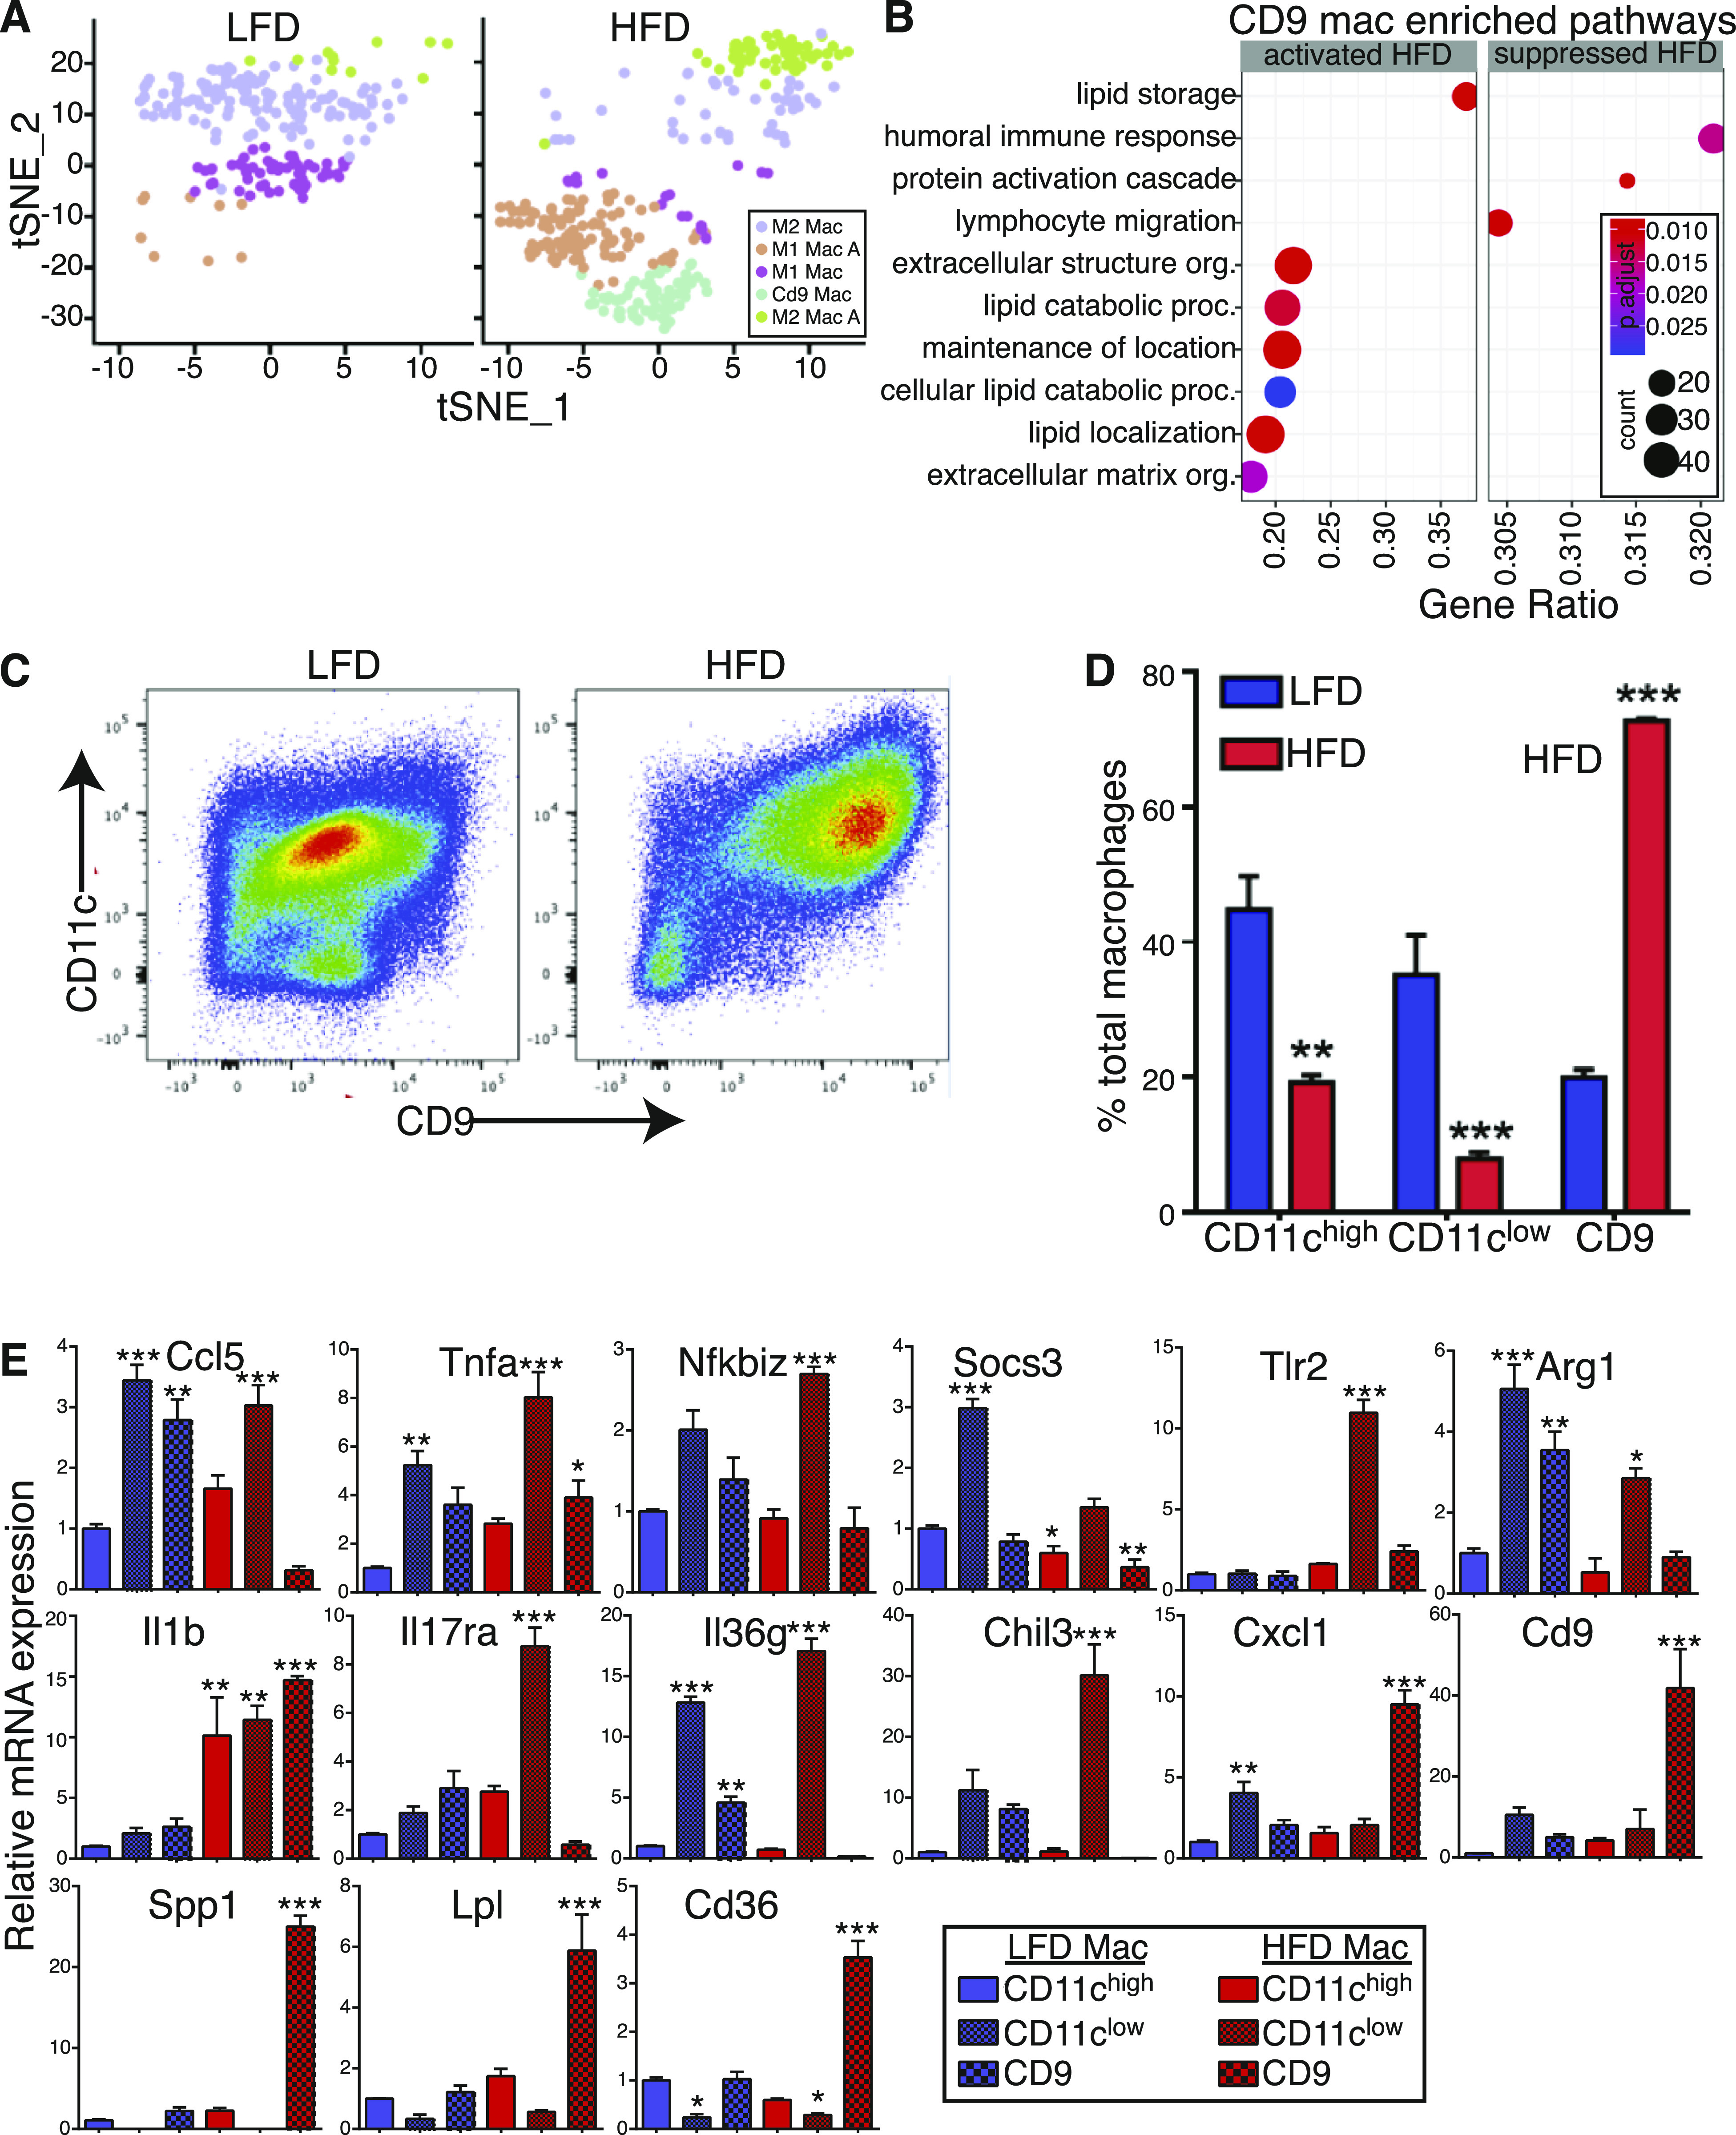
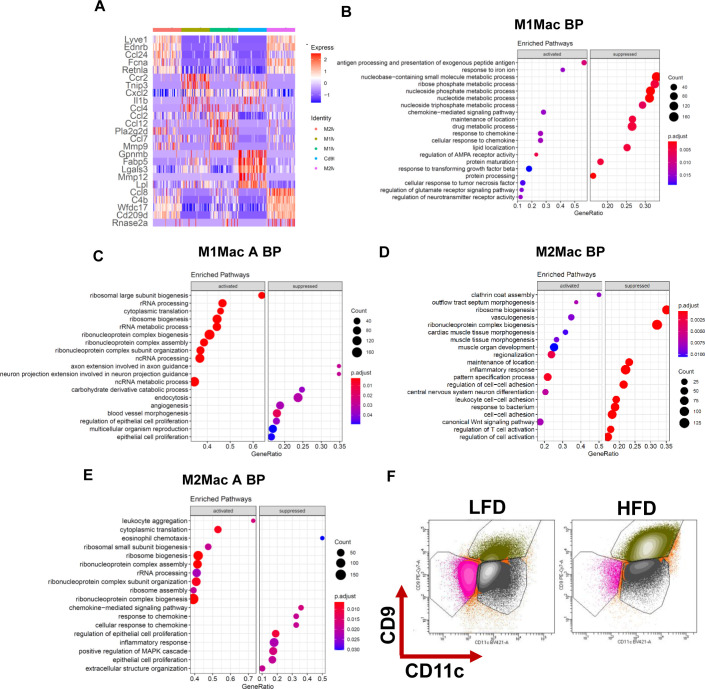
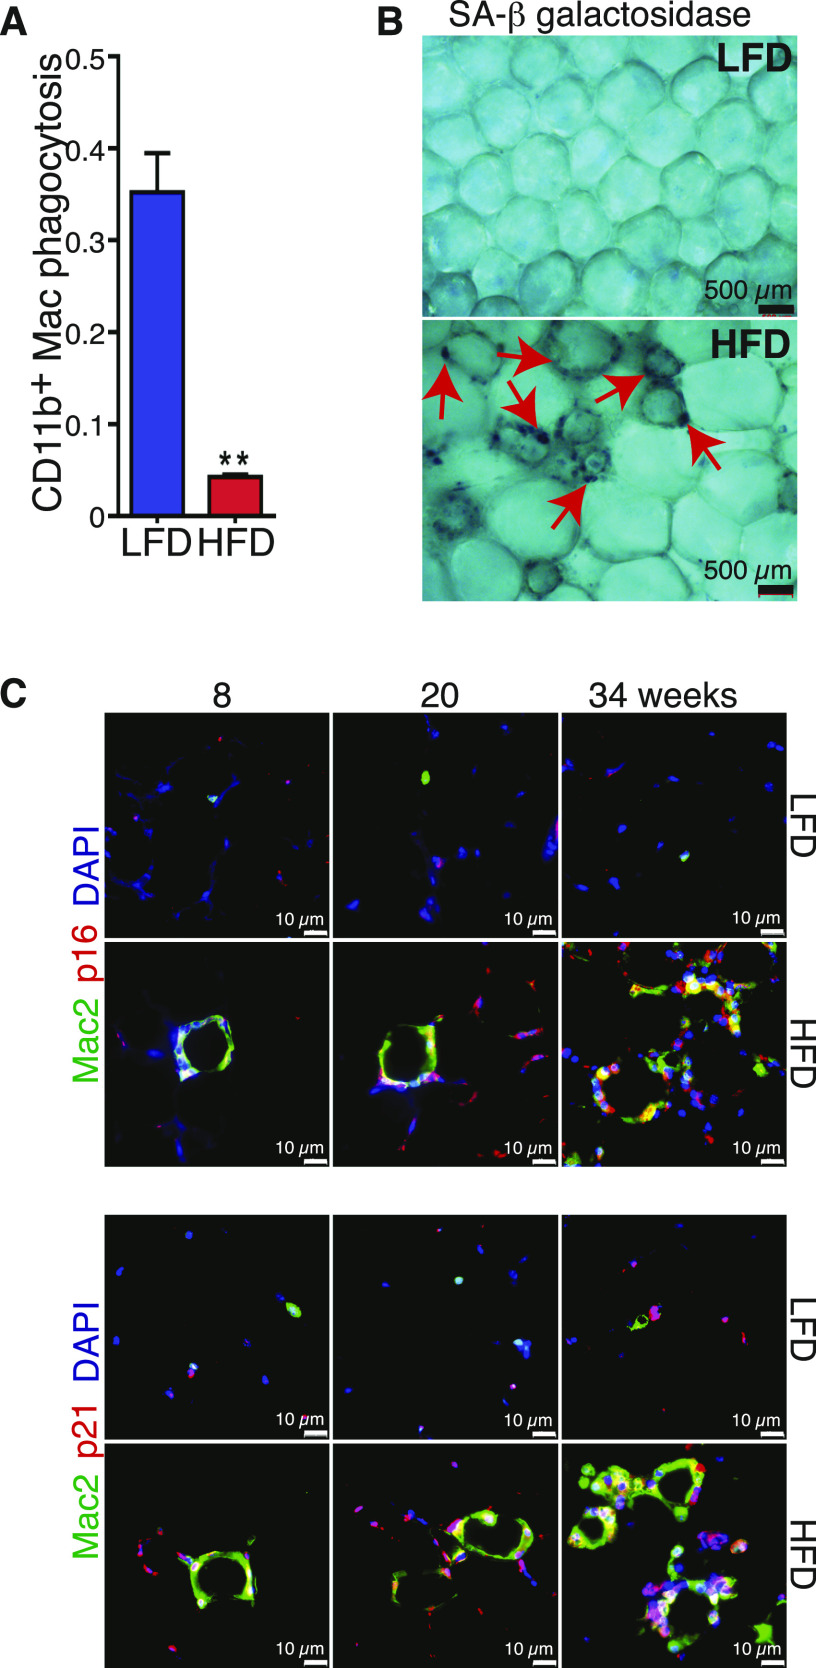
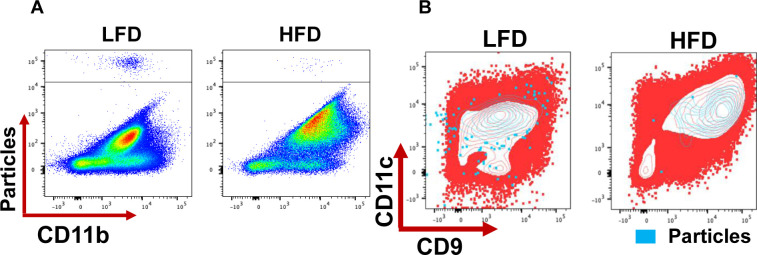
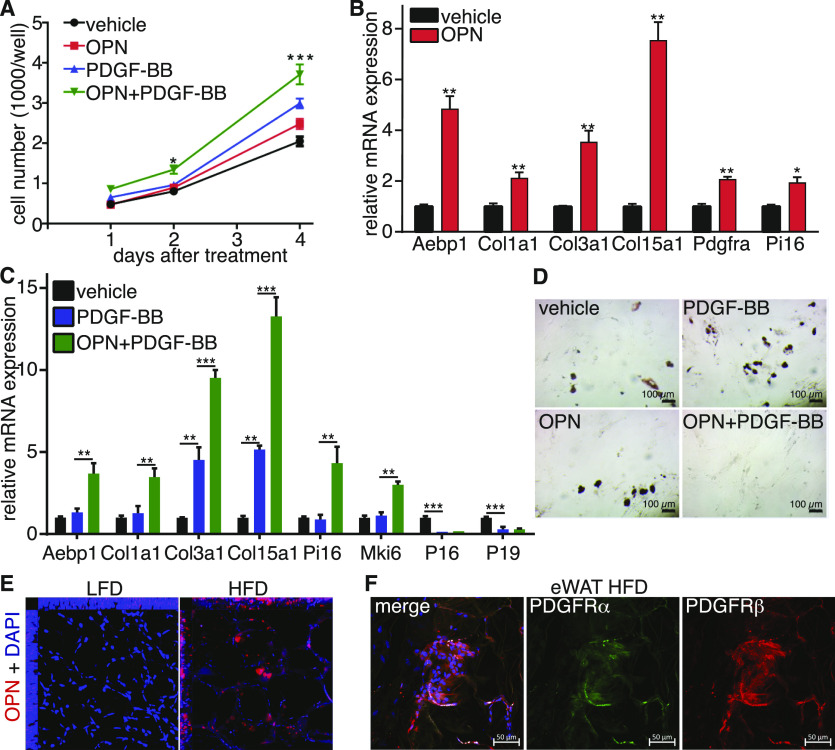
Adipose tissue fibrosis is regulated by the chronic and progressive metabolic imbalance caused by differences in caloric intake and energy expenditure. By exploring the cellular heterogeneity within fibrotic adipose tissue, we demonstrate that early adipocyte progenitor cells expressing both platelet-derived growth factor receptor (PDGFR) α and β are the major contributors to extracellular matrix deposition. We show that the fibrotic program is promoted by senescent macrophages. These macrophages were enriched in the fibrotic stroma and exhibit a distinct expression profile. Furthermore, we demonstrate that these cells display a blunted phagocytotic capacity and acquire a senescence-associated secretory phenotype. Finally, we determined that osteopontin, which was expressed by senescent macrophages in the fibrotic environment promoted progenitor cell proliferation, fibrotic gene expression, and inhibited adipogenesis. Our work reveals that obesity promotes macrophage senescence and provides a conceptual framework for the discovery of rational therapeutic targets for metabolic and inflammatory disease associated with obesity.


Figures

Figure 1.
Figure 1.. Characterization of the fibrotic stromal microenvironment.
(A) t-SNE plots of eWAT SVF populations identified by single cell from combined dataset of 24-wk low-fat diet and high-fat diet feed mice, which identified 17 clusters. (B) Side-by-side t-SNE plots of eWAT SVF populations from 24-wk low-fat diet and high-fat diet feed mice. (C) t-SNE expression plots of differentially expressed genes displaying select markers. (D) Heat map of top 10 marker genes differentially expressed in mesenchymal stem cells and preadipocytes.
Figure S1.
Figure S1.. Characterization of the fibrotic stromal microenvironment.
(A) Bar chart showing population fold-changes in relative abundance of each cluster induced by 24-wk high-fat diet compared with low-fat diet mice. (B) t-SNE plots of eWAT SVF cells comparison from low-fat diet and high-fat diet.
Figure 2.
Figure 2.. Progenitor cells produce ECM.
(A) Heat map of the top 250 genes that are associated with each lineage identified. (B) Expression profiles of select genes during both lineages identified; dots represent a cell and line represents the loess regression. (C) Heat map of ECM genes differentially expressed in mesenchymal stem cells and preadipocytes. (D) Heat map of ECM genes differentially expressed between low-fat diet and high-fat diet in MSC1 population. (E) Dot plot of gene ontology (biological process) of activated and suppressed pathways by high-fat diet in MSC1 cluster.
Figure S2.
Figure S2.. Progenitor cells produce ECM.
(A) Pseudotime trajectory curve for each lineage (B) t-SNE of inferred trajectory of progenitor cells and preadipocytes. (C) Expression profiles of select genes during both lineages identified; dots represent a cell and line represents the loess regression. (D, E, F, G) Dot plot of gene ontology (molecular function) of activated and suppressed pathways in (D) MSC1, (E) MSC2, (F) MSC3, (G) MSC4 when compared with each other. (H) Gene concept network showing enriched terms for the genes down-regulated or up-regulated by high-fat diet feeding in MSC1 population; the color of the nodes representing log2 fold change in gene expression relative to the low-fat diet MSC1.
Figure 3.
Figure 3.. Early progenitor cells express both platelet-derived growth factor receptor (PDGFR)α and PDGFRβ and expand in mice fed a high-fat diet (HFD).
(A) Quantification of frequency of Lin: CD31 : CD34+ and either PDGFRα+ or PDGFRβ+ or double positive cells in the eWAT depot from 24-wk low-fat diet (LFD) and HFD feed mice performed by flow cytometry (n = 8). (B) Representative images of Oil Red O staining of in vitro differentiated Lin : CD31 : CD34+ : PDGFRα+ and PDGFRβ+ sorted cells form eWAT depot in 24-wk LFD and HFD feed mice, scale bars 100 μm. (C) Representative image of whole mount of PDGFRα and PDGFRβ immunofluorescent co-staining, scale bars 50 μm. (D) Real-time PCR analysis of select genes in Lin: CD31 : CD34+ : PDGFRα+ and PDGFRβ+ sorted cells form eWAT depot in 24-wk LFD and HFD feed mice (n = 4). All values are expressed as means ± SEM; statistical test *P < 0.05, **P < 0.01, and ***P < 0.001.
Figure S3.
Figure S3.. Early progenitor cells express both platelet-derived growth factor receptor (PDGFR)α and PDGFRβ and expand in mice fed a high-fat diet.
(A) Representative flow cytometry gating strategy for Lin : Cd31 : Cd34+ and either Pdgfrα+ or Pdgfrβ+ or double positive cells in both low-fat diet and high-fat diet SVF from eWAT. (B) Representative images of non-differentiated Lin : Cd31 : Cd34+ and either Pdgfra+ or Pdgfrb+, double positive or negative sorted cells. (C) Representative images of Oil Red O staining of differentiated Lin : Cd31 : Cd34+ and either Pdgfrα+ or Pdgfrβ+, double positive or negative sorted cells, scale bars 100 μm.
Figure S4.
Figure S4.. CD9+ macrophages communicate with platelet-derived growth factor receptor α and platelet-derived growth factor receptor β progenitor cells through the secretion of osteopontin.
(A) Ligand–target matrix denoting the regulatory potential between all clusters ligands (Sender cells) and target receptors from the MSC1 cluster (Receiver cells). (B) Ligand–target matrix denoting the regulatory potential between all clusters ligands (Sender cells) and target genes from the MSC1 cluster (Receiver cells). (C) t-SNE expression plots of secreted proteins.
Figure 4.
Figure 4.. CD9+ macrophages communicate with platelet-derived growth factor receptor α and platelet-derived growth factor receptor β progenitor cells through the secretion of osteopontin.
(A) “Sender” cells differentially express potential pan-ligands a cross each cluster between low-fat diet (LFD) and high-fat diet (HFD) eWAT. Ligand-cell pairings indicate cell types in which the corresponding ligand is significantly differentially five expressed in HFD with adjusted P < 0.05. Average natural log fold change (ratio of HFD to LFD expression) is shown in the blue-red color scale. (B) Ligand activity prediction ranked by Pearson correlation coefficient (orange color scale). (C) t-SNE expression plots of osteopontin (Spp1). (D) t-SNE expression plots of select macrophages markers and Cd9. (E) Representative image of F4/80, OPN, and CD9 immunofluorescent co-staining in 24-wk LFD and HFD feed mice, scale bars 50 μm.
Figure 5.
Figure 5.. Accumulation of CD9+ macrophages in high-fat diet (HFD) white adipose tissue.
(A) Side-by-side t-SNE plots of macrophages. (B) Dot plot of gene ontology (biological process) of activated and suppressed pathways by HFD in CD9 macrophages. (C) Representative high scatter dot plot images of flow cytometry showing the appearance of CD11c, CD9 population in HFD. (D) Quantification of frequency of macrophages populations in the eWAT depot from 24-wk low-fat diet and HFD feed mice performed by flow cytometry (n = 8). (E) Real-time PCR analysis of select genes in sorted macrophages form eWAT depot in 24-wk low-fat diet and HFD feed mice.
Figure S5.
Figure S5.. Accumulation of CD9+ macrophages in high-fat diet WAT.
(A) Heatmap of top 5 markers gene differentially expressed in macrophages. (B, C, D, E, F) Dot plot of gene ontology (molecular function) of activated and suppressed pathways in (B) M1 macrophages (C) M1 activated macrophages (D) M2 macrophages (E) M2 activated macrophages (F) Representative high scatter dot plot images of flow cytometry gating strategy of CD11c, CD9 macrophage population.
Figure 6.
Figure 6.. CD9+ macrophages are senescent cells.
(A) Quantification of macrophages in the eWAT depot from 24-wk low-fat diet (LFD) and high-fat diet (HFD) feed mice phagocytic capacity measured by flow cytometry (n = 8). (B) Senescence-associated (SA) b gal staining in fresh isolated eWAT from 24-wk LFD and HFD feed mice, scale bars 500 μm. (C) Representative image of Mac-2, P16, and P21 immunofluorescent co-staining in 8, 20 and 34-wk LFD and HFD feed mice, scale bars 10 μm. Data are presented as mean ± SEM. P-values*P < 0.05, **P < 0.01, ***P < 0.001.
Figure S6.
Figure S6.. CD9+ macrophages are senescent cells.
(A) Representative scatter dot plot images of flow cytometry showing the macrophages phagocytic capacity after 30 min incubation. (B) Representative scatter dot plot images of flow cytometry showing an overlay of phagocytic cells over all Cd11b+ cells.
Figure 7.
Figure 7.. Osteopontin secreted by CD9+ macrophages cooperate with PDGF-BB to stimulate progenitor cell proliferation and inhibit adipogenesis.
(A) Quantification of cellular proliferation assay (n = 6). (B) Real-time PCR analysis of select genes in sorted progenitor cells treated with OPN or vehicle for 2 d. (C) Real-time PCR analysis of select genes in sorted progenitor cells treated with PDGF-BB alone, combined with OPN or vehicle for 2 d (n = 4). (D) Representative images of Oil Red O staining of in vitro differentiated progenitor cells treated with OPN, PDGF-BB, a combination of the two or vehicle for 2 d (n = 4), scale bars 100 μm. (E) Orthogonal view of z-stack images of whole mount immunostaining of OPN. (F) Representative image of whole mount of platelet-derived growth factor receptor α and platelet-derived growth factor receptor β immunofluorescent co-staining in eWAT for 24-wk high-fat diet feed mice, scale bars 50 μm. Data are presented as mean ± SEM. P-values. *P < 0.05, **P < 0.01, ***P < 0.001.
Figure S7.
Figure S7.. Osteopontin secreted by CD9+ macrophages cooperate with PDGF-BB to stimulate progenitor cell proliferation and inhibit adipogenesis.
Representative images of proliferation assay.

References

    1. Berry R, Rodeheffer MS (2013) Characterization of the adipocyte cellular lineage in vivo. Nat Cell Biol 15: 302–308. 10.1038/ncb2696 - DOI - PMC - PubMed
    1. Browaeys R, Saelens W, Saeys Y (2020) NicheNet: Modeling intercellular communication by linking ligands to target genes. Nat Methods 17: 159–162. 10.1038/s41592-019-0667-5 - DOI - PubMed
    1. Burl RB, Ramseyer VD, Rondini EA, Pique-Regi R, Lee YH, Granneman JG (2018) Deconstructing adipogenesis induced by β3-adrenergic receptor activation with single-cell expression profiling. Cell Metab 28: 300–309.e4. 10.1016/j.cmet.2018.05.025 - DOI - PMC - PubMed
    1. Chen PH, Chen X, He X (2013) Platelet-derived growth factors and their receptors: Structural and functional perspectives. Biochim Biophys Acta 1834: 2176–2186. 10.1016/j.bbapap.2012.10.015 - DOI - PMC - PubMed
    1. Childs BG, Baker DJ, Wijshake T, Conover CA, Campisi J, van Deursen JM (2016) Senescent intimal foam cells are deleterious at all stages of atherosclerosis. Science 354: 472–477. 10.1126/science.aaf6659 - DOI - PMC - PubMed

Publication types