. 2022 Apr 1;10(4):403-419.
doi: 10.1158/2326-6066.CIR-21-0588.

Holistic Characterization of Tumor Monocyte-to-Macrophage Differentiation Integrates Distinct Immune Phenotypes in Kidney Cancer

Affiliations

Holistic Characterization of Tumor Monocyte-to-Macrophage Differentiation Integrates Distinct Immune Phenotypes in Kidney Cancer

Adriana M Mujal et al. Cancer Immunol Res. .

Abstract

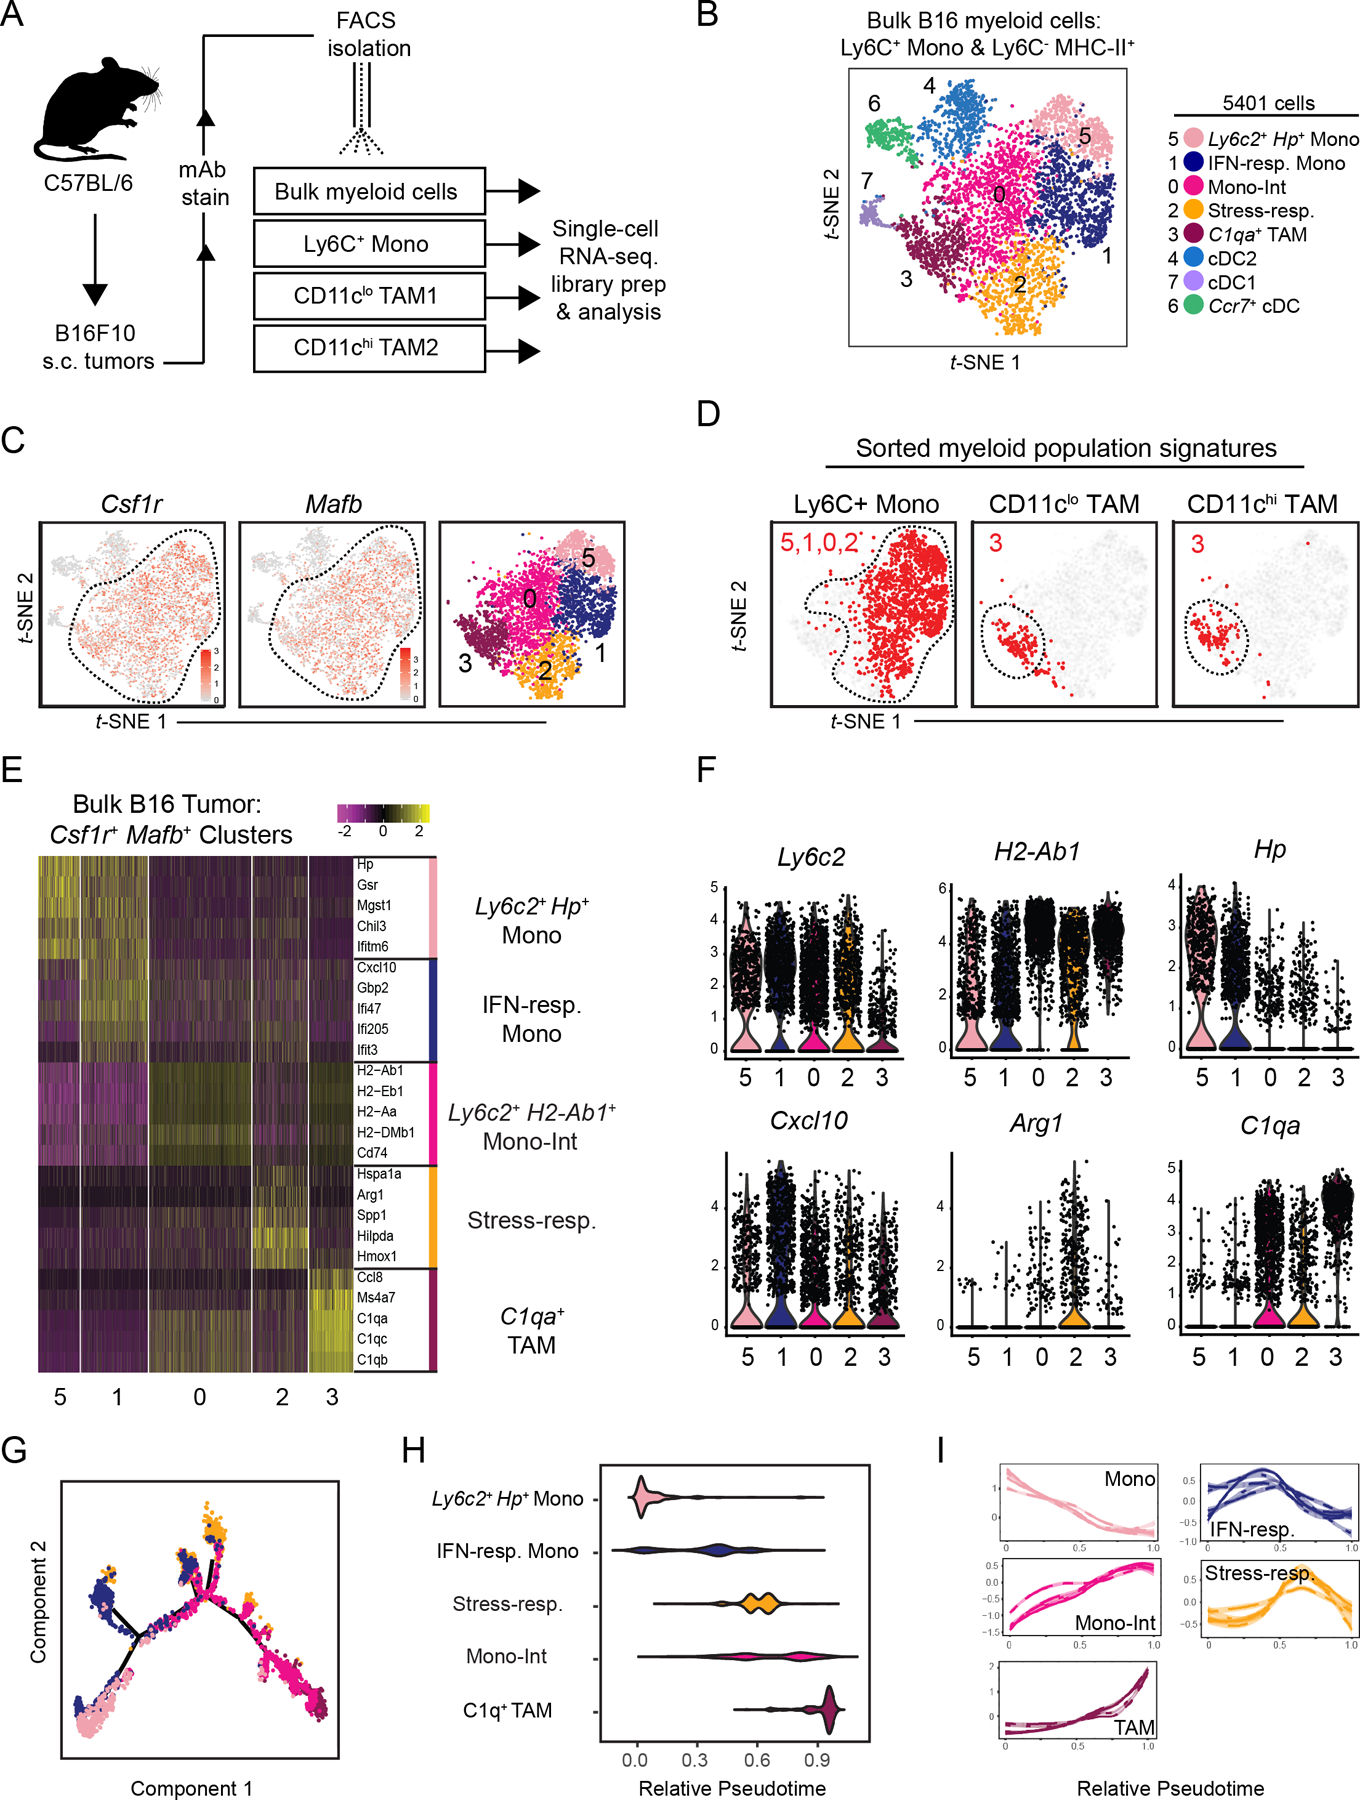
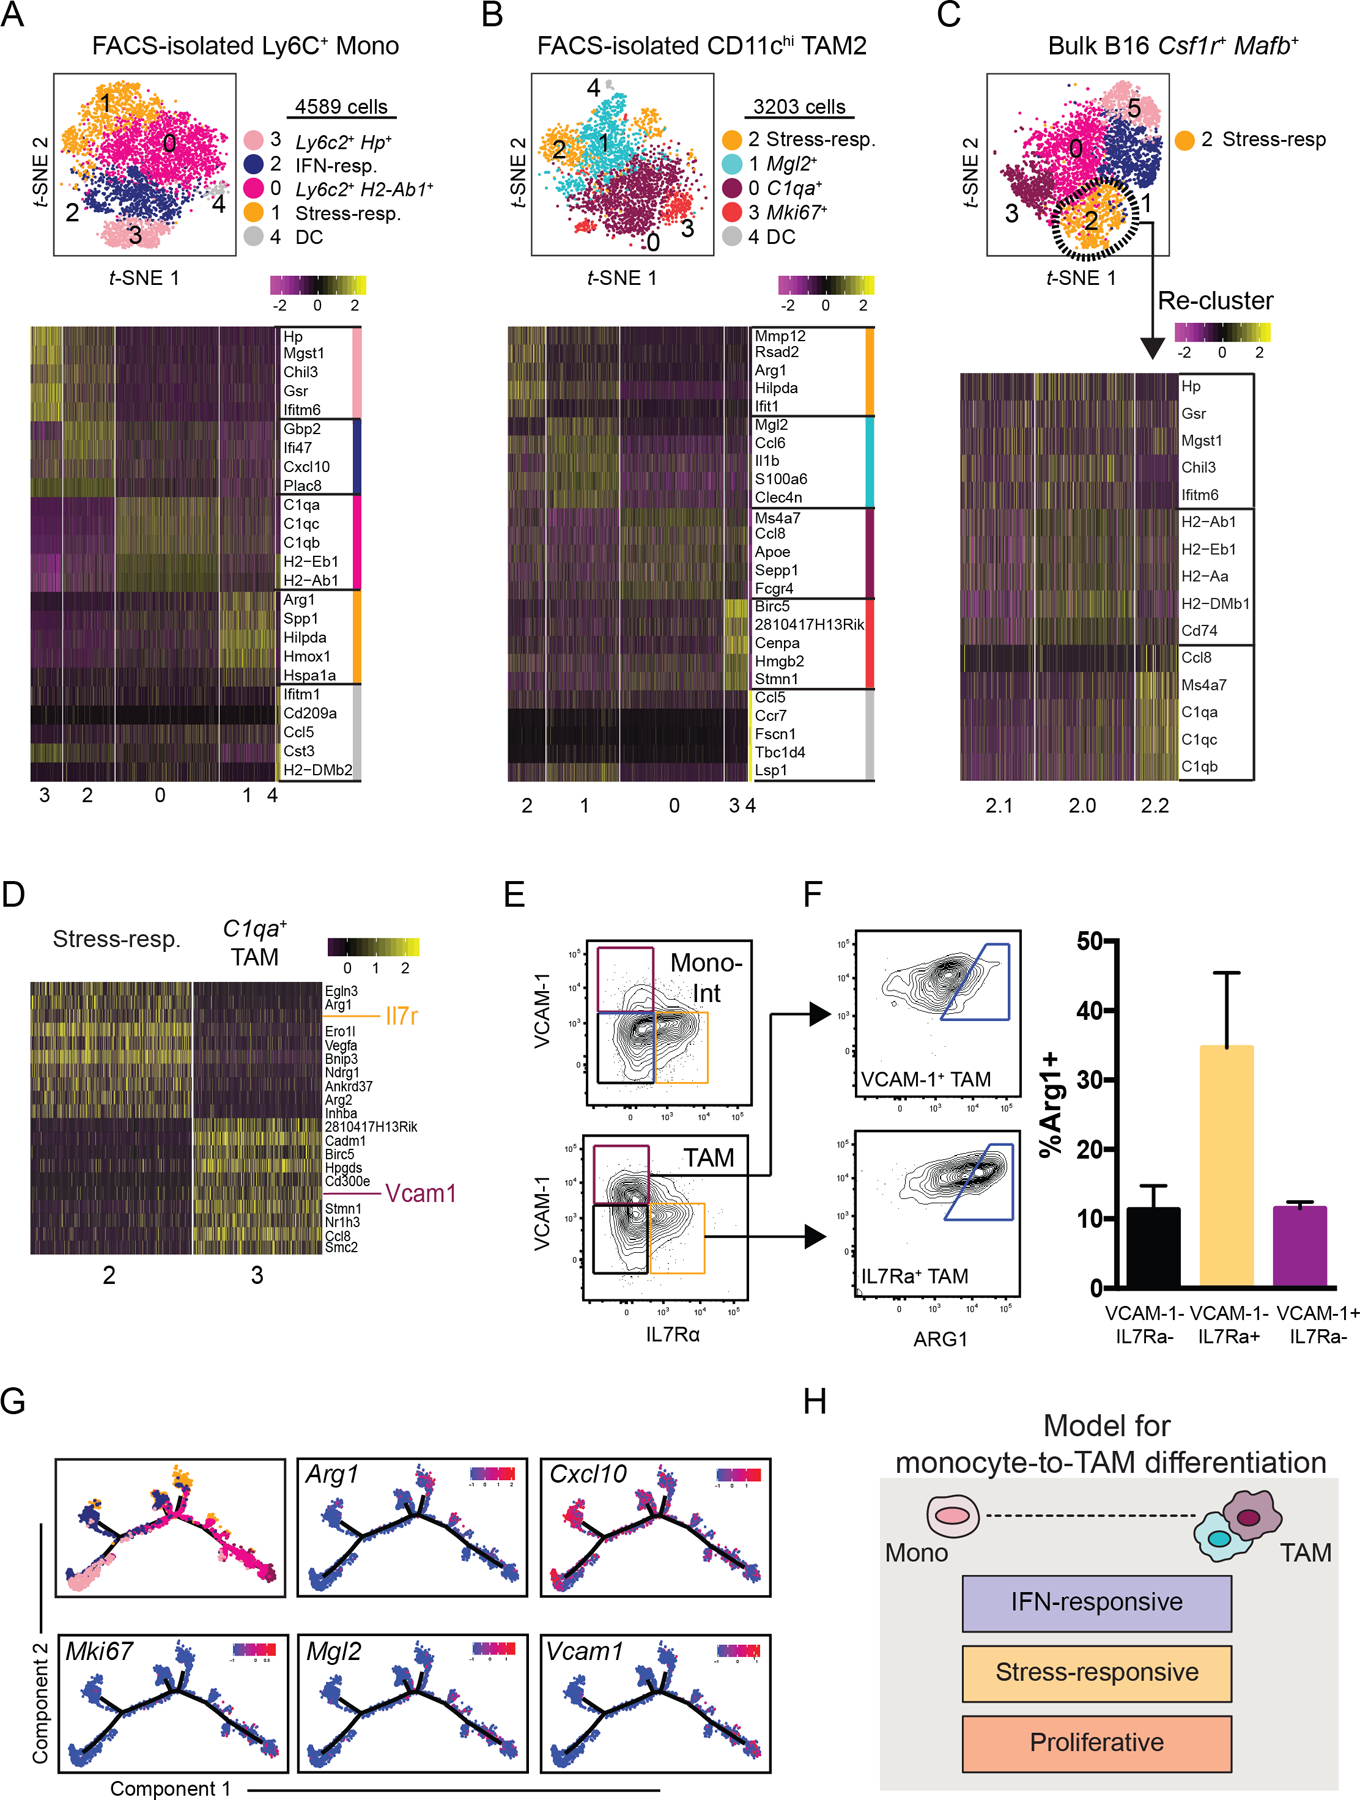
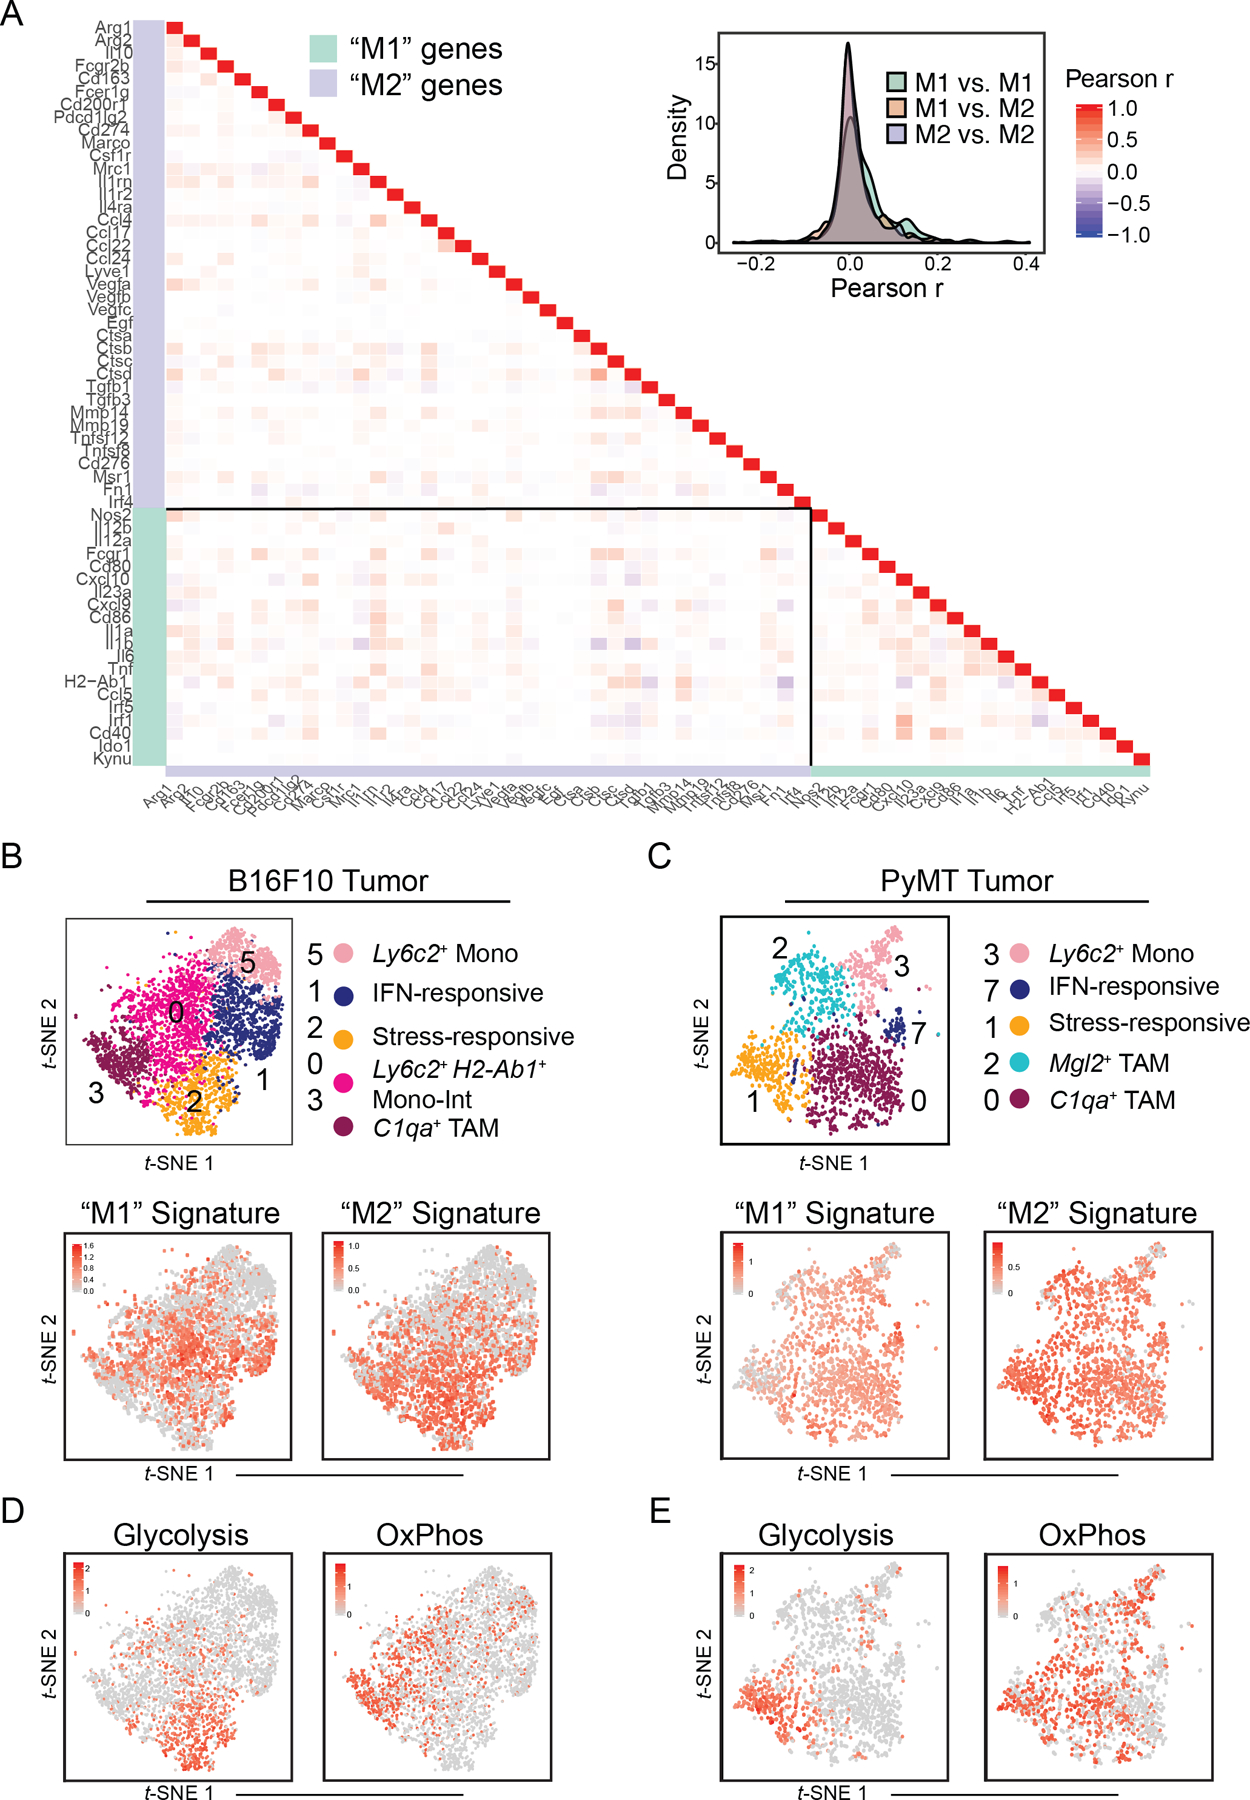
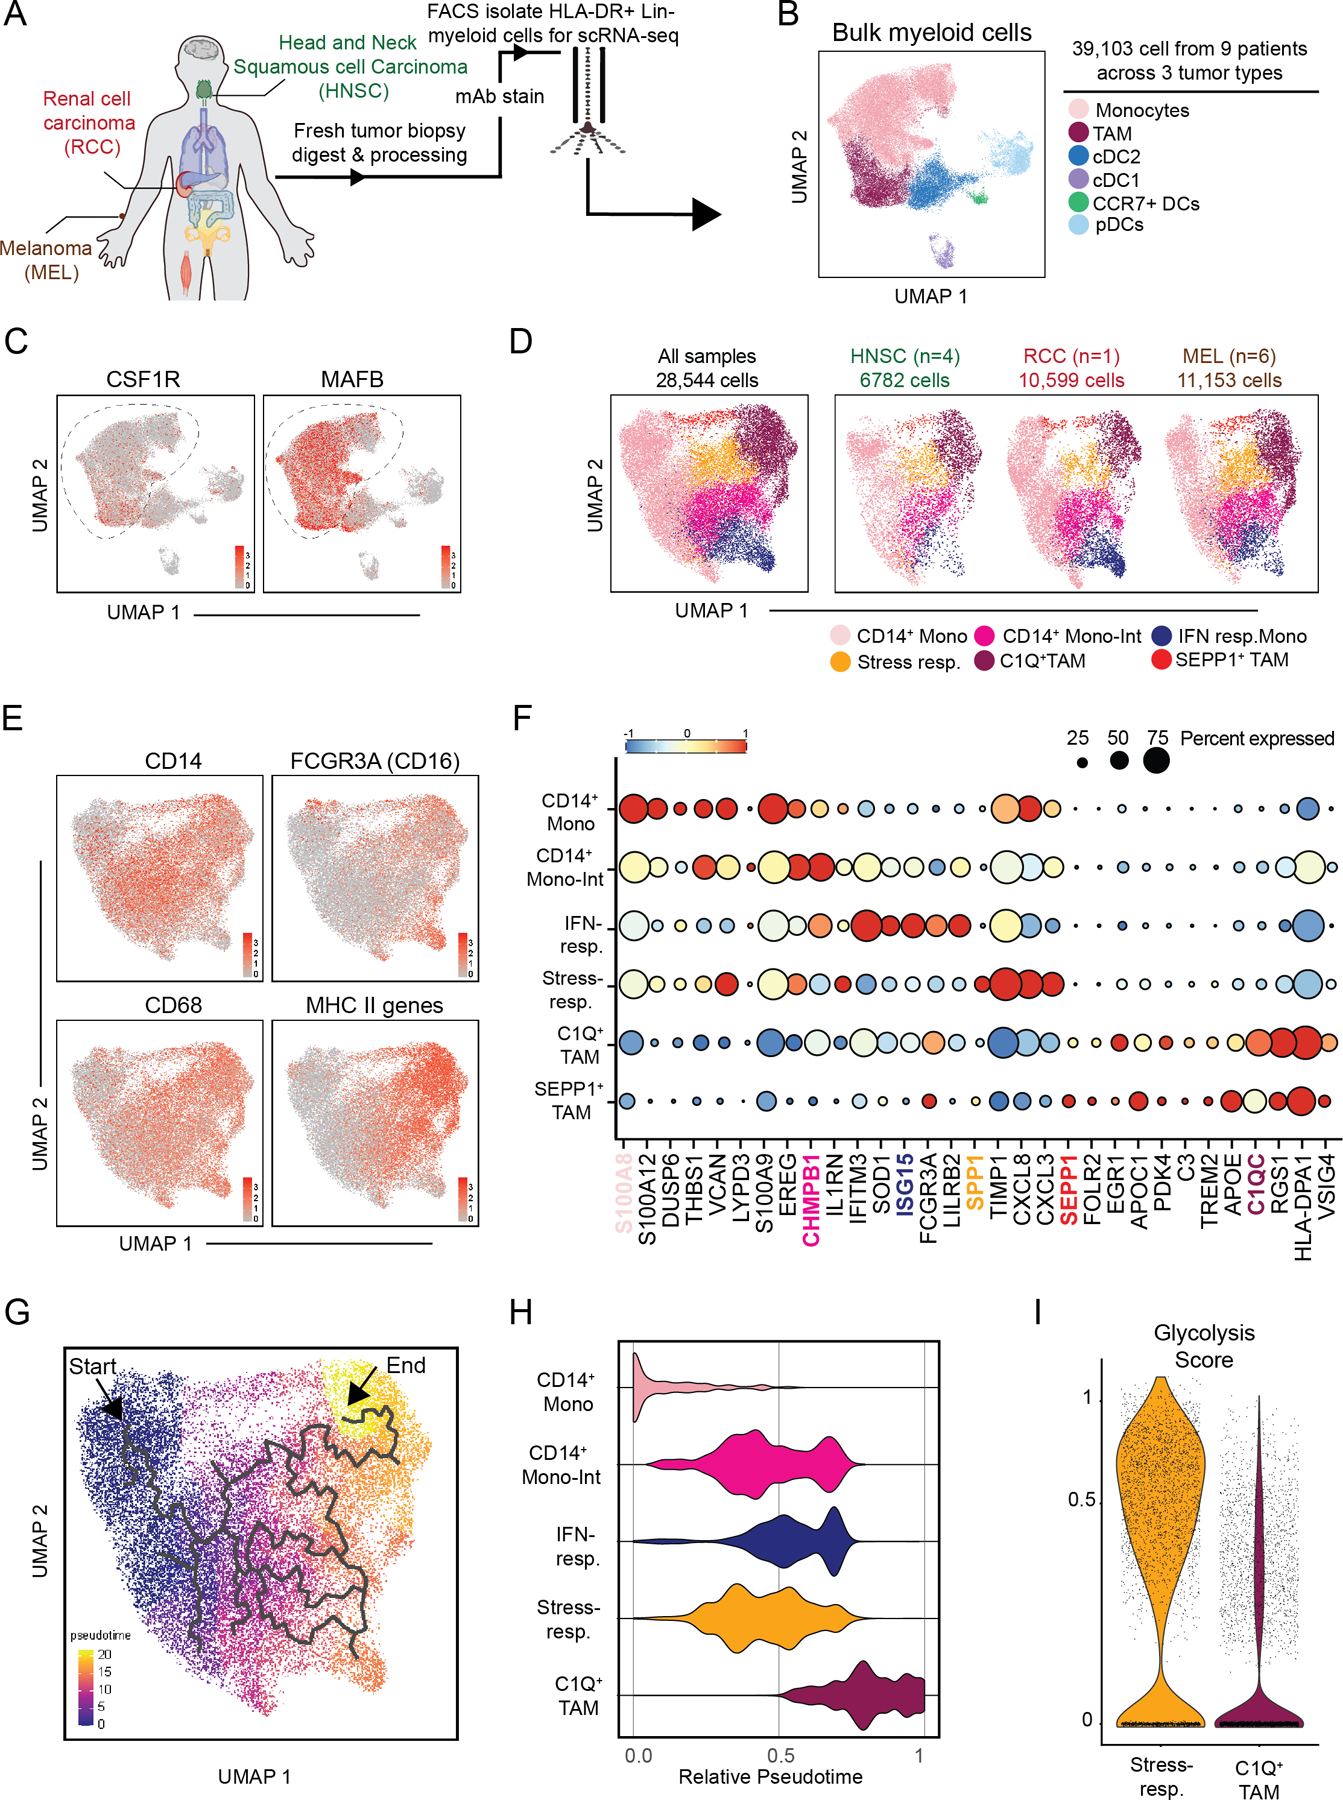
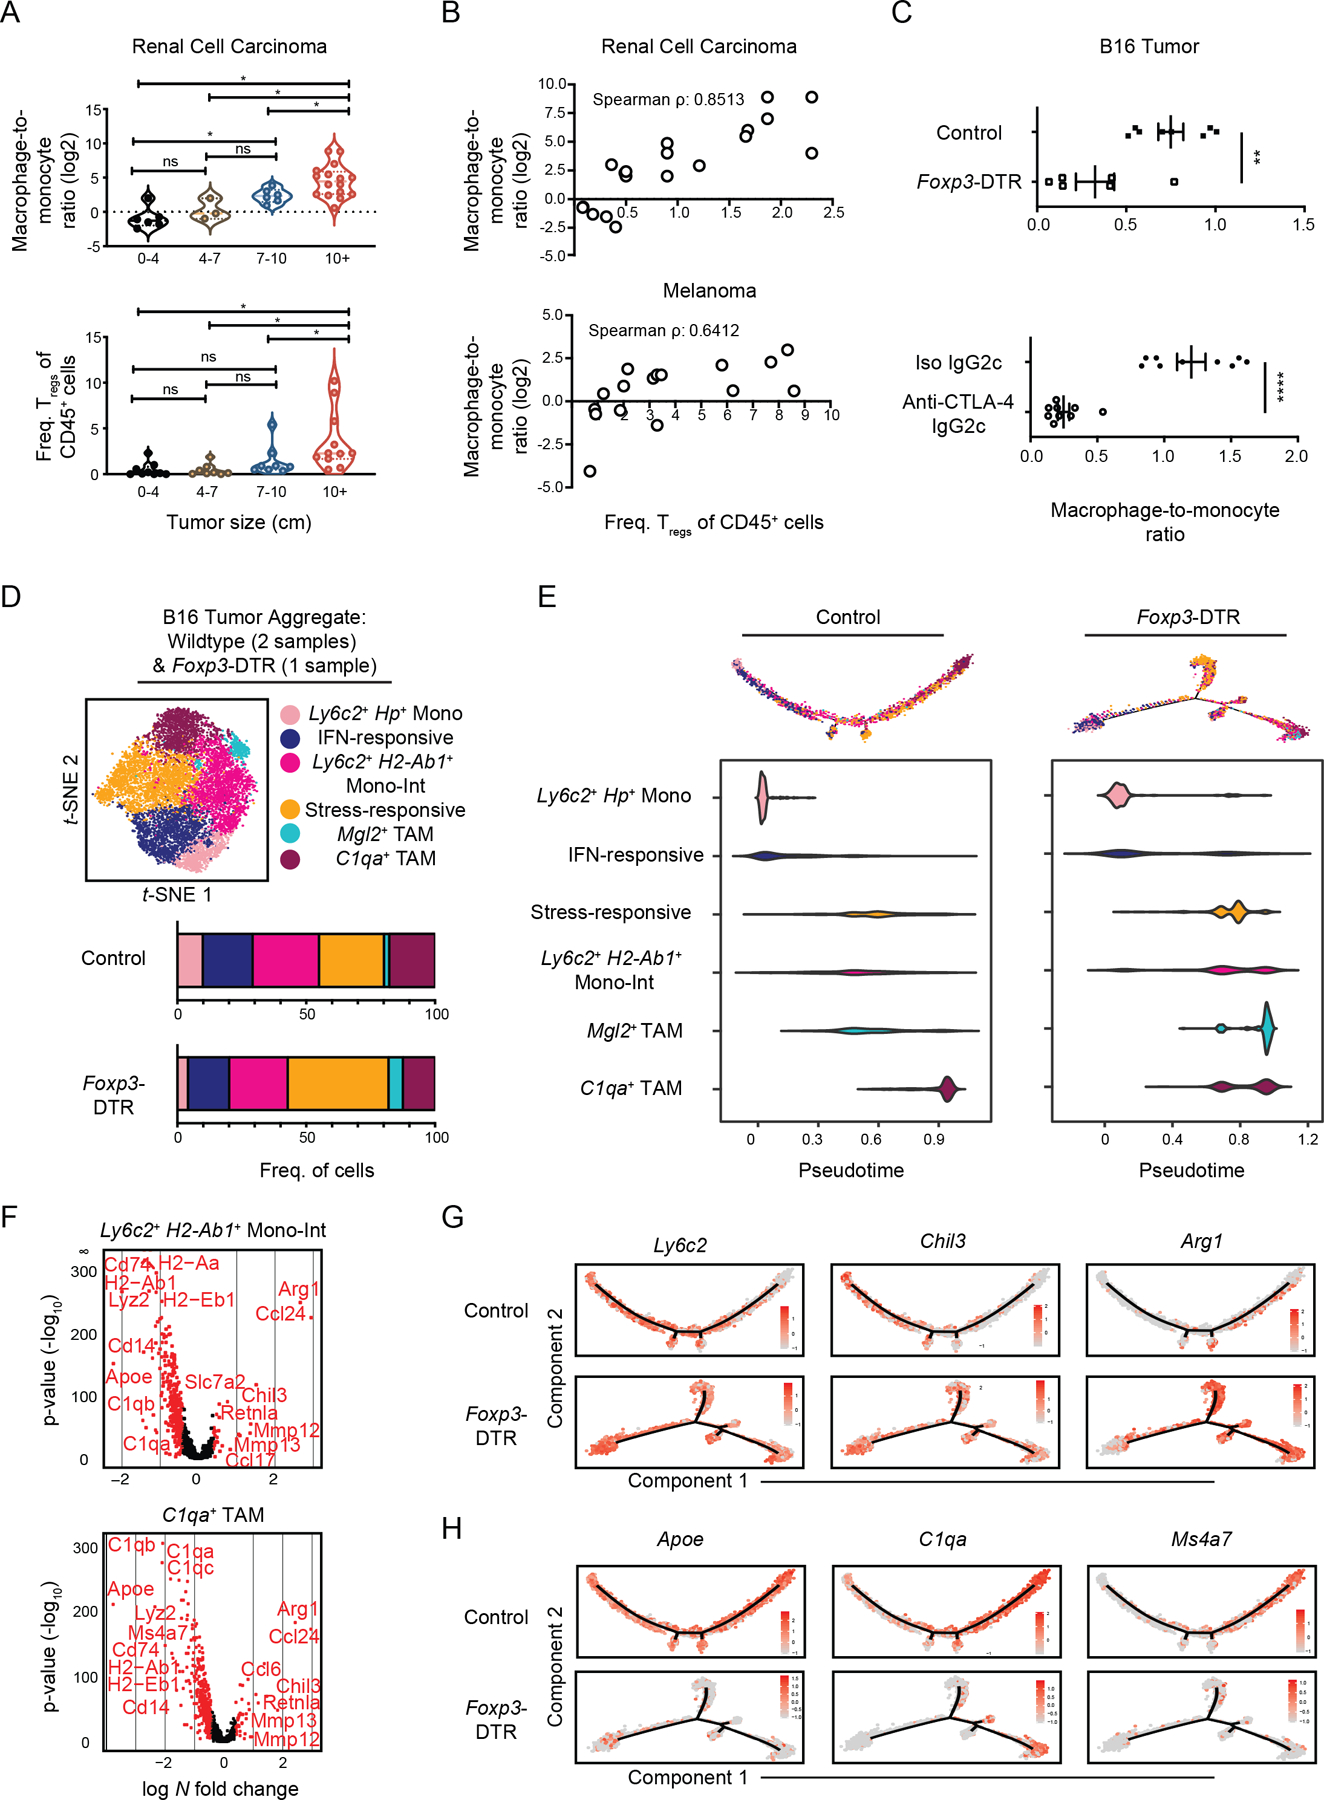
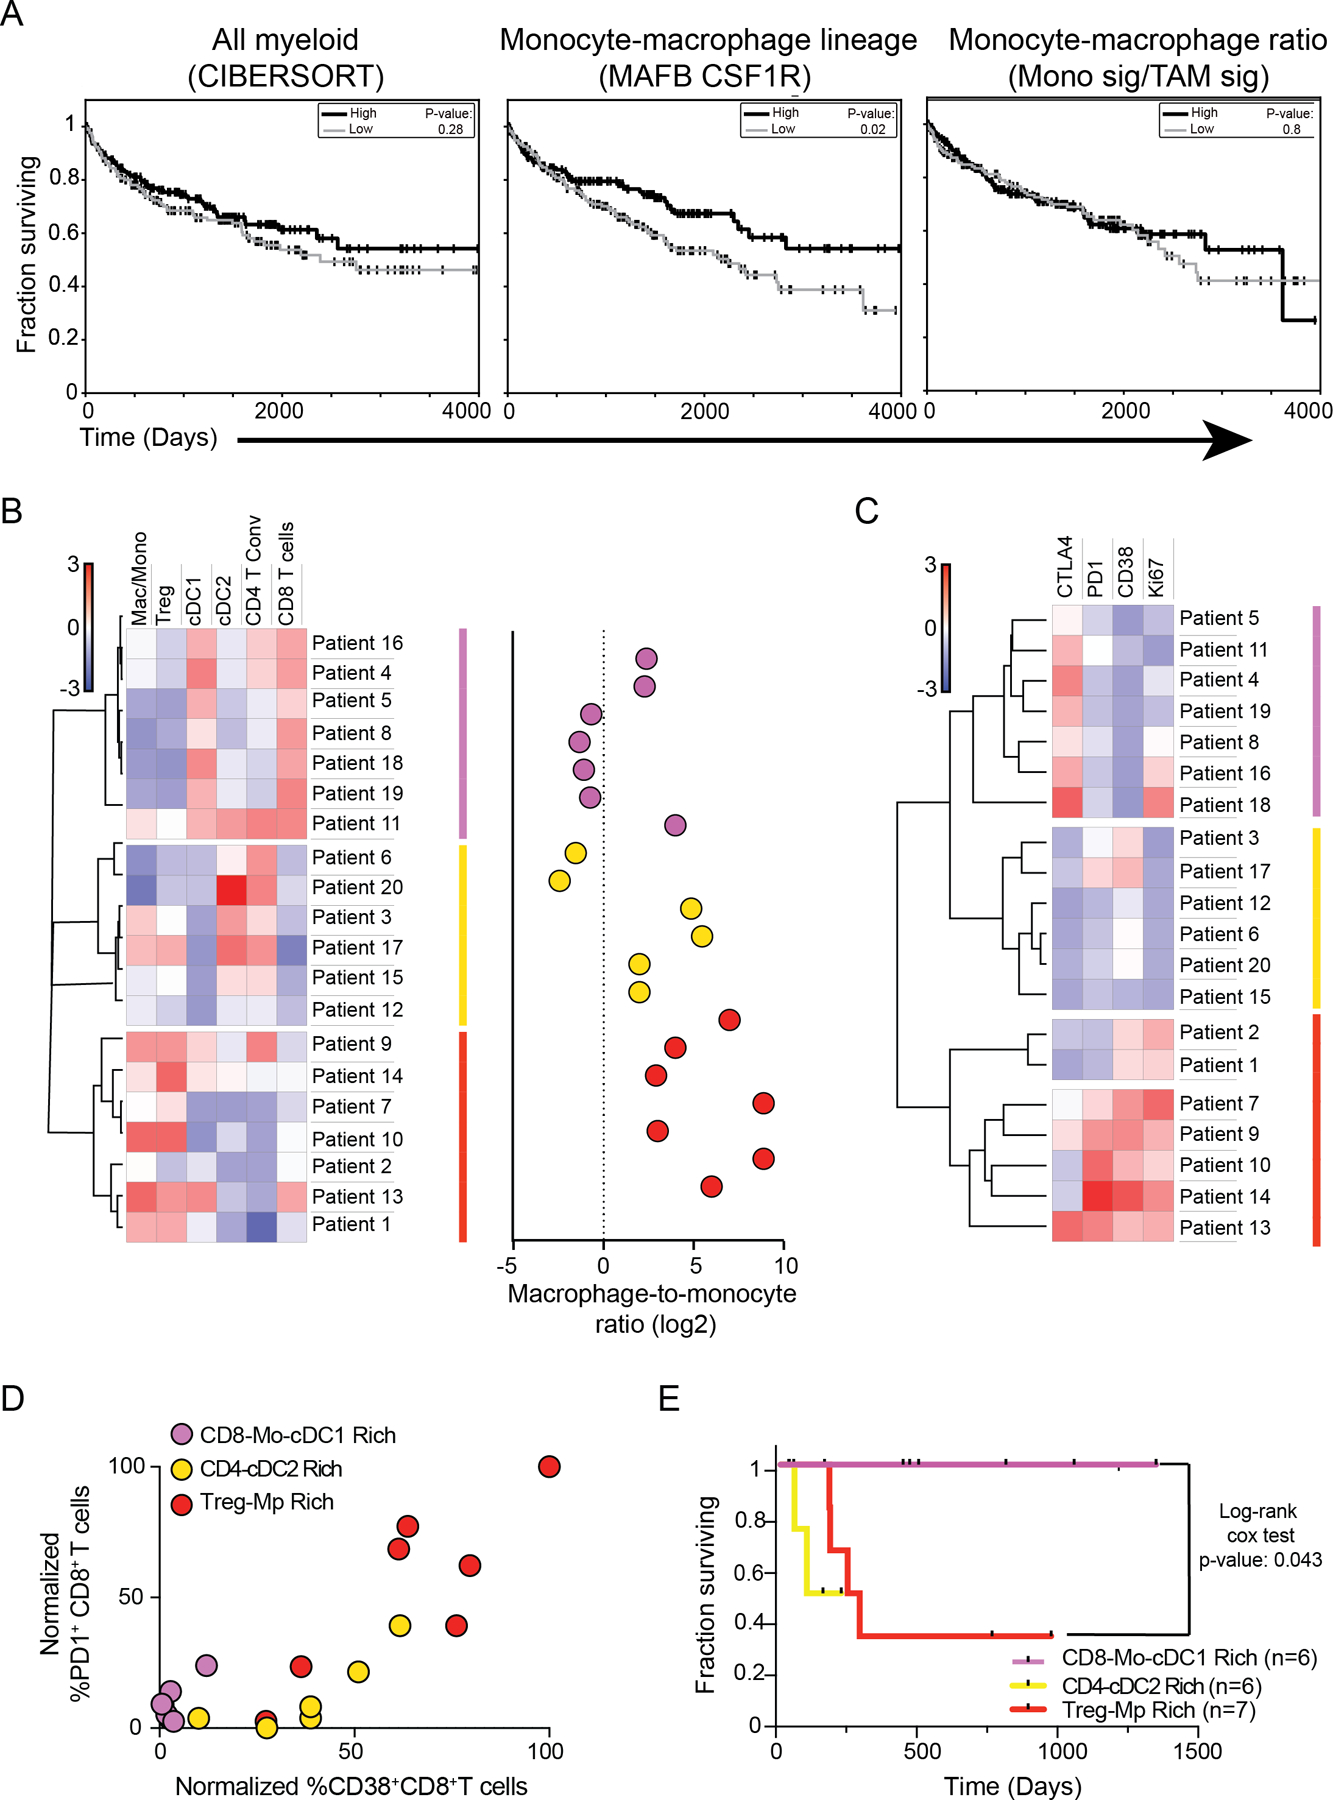
The tumor immune microenvironment (TIME) is commonly infiltrated by diverse collections of myeloid cells. Yet, the complexity of myeloid-cell identity and plasticity has challenged efforts to define bona fide populations and determine their connections to T-cell function and their relationship to patient outcome. Here, we have leveraged single-cell RNA-sequencing analysis of several mouse and human tumors and found that monocyte-macrophage diversity is characterized by a combination of conserved lineage states as well as transcriptional programs accessed along the differentiation trajectory. We also found in mouse models that tumor monocyte-to-macrophage progression was profoundly tied to regulatory T cell (Treg) abundance. In human kidney cancer, heterogeneity in macrophage accumulation and myeloid composition corresponded to variance in, not only Treg density, but also the quality of infiltrating CD8+ T cells. In this way, holistic analysis of monocyte-to-macrophage differentiation creates a framework for critically different immune states.


Figures

Figure 1.
Figure 1.. ScRNA-seq analysis of mouse B16 tumor myeloid cells maps transcriptional heterogeneity amongst monocytes and TAMs.
(A) Schematic illustration of workflow for isolation of specified myeloid cell populations from B16 tumors subcutaneously implanted in wild-type C57Bl/6 mice. (B) t-SNE plot of graph-based clustering of Ly6C+CD11b+ monocytes and Ly6CMHCII+ myeloid cells that were sorted and pooled from at least 5 B16 tumors, and underwent scRNA-seq (A). Each dot represents a single cell. (C) Expression of Csf1r (left) and Mafb (middle) on t-SNE plot of bulk myeloid cells (B), and display of selected Csf1r+Mafb+ clusters (right). (D) Expression of gene signatures specific to Ly6C+ monocyte, CD11clo TAM1, or CD11chi TAM2 populations (A, Supplementary Fig. S1F) displayed on t-SNE plot of Csf1r+Mafb+ myeloid cells (C). Cells with top median of signature expression level labeled in red. (E) Heatmap displaying expression levels of top 5 DE genes between Csf1r+Mafb+ cell clusters (C). Genes ranked by fold change. (F) Expression levels of selected genes amongst Csf1r+Mafb+ cell clusters (C). (G) Differentiation trajectory model using Monocle analysis of cells from Csf1r+Mafb+ clusters (C). Color coding corresponds to previous labels (B). (H) Graph of relative pseudotime values of Csf1r+Mafb+ cluster cells (C) from Monocle analysis (G). (I) Expression levels of cluster-specific genes (E) over relative pseudotime (H). Each line corresponds to an individual gene.
Figure 2.
Figure 2.. ScRNA-seq analysis highlights layering of microenvironment-induced programs during tumor monocyte-to-macrophage differentiation.
(A) t-SNE plot of graph-based clustering (top) of Ly6C+ monocytes sorted from B16 tumors and processed for scRNA-seq (Fig. 1A), and heatmap displaying expression levels of top 5 DE genes between clusters (bottom) with genes ranked by fold change. (B) t-SNE plot and graph-based clustering (top) of CD11chi TAMs sorted from B16 tumors and processed for scRNA-seq (Fig 1A), and heatmap displaying expression levels of top 5 DE genes between clusters (bottom) with genes ranked by fold change. (C) Stress-responsive cells (Cluster 2) from bulk B16 myeloid cells (Fig. 1B) were selected for further clustering analysis (top). Heatmap of expression levels of monocyte- and macrophage-specific genes (Fig. 1E) by Cluster 2 sub-cluster (bottom). (D) Heatmap of DE gene expression levels between Cluster 2 and Cluster 3 of bulk tumor myeloid cell sample (Fig. 1B). Genes ranked by degree of exclusivity to a given cluster (min.pct1/min.pct2). (E) Expression levels of IL7Rα and VCAM-1, as assessed by flow cytometry, of “Mono-Int” (Ly6C+CD64+) (top) and TAMs (Ly6CF4/80+CD64+) (bottom) from B16 tumors. (F) Example (left) and quantification (right) of intracellular ARG1 expression by VCAM-1+ (top) or IL7rα+ (bottom) TAMs from B16 tumors using flow cytometry. ARG1+ gating determined by isotype control. Data are representative of 2 independent experiments with 3–5 mice per experiment (mean ± SEM). (G) Expression levels of selected genes along differentiated trajectory generated by Monocle (Fig. 1G). (H) Schematic model of tumor monocyte-to-macrophage differentiation that integrates lineage-associated and microenvironmentally-induced transcriptional programs.
Figure 3.
Figure 3.. B16 and PyMT tumor monocyte–macrophage heterogeneity can be attributed to diversity in transcriptional and metabolic programs, but not “M1/M2” polarization.
(A) Heatmap (left) and density plot (right) of Pearson r coefficient scores between “M1”- and “M2”-associated gene expression levels within Csf1r+Mafb+ cells from B16 tumors (Fig. 1C). (B) t-SNE plot of Csf1r+Mafb+ clusters from B16 tumors (top; Fig. 1C) with expression levels of “M1” (bottom, left) and “M2” (bottom, right) gene signatures (A) displayed. Cells with top median of signature expression level labeled in red. (C) t-SNE plot and graph-based clustering of Csf1r+Mafb+ clusters of myeloid cells that were sorted from 1 PyMT tumor and processed for scRNA-seq in an independent experiment (top; Supplementary Fig. 3B). Expression levels of “M1” (bottom, left) and “M2” (bottom, right) gene signatures (A) displayed. Cells with top 70 percentile of signature expression level labeled in red. (D) Expression levels of glycolysis (left) and oxidative phosphorylation (“OxPhos”) (right) gene signatures (Supplementary Fig. 3F) displayed on t-SNE plot of Csf1r+Mafb+ clusters from B16 tumors (Fig. 1C). Cells with top 70 percentile of signature expression level labeled in red. (E) Expression levels of glycolysis (left) and oxidative phosphorylation (“OxPhos”) (right) gene signatures (Supplementary Fig. 3F) displayed on t-SNE plot of Csf1r+Mafb+ clusters from PyMT tumors (C). Cells with top 70 percentile of signature expression level labeled in red.
Figure 4.
Figure 4.. Human RCC and mouse tumor myeloid cell compartments exhibit shared transcriptional features.
(A) Schematic of the 1 human RCC, 6 melanomas, and 4 head and neck biopsy samples processed for scRNAseq analysis. (B) UMAP plot of graph-based clustering of bulk myeloid (LinHLA-DR+) cells sorted from human biopsy samples (A). (C) Gene expression levels of CSF1R (left) and MAFB (right) displayed on UMAP plot of human tumor-infiltrating myeloid cells (B). (D) UMAP plot of graph-based clustering of CSF1R+MAFB+ cells (C) with cells from all human biopsy samples (left) or specified cancer type (right) displayed. (E) Expression levels of selected genes (CD14, FCGR3A, CD68) or gene signature (MHC-II-associated genes) displayed on t-SNE plot of CSF1R+MAFB+ clusters (C). (F) Expression of selected genes expressed by CSF1R+MAFB+ clusters (C). (G) Differentiation trajectory model generated by Monocle analysis of CSF1R+MAFB+ clusters (C). (H) Relative pseudotime values of early-stage CD14+ monocytes, CD14+ “Mono-Int”, C1Q+ TAMs, IFN-responsive cells, and stress-response TAM clusters (C) from Monocle analysis (G). (I) Expression levels of glycolysis-associated gene signature by cells in stress-responsive and C1Q+ TAM cells (B).
Figure 5.
Figure 5.. Immunosuppressive Treg cells promote tumor monocyte-to-macrophage differentiation.
(A) 20 human RCC biopsies were measured and processed for flow cytometric analysis. The ratio of macrophage-to-monocyte (log2) cell numbers (top) and Treg frequency amongst CD45+ cells (bottom) were quantified. Samples were acquired and pooled for analysis. *p<0.05, Kruskal Wallis rank test. Dashed lines represent the median and dotted lines represent 25th percentile and 75th percentile. (B) Dot plot and Spearman’s correlation coefficient of macrophage-to-monocyte cell number ratio (log2) and Treg frequency within CD45+ cells in 20 human RCC (top) and 16 melanoma (bottom) biopsies that were analyzed by flow cytometry. Samples were acquired and pooled for analysis. (C) Quantification of the ratio between macrophages (Ly6CF4/80+CD64+) and monocytes (Ly6C+CD11b+) cell number ratio in B16 tumors of DT-treated control and Foxp3-DTR mice (top), or of wild-type mice treated with depleting anti-CTLA-4 (IgG2c clone) or isotype antibody (bottom). Data is representative of at least 2 independent experiments with 3–9 mice per group per experiment (mean ± SEM). **p <0.01, ****p<0.0001, unpaired t-test. (D) t-SNE plot of graph-based clustering (top) of B16-infiltrating Csf1r+Mafb+ cells from wildtype mice (Fig. 1) which were aggregated with DT-treated control and Foxp3-DTR mice (Supplementary Fig. 5D) from a second independent experiment in which tumors from at least 5 mice were pooled. Cell numbers in specified clusters were quantified (bottom). (E) Differentiation trajectory model generated from Monocle analysis (top) and relative pseudotime values (bottom) of Csf1r+Mafb+ cluster cells from B16 tumors from DT-treated control (left) and FoxP3-DTR mice (right). (F) Volcano plot displaying DE genes between B16 tumor “Mono-Int” (top) and C1qa+ TAM (bottom) cluster cells from DT-treated control and FoxP3-DTR mice (D). Genes with > 0.4 log-fold changes and an adjusted p value of 0.05 (based on Bonferroni correction) are highlighted in red. Genes of interest labeled. (G) Expression of selected monocyte-associated genes displayed on the differentiation trajectory (E) of control (top) or Foxp3-DTR (bottom) B16 tumor-infiltrating Csf1r+Mafb+ cells. (H) Expression of selected macrophage-associated genes displayed on the differentiation trajectory (E) of control (top) or Foxp3-DTR (bottom) B16 tumor-infiltrating Csf1r+Mafb+ cells.
Figure 6.
Figure 6.. Multiparametric analysis of tumor myeloid composition identifies kidney cancer patients with effector CD8+ T-cell responses and improved survival rates.
(A) Survival curves of kidney tumor patients whose TCGA tumor samples exhibited high (33%) or low (33%) levels of expression levels of pan-myeloid cell gene signatures derived from CIBERSORT (left), MAFB and CSF1R (middle), or ratio of monocyte-to-TAM gene signatures (Fig. 4) (right), analyzed with log-rank test. (B) Heatmap of specified immune cell population frequencies (left) and the ratio of macrophage-to-monocytes (right) detected in 20 human kidney tumor samples by flow cytometry. (C) Heatmap of specified surface receptor or Ki-67 expression frequencies amongst CD8+ T cells from 20 human kidney tumor samples that were analyzed with flow cytometry. (D) Quantification of the frequency of CD8+ T cells from 20 human tumor kidney samples that are PD1+ or CD38+. Labeling of dots corresponds to patient groups (B,C). (E) Survival curves of kidney cancer patients in cohort analyzed with log-rank test (B-D).

References

    1. Wculek SK, Cueto FJ, Mujal AM, Melero I, Krummel MF, Sancho D. Dendritic cells in cancer immunology and immunotherapy. Nat Rev Immunol. 2020;20:7–24. - PubMed
    1. DeNardo DG, Ruffell B. Macrophages as regulators of tumour immunity and immunotherapy. Nat Rev Immunol. 2019;19:369–82. - PMC - PubMed
    1. Ginhoux F, Guilliams M. Tissue-Resident Macrophage Ontogeny and Homeostasis. Immunity. 2016;44:439–49. - PubMed
    1. Franklin RA, Liao W, Sarkar A, Kim MV, Bivona MR, Liu K, et al. The cellular and molecular origin of tumor-associated macrophages. Science. 2014;344:921–925. - PMC - PubMed
    1. Arwert EN, Harney AS, Entenberg D, Wang Y, Sahai E, Pollard JW, et al. A Unidirectional Transition from Migratory to Perivascular Macrophage Is Required for Tumor Cell Intravasation. Cell Reports. 2018;23:1239–48. - PMC - PubMed

Publication types