. 2022 Jul 21;31(14):2406-2423.
doi: 10.1093/hmg/ddac043.

Choroidal endothelial and macrophage gene expression in atrophic and neovascular macular degeneration

Affiliations

Choroidal endothelial and macrophage gene expression in atrophic and neovascular macular degeneration

Andrew P Voigt et al. Hum Mol Genet. .

Abstract

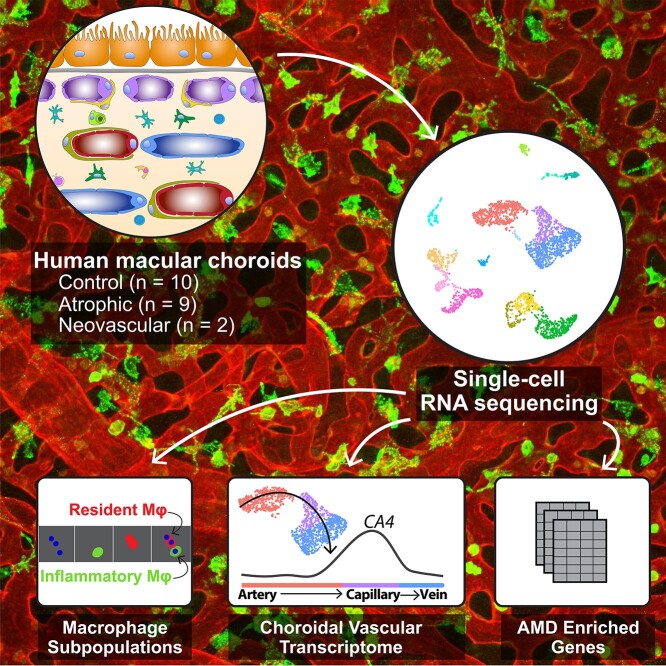
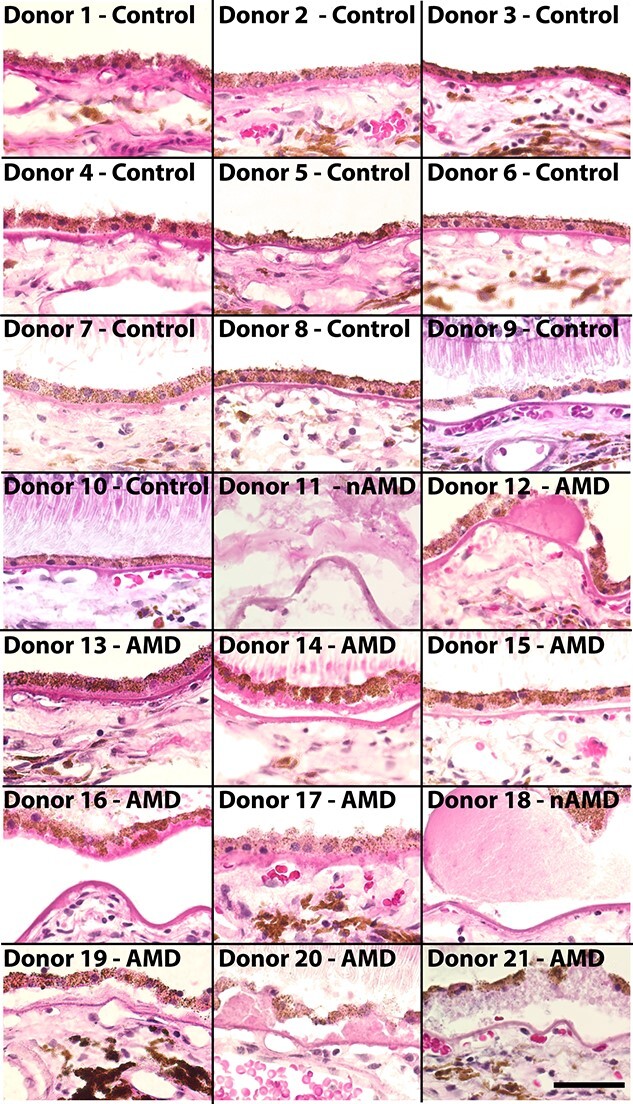
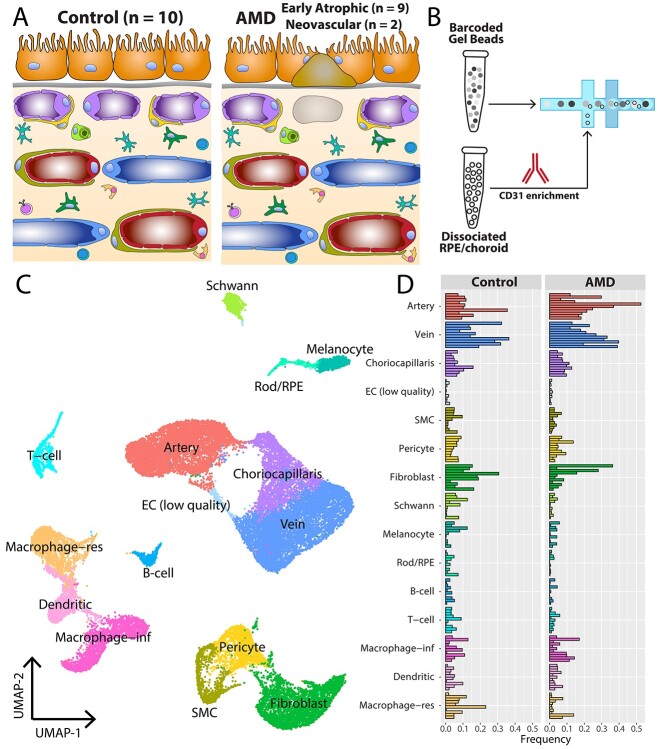
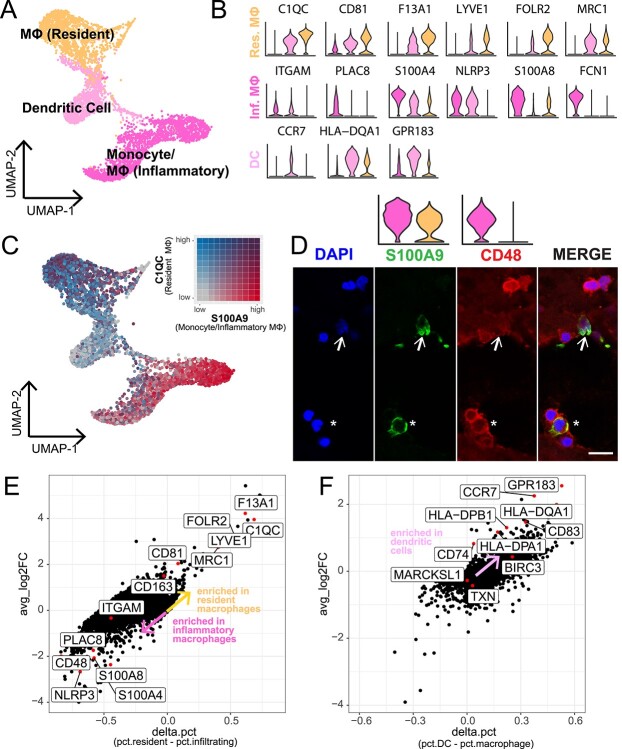
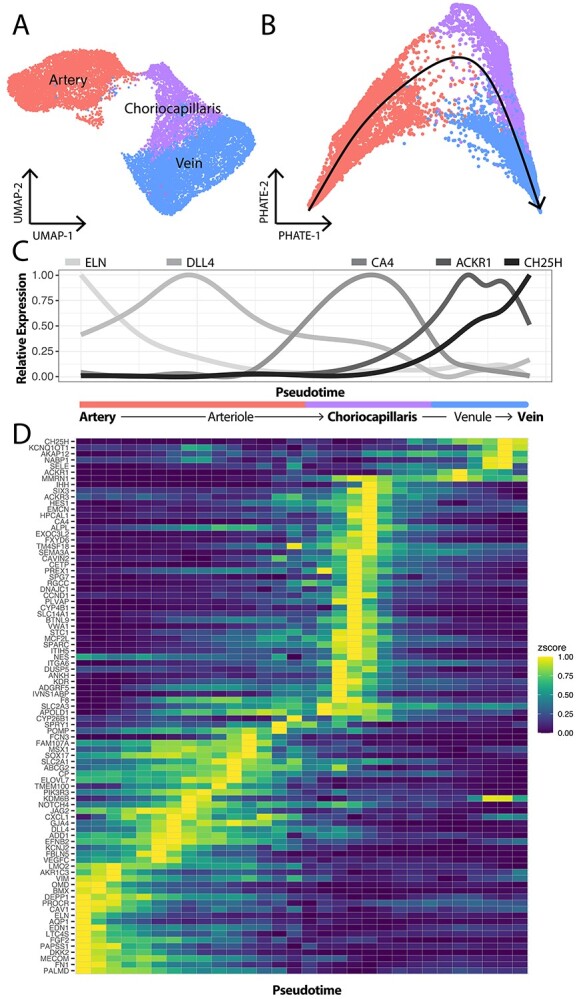
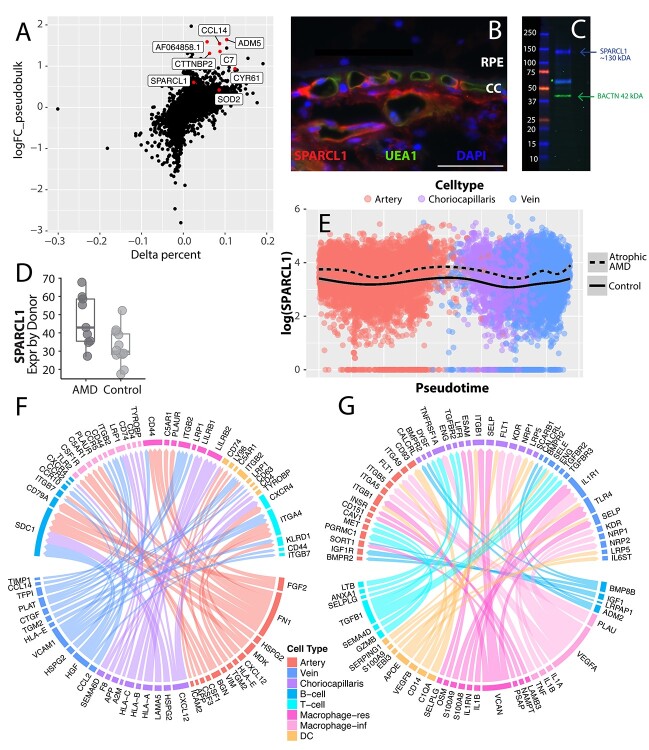
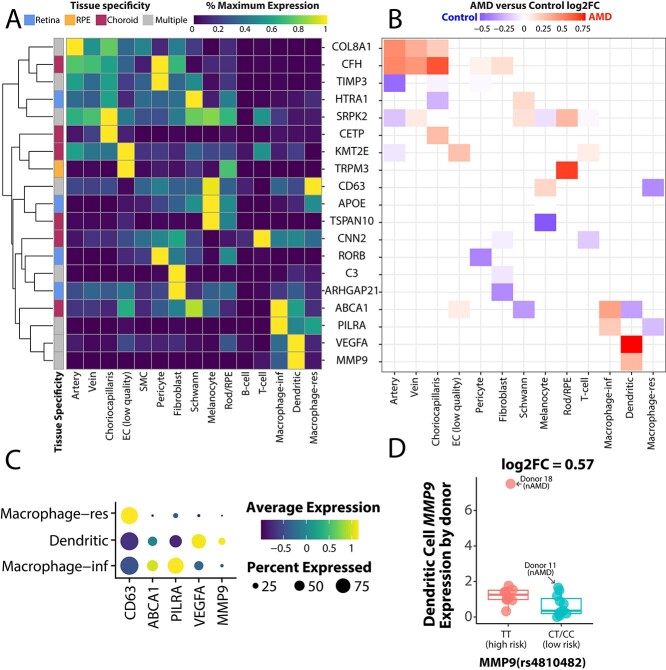
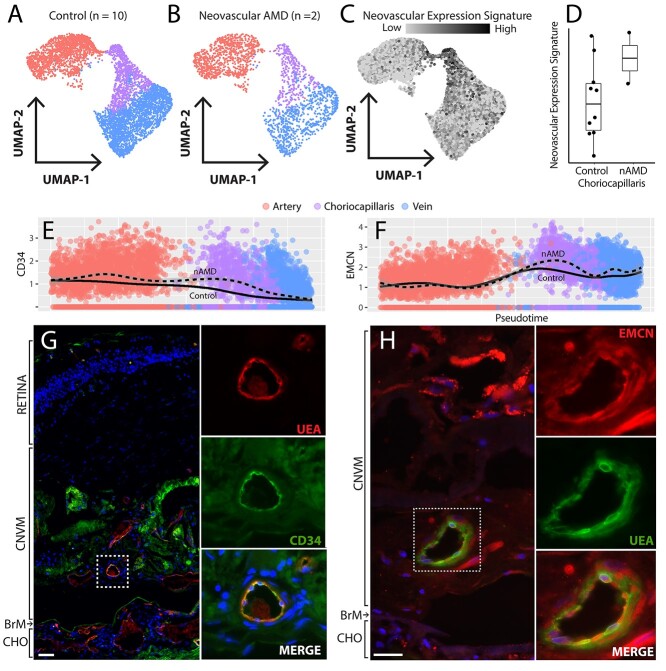
The human choroid is a heterogeneous, highly vascular connective tissue that dysfunctions in age-related macular degeneration (AMD). In this study, we performed single-cell RNA sequencing on 21 human choroids, 11 of which were derived from donors with early atrophic or neovascular AMD. Using this large donor cohort, we identified new gene expression signatures and immunohistochemically characterized discrete populations of resident macrophages, monocytes/inflammatory macrophages and dendritic cells. These three immune populations demonstrated unique expression patterns for AMD genetic risk factors, with dendritic cells possessing the highest expression of the neovascular AMD-associated MMP9 gene. Additionally, we performed trajectory analysis to model transcriptomic changes across the choroidal vasculature, and we identified expression signatures for endothelial cells from choroidal arterioles and venules. Finally, we performed differential expression analysis between control, early atrophic AMD, and neovascular AMD samples, and we observed that early atrophic AMD samples had high expression of SPARCL1, a gene that has been shown to increase in response to endothelial damage. Likewise, neovascular endothelial cells harbored gene expression changes consistent with endothelial cell damage and demonstrated increased expression of the sialomucins CD34 and ENCM, which were also observed at the protein level within neovascular membranes. Overall, this study characterizes the molecular features of new populations of choroidal endothelial cells and mononuclear phagocytes in a large cohort of AMD and control human donors.


Figures

None
Graphical abstract
Figure 1
Figure 1
Hematoxylin and eosin staining of human donor eyes. Images from the submacular choroid of control donors (donors 1–10) versus AMD donors (donors 11–21). Donor 11 was diagnosed with neovascular AMD OU, and a neovascular membrane is shown. Donor 18 was diagnosed with neovascular AMD in OS (the eye used for scRNA-seq) while the histological image (large confluent drusen) was acquired from OD. All other AMD donors had histological evidence of early atrophic AMD. Scalebar (donor 21) = 50 μm. OS = oculus sinister (left eye); OD = oculus dexter (right eye); OU = oculus uterque (both eyes).
Figure 2
Figure 2
scRNA-seq experiment design. (A) Cartoon of the submacular RPE/choroid in health (left) and AMD (right). (B) After dissociation and cryopreservation, cell suspensions from the 21 donors were thawed before anti-CD31 (PECAM1) magnetic enrichment. CD31-enriched fractions from each donor underwent scRNA-seq. (C) Uniform manifold approximation and projection (UMAP) dimensionality reduction of the 30 416 recovered cells. Cell clusters were classified into cell types based on previously published expression profiles (Supplementary Material, Fig. S1). (D) Comparison of recovered cells from control and AMD samples. Each bar represents the proportion of recovered cells for one donor. SMC = smooth muscle cell. EC = endothelial cell. RPE = retinal pigment epithelium. Macrophage-res = resident macrophage. Macrophage-inf = inflammatory macrophage/monocyte.
Figure 3
Figure 3
Characterization of multiple mononuclear phagocyte cell populations in the human choroid. (A) Three clusters of mononuclear phagocytes were identified in the scRNA-seq study. (B) Violin plots show the expression of genes previously reported to localize to resident macrophages (orange), monocytes/inflammatory macrophages (dark pink) and dendritic cells (light pink). (C) Expression of C1QC (a marker for tissue-resident macrophages, colored grey-to-blue) and S100A8 (a marker for monocytes/inflammatory macrophages, colored grey-to-red) are colored on a bivariate color scale. The two populations are largely distinct. (D) Immunohistochemical labeling of CD48 (a gene expressed by monocytes/inflammatory macrophages) and S100A8/9 (expressed by both resident macrophages and monocytes/inflammatory macrophages) in the human choroidal stroma. Asterisks indicate cells that co-express CD48 and S100A9 and represent monocytes/inflammatory macrophages. Arrows indicate cells that express S100A9 but do not express CD48, representing resident macrophages. Overlying violin plots highlight gene expression of S100A9 and CD48 across the two macrophage populations. Scalebar = 10 μm. (E) Differential expression was completed between the resident macrophage versus the monocyte/inflammatory macrophage clusters. Each dot represents the differential expression results for one gene. Labeled genes have been previously reported to be enriched in resident or inflammatory macrophages. (F) Like (E), differential expression was performed between the dendritic cell cluster versus both macrophage clusters. Labeled genes have been previously reported to be enriched in dendritic cells from other tissues.
Figure 4
Figure 4
Trajectory analysis recapitulates the anatomic structure of the choroidal vascular tree. (A) Three distinct endothelial clusters (arteries, choriocapillaris and veins) were identified by scRNA-seq. (B) The PHATE dimensionality reduction method was applied to the endothelial expression data to better visualize progression from one cell state to another. Trajectory analysis was performed using slingshot (black line) to model expression changes from arteries to capillaries to veins. (C) Expression changes of five genes were visualized across this trajectory. The pseudotime trajectory is visualized along the x-axis; values on the left correspond to cells mapped to the arterial end of the trajectory while values on the right correspond to cells from the venous end. Previously reported arteriole (DLL4)- and venule (ACKR1)-specific genes demonstrated maximal expression at the artery–choriocapillaris and choriocapillaris–vein interface. (D) Differential expression was performed to identify genes enriched in arteries, arterioles, choriocapillaris, venules and veins. The expression of each gene was scaled from zero (dark blue) to one (yellow) and expression was visualized across pseudotime (x-axis) in a heatmap.
Figure 5
Figure 5
Genes enriched in early atrophic AMD endothelial cells. (A) Differential expression between early atrophic AMD (n = 9) and control (n = 10) choriocapillaris endothelial cells. The y-axis depicts a (pseudobulk) log-fold change, with positive values reflecting increased expression in early atrophic AMD donors (see Materials and Methods). The x-axis depicts a variable termed delta percentage, which is calculated by: (percentage of AMD cells that express the gene) − (percentage of control cells that express the gene). Genes with a positive delta percentage are expressed by a higher proportion of AMD cells. (B) SPARCL1 (red) labels the choroidal endothelial cells, including the choriocapillaris, of a human donor choroid. The endothelial-specific lectin UEA-1 (green) co-labels choroidal endothelial cells. (C) A western blot of protein isolated from the human choroid. A SPARCL1 band is visible at the molecular weight of 130 kDa (40) in addition to a smaller, possibly proteolytic fragment ~60 kDa (41). (D) Comparison of SPARCL1 choriocapillaris expression between early atrophic AMD and control donors. The average SPARCL1 expression is depicted on a donor-by-donor basis (each dot represents the average SPARCL1 expression of one donor). (E) SPARCL1 expression is compared across pseudotime (see Fig. 4) stratified by AMD status. There is an increase in SPARCL1 expression across the choroidal vascular tree in early atrophic AMD. (F, G) Ligand–receptor interactions are visualized between endothelial and immune subpopulations. Ligand–receptor pairs are only visualized if at least one member of the pair is enriched in early atrophic AMD cells above a (pseudobulk) log-fold change of 0.5. In (F), endothelial-expressed ligands are visualized with their immune cell targets. In (G), immune-expressed ligands are visualized with their endothelial targets.
Figure 6
Figure 6
Expression of AMD risk genes in the choroid. (A) A heatmap depicts cell-specific expression patterns of genes with AMD-associated genetic variants (46). Each gene is classified as expressed mostly in the retina, RPE, choroid or in multiple tissues (see Materials and Methods). For each gene, we scale expression according to this value from 0% to 100% of the maximally expressing cell type. (B) For all genes in (A), we compare expression between AMD and control cells. (C) A dot plot depicts the relative expression level (blue-to-yellow gradient) and percentage of expressing cells (circle size) of five genes maximally expressed by mononuclear phagocytes. (D) MMP9 expression was compared between donors genotyped at the rs4810482 SNP, which is associated with neovascular AMD. Each dot represents the average MMP9 expression of one donor.
Figure 7
Figure 7
Genes enriched in neovascular AMD endothelial cells. Choroidal endothelial cells (arteries = red, choriocapillaris = purple, veins = blue) from the 10 control donors (A) and the two neovascular AMD donors (B). (C) A neovascular expression signature was created by analyzing the top 50 upregulated genes in a laser injury model of choroidal endothelial cells (18). This expression signature was applied to endothelial cells in the current study, and choriocapillaris endothelial cells most highly expressed these signature genes. (D) The average neovascular expression score was computed between control and nAMD donors. (E, F) CD34 (E) and EMCN (F) expression was higher across the choroidal vascular tree in nAMD donors (dashed line). (G, H) CD34 (G) and EMCN (F) are expressed at the protein level in neovascular membranes in an independent CNV donor cohort. Scale bars = 50 μm.

References

    1. Nickla, D.L. and Wallman, J. (2010) The multifunctional choroid. Prog. Retin. Eye Res., 29, 144–168. - PMC - PubMed
    1. Nakanishi, M., Grebe, R., Bhutto, I.A., Edwards, M., McLeod, D.S. and Lutty, G.A. (2016) Albumen transport to Bruch's membrane and RPE by choriocapillaris caveolae. Invest. Ophthalmol. Vis. Sci., 57, 2213–2224. - PMC - PubMed
    1. Hayreh, S.S. (1974) Vascular pattern of the choriocapillaris. Exp. Eye Res., 19, 101–104. - PubMed
    1. Biesemeier, A., Taubitz, T., Julien, S., Yoeruek, E. and Schraermeyer, U. (2014) Choriocapillaris breakdown precedes retinal degeneration in age-related macular degeneration. Neurobiol. Aging, 35, 2562–2573. - PubMed
    1. Mullins, R.F., Johnson, M.N., Faidley, E.A., Skeie, J.M. and Huang, J. (2011) Choriocapillaris vascular dropout related to density of drusen in human eyes with early age-related macular degeneration. Invest. Ophthalmol. Vis. Sci., 52, 1606–1612. - PMC - PubMed

Publication types

Substances