

BHLHE40 Regulates the T-Cell Effector Function Required for Tumor Microenvironment Remodeling and Immune Checkpoint Therapy Efficacy
- PMID: 35181783
- PMCID: PMC9164498
- DOI: 10.1158/2326-6066.CIR-21-0129
BHLHE40 Regulates the T-Cell Effector Function Required for Tumor Microenvironment Remodeling and Immune Checkpoint Therapy Efficacy
Abstract
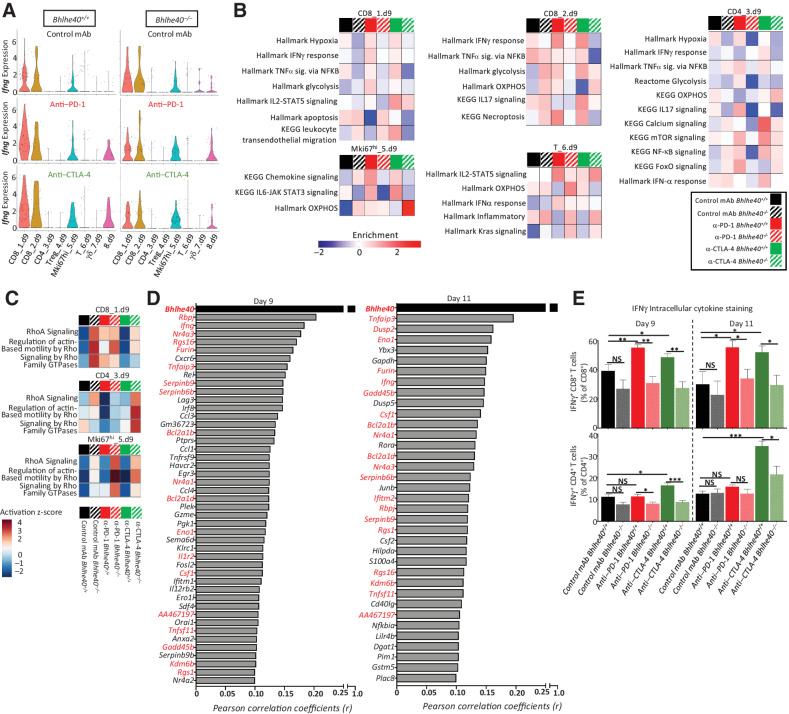
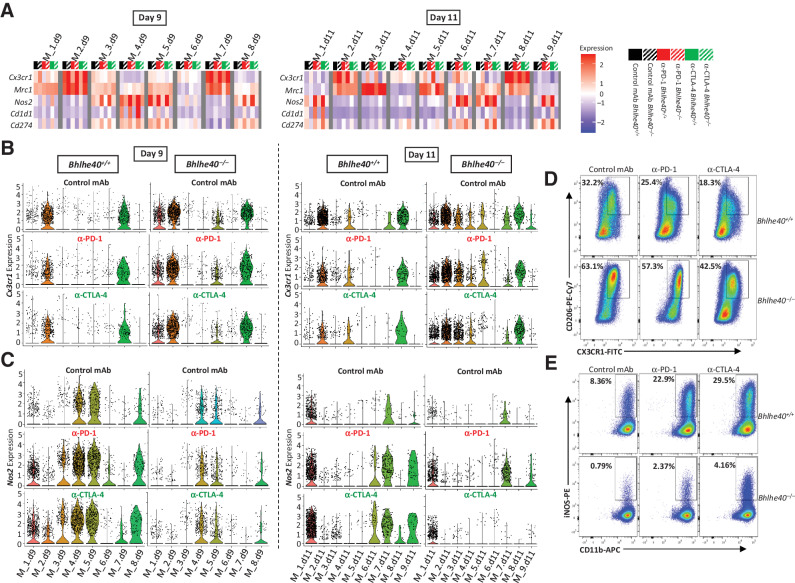
Immune checkpoint therapy (ICT) using antibody blockade of programmed cell death protein 1 (PD-1) or cytotoxic T-lymphocyte-associated protein 4 (CTLA-4) can provoke T cell-dependent antitumor activity that generates durable clinical responses in some patients. The epigenetic and transcriptional features that T cells require for efficacious ICT remain to be fully elucidated. Herein, we report that anti-PD-1 and anti-CTLA-4 ICT induce upregulation of the transcription factor BHLHE40 in tumor antigen-specific CD8+ and CD4+ T cells and that T cells require BHLHE40 for effective ICT in mice bearing immune-edited tumors. Single-cell RNA sequencing of intratumoral immune cells in BHLHE40-deficient mice revealed differential ICT-induced immune cell remodeling. The BHLHE40-dependent gene expression changes indicated dysregulated metabolism, NF-κB signaling, and IFNγ response within certain subpopulations of CD4+ and CD8+ T cells. Intratumoral CD4+ and CD8+ T cells from BHLHE40-deficient mice exhibited higher expression of the inhibitory receptor gene Tigit and displayed alterations in expression of genes encoding chemokines/chemokine receptors and granzyme family members. Mice lacking BHLHE40 had reduced ICT-driven IFNγ production by CD4+ and CD8+ T cells and defects in ICT-induced remodeling of macrophages from a CX3CR1+CD206+ subpopulation to an iNOS+ subpopulation that is typically observed during effective ICT. Although both anti-PD-1 and anti-CTLA-4 ICT in BHLHE40-deficient mice led to the same outcome-tumor outgrowth-several BHLHE40-dependent alterations were specific to the ICT that was used. Our results reveal a crucial role for BHLHE40 in effective ICT and suggest that BHLHE40 may be a predictive or prognostic biomarker for ICT efficacy and a potential therapeutic target.
©2022 The Authors; Published by the American Association for Cancer Research.
Figures
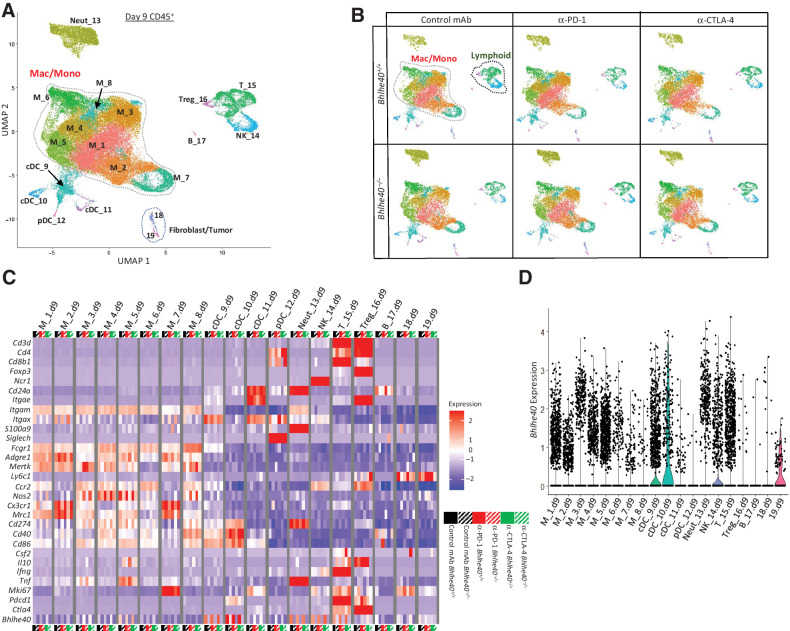
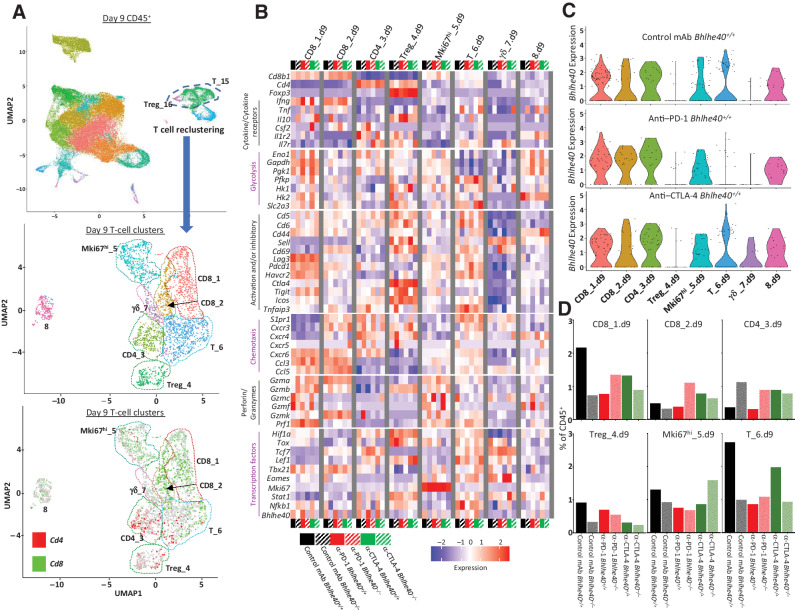
![Figure 1. Subsets of intratumoral myeloid and lymphoid cells express Bhlhe40. A, Bhlhe40 mRNA expression in intratumoral mLama4-specific CD8+ T cells sorted from T3 sarcoma–bearing WT mice treated with anti–CTLA-4, anti–PD-1, or both anti–CTLA-4 and anti–PD-1. B, tSNE plot from merged treatment data of exclusively intratumoral lymphocytes showing Bhlhe40 expression within indicated lymphoid subpopulations identified by scRNAseq in the T3 MCA sarcoma. C, Violin plots showing Bhlhe40 expression in T3 intratumoral lymphoid cells by cluster and treatment. D, Heatmap displaying normalized expression of select genes in T3 intratumoral lymphoid cells by cluster and treatment. E, Tumor growth in Bhlhe40–/– or Bhlhe40+/+ mice transplanted with 1956 sarcoma cells and subsequently treated with control, anti–CTLA-4, anti–PD-1, or both anti–CTLA-4 and anti–PD-1 on days 3, 6, and 9 post-transplant. F, Cumulative Kaplan–Meier survival curves for the 1956 tumor–bearing Bhlhe40–/– or Bhlhe40+/+ mice treated as in E. For A, each dot represents 5 pooled mice harvested on day 11 posttransplant and assessed independently (N = 3; *, P < 0.05, unpaired t test). B–D, scRNAseq data generated in Gubin et al (39) were reanalyzed for Bhlhe40 expression. Data in E are presented as average tumor diameter ± SEM of 5 mice per group and are representative of at least four independent experiments. Data in (F) are cumulative survival curves from 4 independent experiments of 3–5 mice per group [***, P < 0.001 (log-rank (Mantel–Cox) test)].](https://cdn.ncbi.nlm.nih.gov/pmc/blobs/3953/9381123/80fbdb6552f9/597fig1.jpg)
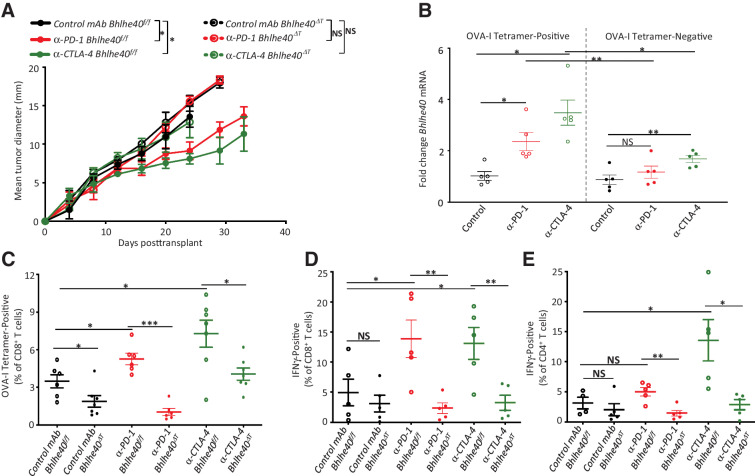
![Figure 2. Bhlhe40 is selectively required in T cells for anti–PD-1 or anti–CTLA-4 ICT-mediated tumor rejection. A, Tumor growth in Bhlhe40ΔT or Bhlhe40f/f mice transplanted with 1956 sarcoma cells and subsequently treated with control mAb, anti–CTLA-4, or anti–PD-1 on days 3, 6, and 9 posttransplant. B, Cumulative Kaplan–Meier survival curves of 1956 tumor–bearing Bhlhe40ΔT or Bhlhe40f/f mice treated as in A. Bhlhe40 mRNA expression in intratumoral PD-1+LAG-3+CD8+ T cells (C) and PD-1+LAG-3+CD4+ T cells (D) sorted on day 11 posttransplant from 1956 sarcoma–bearing WT mice treated with control mAb, anti–CTLA-4, or anti–PD-1. Bhlhe40 mRNA expression in CD8+ OT-I T cells (E) stimulated with 1 μmol/L OVA-I peptide and CD4+ OT-II T cells (F) stimulated with 1 μmol/L OVA-II peptide for the indicated time. Data in A are presented as average tumor diameter ± SEM of 5–6 mice per group and are representative of 3 independent experiments. Data in B are cumulative survival curves from 3 independent experiments of 4–6 mice per group [***, P < 0.001; NS, not significant, (log-rank (Mantel–Cox) test)]. For C and D, each dot represents mice harvested and assessed independently (N = 5; *, P < 0.05; **, P < 0.01, unpaired t test). Data in E, and F are presented as mean mRNA fold change. Bar indicates mean ± SEM (*, P < 0.05; **, P < 0.01, unpaired t test) and are representative of 3 independent experiments.](https://cdn.ncbi.nlm.nih.gov/pmc/blobs/3953/9381123/476fd44a7722/597fig2.jpg)
References
-
- Coulie PG, Van den Eynde BJ, van der Bruggen P, Boon T. Tumour antigens recognized by T lymphocytes: at the core of cancer immunotherapy. Nat Rev Cancer 2014;14:135–46. - PubMed
Publication types
MeSH terms
Substances
Grants and funding
LinkOut - more resources
Full Text Sources
Medical
Molecular Biology Databases
Research Materials
