. 2022 Mar 3;185(5):794-814.e30.
doi: 10.1016/j.cell.2022.01.021. Epub 2022 Feb 18.

Transcription factor protein interactomes reveal genetic determinants in heart disease

Affiliations

Transcription factor protein interactomes reveal genetic determinants in heart disease

Barbara Gonzalez-Teran et al. Cell. .

Abstract

Congenital heart disease (CHD) is present in 1% of live births, yet identification of causal mutations remains challenging. We hypothesized that genetic determinants for CHDs may lie in the protein interactomes of transcription factors whose mutations cause CHDs. Defining the interactomes of two transcription factors haplo-insufficient in CHD, GATA4 and TBX5, within human cardiac progenitors, and integrating the results with nearly 9,000 exomes from proband-parent trios revealed an enrichment of de novo missense variants associated with CHD within the interactomes. Scoring variants of interactome members based on residue, gene, and proband features identified likely CHD-causing genes, including the epigenetic reader GLYR1. GLYR1 and GATA4 widely co-occupied and co-activated cardiac developmental genes, and the identified GLYR1 missense variant disrupted interaction with GATA4, impairing in vitro and in vivo function in mice. This integrative proteomic and genetic approach provides a framework for prioritizing and interrogating genetic variants in heart disease.

Keywords: GATA4; GLYR1; NPAC; TBX5; congenital heart disease; de novo variants; disease variants; genetics; protein interactome networks.


Conflict of interest statement

Declaration of interests D.S. is scientific co-founder, shareholder, and director of Tenaya Therapeutics. B.G.B. and B.R.C. are scientific co-founders and shareholders of Tenaya Therapeutics. K.S.P. is a shareholder of Tenaya Therapeutics. N.J.K. has received research support from Vir Biotechnology and F. Hoffmann-La Roche. N.J.K. has consulting agreements with the Icahn School of Medicine at Mount Sinai, New York, Maze Therapeutics, and Interline Therapeutics; is a shareholder of Tenaya Therapeutics, Maze Therapeutics, and Interline Therapeutics; and is financially compensated by GEn1E Lifesciences, Inc. and Twist Bioscience Corp.

Figures

Figure 1:
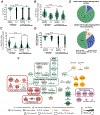
Figure 1:. Generation of GATA4 and TBX5 protein interactomes in human iPSC-derived cardiac progenitors.
See also Figure S1, S2 and Table S1A-D. (A) GATA4 and TBX5 AP-MS strategy from hiPSC-derived cardiac progenitors with gene knockout lines as negative controls. (B) GATA4 and (C) TBX5 interacting protein categories with boxed areas proportional to the number of interactors in each. Proteins interacting with both GATA4 and TBX5 (blue) or previously reported interactors (red) are highlighted. (D) Distribution of GATA4 and TBX5 PPIs in biological processes, as annotated in panels B & C. (E) Tissue expression distribution of GATA4 and TBX5 interactors across the six Human Protein Atlas categories based on transcript detection (NX≥1) in all 37 analyzed tissues (See Methods).
Figure 2:
Figure 2:. Enrichment of de novo variants in CHD trios among GATA4 and TBX5 interactome proteins.
See also Figure S3 and Table S1E-I. (A) Permutation-based statistical test design to analyze enrichment in genetic variants from a CHD cohort relative to a control cohort in GATA4 or TBX5 PPIs (odds ratio, OR), (see STAR Methods: Permutation-based test). (B) Results of permutation-based test in (A) for genomic variation indicated from PCGC CHD and control cohorts within the GATA4 or TBX5 interactomes in cardiac progenitors (CP Interactome), or after removing proteins involved in human or mouse cardiac malformations (CP Interactome Heart Dev. Unknown) (See Table S1F). The same analysis shown for HEK293s (HEK293 Interactome). (C) Violin Plot for the Combined Annotation-Dependent Depletion (CADD) scores of Protein-altering or Synonymous (Syn) variants found in the CHD cohort affecting proteins within the GT-PPI or proteins outside the interactome. White dot = median; black lines = interquartile range (thick) or 1.5x the interquartile range (thin). Two-sided Mann-Whitney-Wilcoxon test with Bonferroni correction for P-values; ***p-value<0.001.
Figure 3:
Figure 3:. De novo variants in GATA4 and TBX5 interactomes exhibit features typical of disease genes.
See also Figure S3 and Table S1J and 1K. (A-D) Violin plots for the distribution of (A) Intolerance to LoF (pLI Score); (B) degree of connectivity with all protein-altering DNVs found in the CHD cohort; (C) degree of connectivity with proteins encoded by genes involved in mouse/human cardiac malformations (Jin et al., 2017); (D) expression percentile rank in the developing heart (E14.5) for genes harboring synonymous (Syn) or protein-altering DNVs found in the CHD cohort and affecting proteins inside the GT interactome (GT-PPI) or outside the interactome (Non-Interactome). White dot = median, black lines = interquartile range (thick) and 1.5x the interquartile range (thin). Two-sided Mann-Whitney-Wilcoxon test with Bonferroni correction for P-values; ***p-value<0.001, **p-value<0.01, *p-value<0.05 and ns: non-significant. (E) Pie chart of tissue expression distribution of GT-PPI or non-interactome genes harboring CHD-associated protein-altering DNVs across the six Human Protein Atlas categories (See Methods). (F) Interactome CHD candidate genes represented as a network after integration with PPI information from iRefIndex database. Nodes colored based on manually annotated biological processes and protein families/complexes grouped in boxed areas. Node size reflects probability of Loss-of-function Intolerance (pLI) scores. Node shape reflects belonging to TBX5 (triangle), GATA4 (circle) or GATA4&TBX5 (square) networks. Red highlights proteins encoded by genes involved in human CHD. Edges represent protein-protein interactions from iRefIndex database (Razick et al., 2008).
Figure 4:
Figure 4:. Integrative variant prioritization scoring to rank CHD-associated variants.
See also Figure S4 and Table S1L and 1M. (A) Variant prioritization score strategy (see STAR Methods: Variant scoring and Figure S5A). (B) Variant prioritization scores for interactome missense DNVs in described CHD genes (red) or in CHD candidate genes (green) plotted against the corresponding genes’ expression percentile rank in the developing heart (E14.5). Published mutations with strong contribution (blue) or partial contribution (orange) to CHD are included as references. (C) Biochemical evaluation by luciferase assays of the functional impact for variant alleles with different prioritization scores in panel B within NKX2-5, CHD7, BRD4 or SMARCC1. The CHD7 ATPase mutant used as positive control for CHD7 loss of function (Liu et al., 2014). One-way ANOVA coupled with Tukey post hoc test: *** p-value <0.001, **p-value<0.01.
Figure 5:
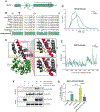
Figure 5:. Functional impact of a highly scored CHD variant in GLYR1.
See also Figure S4 and Table S1N. (A) Simplified protein schematic depicting the domain organization of human GLYR1. Black rectangle indicates zoomed-in protein region in Figure 5B. (B) Protein sequence conservation across vertebrate species for the GLYR1 rigid loop region containing the CHD-associated P496L DNV. (C) GLYR1 dehydrogenase domains: Rossman-fold globular domain (green), the linking α9-helix (red), and the α-helical bundle (dark blue). Right panels: zoom into the WT and mutant forms of the rigid loop with aromatic residues in beige and Proline 496 in orange. (D) Distribution of the root mean square deviation (RMSD) of frames visited during the trajectories from the reference state represented by the starting structure of the WT (blue) and the P496L mutant (green) GLYR1 dehydrogenase domains within the measured time. (E) Residue flexibility analysis based on the standard deviations of the atomic positions in the simulations (RMSF) after fitting to the starting structure of the WT form (blue) and the mutant (green) GLYR1 dehydrogenase domains. F-statistic shows lower flexibility of the mutant compared to the in the Rossman-fold domain (residues 262-437). (F) The ability of GLYR1 WT or P496L mutant to interact with GATA4 by immunoprecipitation (IP) of GLYR1-MYC and immunoblotting with indicated antibodies. (G) Luciferase reporter assay in HeLa cells showing activation of the GATA4-dependent Nppa luciferase reporter upon addition of plasmids encoding indicated proteins. (n=3 independent experiments). One-way ANOVA coupled with Tukey post hoc test: *** p-value <0.001.
Figure 6:
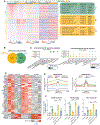
Figure 6:. GATA4-associated roles for GLYR1 in transcription regulation during cardiomyocyte differentiation.
See also Figure S5 and Table S1O-T. (A) Heat map of genes differentially bound by GLYR1 (FDR<0.1) between hiPSCs and CPs subjected to k-means clustering based on: GLYR1 ChIPseq signal (3 representative replicates plotted, n=5), H3K36me3 ChIPseq signal (n=2) and gene expression levels (GSE137920; n=3). Statistically enriched GO Biological Process terms and example genes per cluster on the right panel. (B) Overlap of genes bound by GLYR1 in CPs from Clusters 2 & 3 (FDR<0.1, LogFC>0.5) with genes occupied by GATA4 within the gene body (1st intron-TES). The odds of GATA4 binding to gene bodies enriched GLYR1 signal vs no GATA4 binding is 2.38 (***p-value < 2.2e−16, fisher’s exact test). (C) Gene Ontology enrichment analysis of biological process for genes up- or down-regulated in CPs compared to hiPSCs (FDR<0.05) and bound by GATA4:GLYR1, GLYR1-Only and GATA4-Only. Prot., protein; dev., development. (D) Heat map of GATA4:GLYR1 co-bound genes differentially expressed (FDR<0.05) upon independent knockdown of GATA4 or GLYR1 at the CP stage by RNAseq. (E) Metagene plots for GATA4:GLYR1 co-bound genes plotting the normalized ChIPseq signal for the indicated histone marks (publicly available data GSE85631 and GSM2047027) and other cardiac transcription factors centered on GATA4 peaks within the gene body (1st Intron-TES). One representative replicate plotted. (F) Transcriptional activity of three putative intronic regulatory elements co-bound by GATA4 & GLYR1 in the presence of indicated regulatory proteins. One-way ANOVA coupled with Tukey post hoc test (n=3): *** p-value <0.001.
Figure 7:
Figure 7:. Impact of the GLYR1 P496L missense variant in human iPS-derived cardiac cells and in mouse cardiogenesis.
See also Figure S6 and S7 and Table S1U-AC. (A-B) UMAP plot from 3 independent human iPS-CP differentiations at day 6 colored by (A) cluster identity and (B) genotype. Bar plot and natural log odds ratio (LogOR) reflect the GLYR1P496L cells contribution to each of the clusters compared to GLYR1WT cells. None reach statistical significance. (C) Gene Ontology (GO) Biological Process enrichment analysis for genes up-regulated or down-regulated (GLYR1P496L vs GLYR1WT, FDR<0.05) within CP-like cells (cluster 0) at differentiation day 6. (D) Percentage of GATA4:GLYR1, GLYR1-Only or GATA4-Only bound genes in CPs based on ChIPseq that were differentially expressed (GLYR1P496L vs GLYR1WT, FDR<0.05) in CP-like cells (cluster 0). Numbers within the bars: absolute numbers of genes involved. (E) Scatter plots for GLYR1 ChIPseq signal among biological replicates from GLYR1WT (n=5) or GLYR1P496L (n= 3) CP differentiation at day 6 for GATA4:GLYR1 co-bound genes and down-regulated or up-regulated (FDR<0.05) in panel D. Dash red line: identity line; grey line: data trend line. (F) Representative GLYR1 ChIPseq coverage tracks and expression violin plots for two representative GATA4:GLYR1 bound loci found in panel D and E to be down-regulated in CP-like cells (cluster 0) and had reduced GLYR1 occupancy in GLYR1P496L compared to GLYR1WT at differentiation day 6. (G-H) UMAP plot from 3 independent day 18 CM differentiations colored by (G) cluster identity and (H) genotype. Bar plot and natural log odds ratio (LogOR) reflect GLYR1P496L cells contribution to each of the identity clusters compared to GLYR1WT cells (Table S1AB). The LogOR of all clusters between GLYR1P496L vs GLYR1WT are statistically significant, except for clusters 7 and 10 (FDR < 0.05). (I) Percentage of cTNT positive cells in GLYR1WT and GLYR1P496L CM differentiation day 18 as measured by flow cytometry (n= 3). Unpaired Student’s t-test: ***p-value<0.001. (J) Representative immunostaining micrographs for cTNT (red), GLYR1 (green) or DAPI (blue) in GLYR1WT and GLYR1P496L at CM differentiation day 18. Scale (50μm). (K) Whole mount images (scale 1 mm) and hematoxylin and eosin (H&E) images of cross-sections (scale 300 μm) from WT, Glyr1+/P495L, Gata4+/− and Glyr1+/P495L:Gata4+/− representative hearts at postnatal day 1. The AVSD incidence per genotype is indicated as a percentage of the total number of hearts analyzed by histology. (L) Echocardiography detection of ventricular septal defects (VSD) in Glyr1+/P495L:Gata4+/− compound heterozygous hearts at postnatal day 0. On apical 4 chamber view, in Glyr1+/P495L:Gata4+/−, red flow in the right ventricle (RV) indicates blood that has crossed the intraventricular septum (IVS) from the left ventricle (LV) and is flowing toward the transducer.

Comment in

References

    1. Akerberg BN, Gu F, VanDusen NJ, Zhang X, Dong R, Li K, Zhang B, Zhou B, Sethi I, Ma Q, et al. (2019). A reference map of murine cardiac transcription factor chromatin occupancy identifies dynamic and conserved enhancers. Nat. Commun 10, 4907. - PMC - PubMed
    1. Alexanian M, Przytycki PF, Micheletti R, et al. 2021. A transcriptional switch governs fibroblast activation in heart disease. Nature 595(7867), pp. 438–443. - PMC - PubMed
    1. Andrews S (2007). A quality control tool for high throughput sequence data. babraham bioinformatics.
    1. Ang Y-S, Rivas RN, Ribeiro AJS, Srivas R, Rivera J, Stone NR, Pratt K, Mohamed TMA, Fu J-D, Spencer CI, et al. (2016). Disease model of GATA4 mutation reveals transcription factor cooperativity in human cardiogenesis. Cell 167, 1734–1749.e22. - PMC - PubMed
    1. Aronesty E 2013. Comparison of Sequencing Utility Programs. The open bioinformatics journal 7(1), pp. 1–8.