. 2022 Mar 9;30(3):357-372.e11.
doi: 10.1016/j.chom.2022.01.014. Epub 2022 Feb 18.

Poxviruses and paramyxoviruses use a conserved mechanism of STAT1 antagonism to inhibit interferon signaling

Affiliations

Poxviruses and paramyxoviruses use a conserved mechanism of STAT1 antagonism to inhibit interferon signaling

Callum Talbot-Cooper et al. Cell Host Microbe. .

Abstract

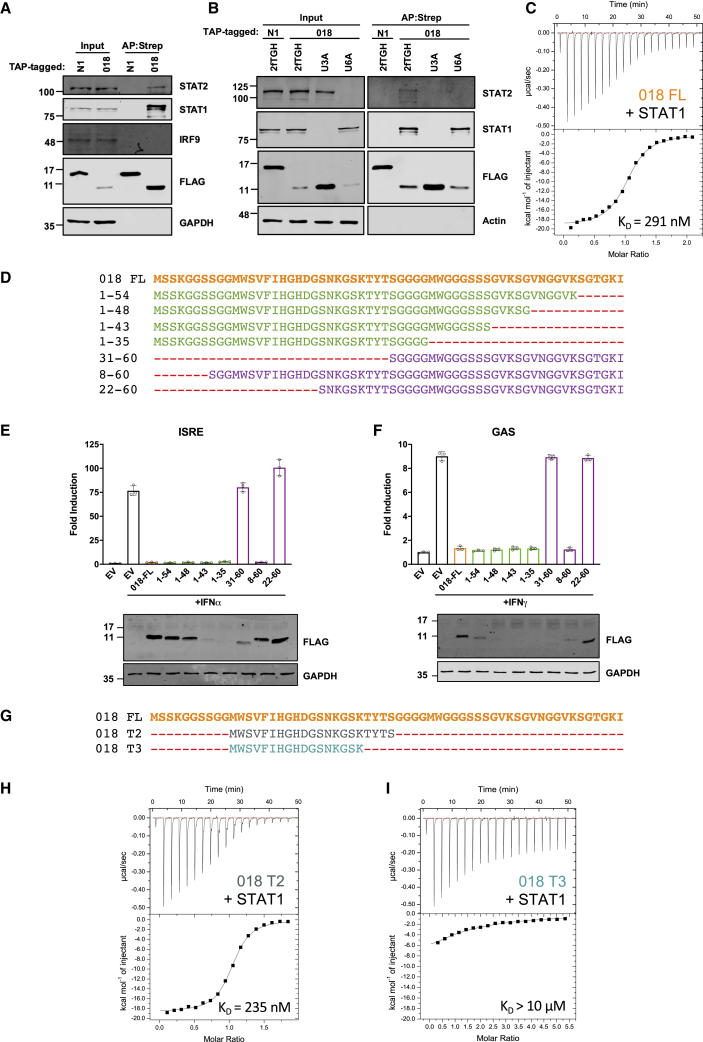
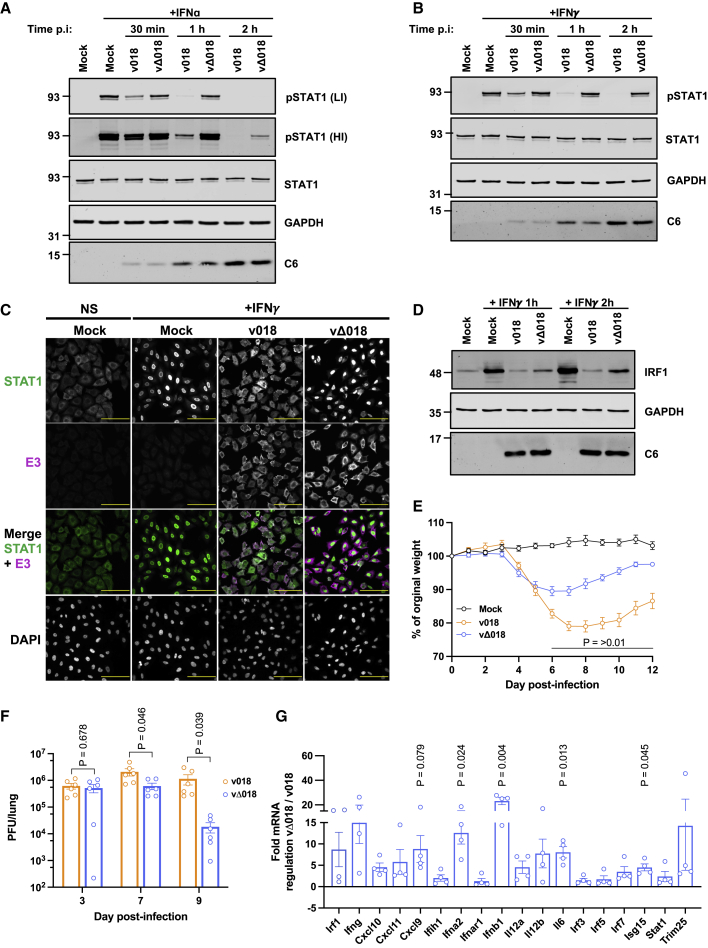
The induction of interferon (IFN)-stimulated genes by STATs is a critical host defense mechanism against virus infection. Here, we report that a highly expressed poxvirus protein, 018, inhibits IFN-induced signaling by binding to the SH2 domain of STAT1, thereby preventing the association of STAT1 with an activated IFN receptor. Despite encoding other inhibitors of IFN-induced signaling, a poxvirus mutant lacking 018 was attenuated in mice. The 2.0 Å crystal structure of the 018:STAT1 complex reveals a phosphotyrosine-independent mode of 018 binding to the SH2 domain of STAT1. Moreover, the STAT1-binding motif of 018 shows similarity to the STAT1-binding proteins from Nipah virus, which, similar to 018, block the association of STAT1 with an IFN receptor. Overall, these results uncover a conserved mechanism of STAT1 antagonism that is employed independently by distinct virus families.

Keywords: IFN signaling; Nipah virus; STAT1; co-structure; convergent evolution; immune evasion; paramyxovirus; poxvirus; vaccinia virus; virulence factor.


Conflict of interest statement

Declaration of interests The authors declare no competing interests.

Figures

None
Graphical abstract
Figure 1
Figure 1
VACV protein 018 inhibits IFN-induced signaling (A–C) (A and C) HEK 293T or (B) HeLa cells were transfected with reporter plasmids ISRE-Luc (A), GAS-Luc (B), or IFNβ-Luc (C), plus TK-Renilla and empty vector (EV) or vectors expressing indicated proteins fused to a TAP tag. Cells were stimulated with IFNα (A), IFNγ (B), or SeV (C), for 6 (A), 8 (B), or 24 h (C) and then luciferase activity was measured, and lysates were analyzed by immunoblotting. Means ± SD (n = 5 per condition) are shown. (D and E) T-REx 293 cells expressing indicated proteins were stimulated with IFNα (D) or IFNγ (E) for 24 h and lysates were analyzed by immunoblotting. Data for (A–C) and (D and E) are representative of 3 or 2 individual experiments, respectively.
Figure 2
Figure 2
Phosphorylation of STAT1 at Tyr701 is blocked by 018 (A and B) HeLa cells were transfected with plasmids expressing TAP-tagged 018, N1, or NiV-V and stimulated with IFNα or IFNγ for 1 h. Cells were immunostained with α-FLAG (pink) (A and B) and either α-STAT1 (green) (A) or α-STAT2 (green) (B) and DNA stained with DAPI. Cells were visualized by confocal microscopy. Scale bar (yellow) = 50 μm. Quantification of STAT1/2 translocation in transfected cells for (A and B) is provided in Figures S2A and S2B. (C and D) T-REx 293 cells expressing indicated proteins were stimulated with IFNα (C) or IFNγ (D) for 30 min, and lysates were analyzed by immunoblotting. Quantification of band intensities for (C and D) is provided in Figures S2C–S2E. Data for (A and B) and (C and D) are representative of 2 or 3 individual experiments, respectively.
Figure 3
Figure 3
A 21 aa fragment of 018 is sufficient to bind STAT1 (A and B) TAP-tagged 018 and N1 were expressed in 2fTGH cells (A) or 2fTGH, U3A (STAT1−/−) and U6A (STAT2−/−) cells (B) by transfection and purified by Strep-Tactin. Total lysate (Input) and purified proteins (AP:Strep) were analyzed by immunoblotting. (C) ITC data for GB1-018 (100 μM) titrated into U-STAT1 (10 μM). Fitting of the isotherm (bottom) to a one site model gave a KD of 291 nM. Completely fitted ITC parameters are provided in Table S5. (D) Sequences for TAP-tagged C-terminal (green) and N-terminal (purple) 018 truncation mutants. (E and F) (E) HEK 293T or (F) HeLa cells were transfected with reporter plasmids ISRE-Luc (E) or GAS-Luc (F) along with TK-Renilla and vectors expressing proteins from (D). Cells were stimulated with IFNα (E) or IFNγ (F) for 6 (E) or 8 h (F) and then luciferase activity was measured, and lysates were analyzed by immunoblotting. Means ± SD (n = 3 per condition) are shown. Percentage inhibitory activity and relative protein expression levels from (E and F) are shown in Figure S3F. Data shown in (A and B) and (E and F) are representative of 3 or 2 individual experiments, respectively. (G) Sequences for GB1-fused 018 truncation mutants. (H and I) ITC data for 150 μM GB1-018T2 (H) or 350 μM GB1-018T3 (I) titrated into 15 μM STAT1. Accurate fitting of the isotherm for (I) was not possible due to the low C-value of the reaction.
Figure 4
Figure 4
018 is a virulence factor (A and B) A549 cells were mock infected or infected with v018 or vΔ018 at 10 pfu/cell. At 30 min, 1 h, or 2 h post infection (p.i.) cells were washed once, then stimulated with IFNα (A) or IFNγ (B) for 30 min, and lysates were analyzed by immunoblotting. (C and D) A549 cells were infected as described for (A and B) and at 2 h p.i., cells were washed once and then stimulated with IFNγ for 30 min (C), or 1 and 2 h (D). (C) Cells were immunostained with α-STAT1 and α-E3 (an VACV early protein), and DNA stained with DAPI. Cells were visualized by confocal microscopy. Scale bar (yellow) is 100 μm. (D) Cell lysates were analyzed by immunoblotting including VACV protein C6 to control for equal infection (A, B, and D). For (A), high-intensity (HI) and low-intensity (LI) scans for α-pSTAT1 are shown. Data for (A–D) are representative of 3 separate experiments. (E–G) BALB/c mice were infected intranasally with v018 (orange) or vΔ018 (blue) at 103 (E and F) or 105 (G) pfu and weighed daily (E) or virus titers in upper lung lobes were titrated by plaque assay on days 3, 7, and 9 p.i. (F), or mice were sacrificed at 3 days p.i. and mRNA levels of indicated genes from upper lung lobes were analyzed by RT-qPCR (G). Data from (E and F) are representative of at 2 individual experiments using 5 or 3 mice, respectively, per group that were then pooled. Data from (G) are representative of 4 (vΔ018) or 3 (v018) mice per group. For (E–G) means ± SEM are shown, and p values were calculated using unpaired t test with (E and F) or without (G) Welch’s correction.
Figure 5
Figure 5
018 binds the STAT1 SH2 domain to block its association with the phosphorylated IFNGR1 (A) Schematic of STAT1-STAT3 chimeras and STAT1 truncation mutants. STAT1 regions (gray) and STAT3 (white) are shown. (B–D) TAP-tagged proteins indicated were co-expressed with either FLAG (B) or V5-tagged (C and D) STAT proteins from (A) by transfection in U3A (STAT1−/−) cells and TAP-tagged proteins were purified by Strep-Tactin. Total lysates (Input) and purified proteins (AP:Strep) were analyzed by immunoblotting. Data from (B–D) are representative of 2 individual experiments. (E) Competition FP measurements for GB1-018 and truncation mutants. Each reaction contained 10 nM fluorescein-pIFNGR1 12-mer preincubated with 1.5 μM U-STAT1, to which 2-fold serial dilutions of GB1-018 proteins were added. 100 mP represents the calibrated FP value of the free fluorescent probe. (F and G) ITC data for 300 μM pIFNGR1 5-mer titrated into 10 μM U-STAT1 (F) or 10 μM U-STAT1 preincubated with 50 μM GB1-018 (G). No heat of binding was detected for (G).
Figure 6
Figure 6
VACV 018 and NiV-V protein utilize a shared motif to engage STAT1 (A) Schematic of Nipah virus P, V, and W proteins indicating the common N-terminal region (purple) and unique C-terminal region (gray). Below, the STAT1-binding regions of P/V/W (residues 110–140, purple) and 018 (residues 11–31, orange) are aligned with key conserved residues emboldened. Sites of NiV-VADA (blue) and 018AGA (red) mutants are shown. (B) ITC data for the titration of 100 μM GB1-018AGA into 10 μM U-STAT1. No heat of binding was observed. (C and D) (C) HEK 293T or (D) HeLa cells were transfected with plasmids ISRE-Luc (C) or GAS-Luc (D) along with TK-Renilla and vectors expressing the indicated TAP-tagged proteins. Cells were stimulated with IFNα (C) or IFNγ (D) for 6 h (C) or 8 h (D), then luciferase activity was measured, and lysates were analyzed by immunoblotting. Means ± SD (n = 5 per condition) are shown. (E and F) TAP-tagged and HA-tagged proteins were co-expressed in HEK 293T cells by transfection as indicted and TAP-tagged proteins were purified by Strep-Tactin. Total lysates (Input) and purified (AP:Strep) proteins were analyzed by immunoblotting. For (E), high-intensity (HI) and low-intensity (LI) scans are shown for α-HA. VACV proteins TAP-C16 and HA-C6 were used as a pull-down and competition protein controls, respectively. Data shown in (C and D) and (E and F) are representative of 2 or 3 individual experiments, respectively. (G and I) Competition FP measurements for GB1-018 and GB1-018AGA (G) or GB1-NiV-V and GB1-NiV-VADA (I) binding to U-STAT1. Each reaction contained 10 nM fluorescein-pIFNGR1 12-mer preincubated with 1.5 μM U-STAT1, to which 2-fold serial dilutions of GB1 proteins were added. 100 mP represents the calibrated FP value of the free fluorescent probe. The NiV-VADA curve has a positive slope at high protein concentrations due to increased sample viscosity or non-specific interactions (I). (H, J, and K) ITC data for 300 μM pIFNGR1 5-mer titrated into 10 μM U-STAT1 preincubated with 50 μM GB1-018AGA (H), 200 μM NiV-V (J), or 200 μM NiV-VADA (K). No heat of binding was detected for the reaction containing GB1-NiV-V.
Figure 7
Figure 7
Structural basis of 018 binding to U-STAT1 (A–E) Crystal structure of the 018:STAT1 core complex (PDB: 7nuf). 018 is depicted in orange, the SH2 domain is dark gray, and the rest of the core is light gray. (A) Surface view of the complex from two perpendicular axes. (B) 018 binding mode at the STAT1 SH2 domain superimposed with IFNGR1 phosphopeptide (green, PDB: 1yvl) and STAT1 pTyr701 phosphopeptide (cyan, PDB: 1bf5). (C) Ribbon diagram of 018 and the STAT1 SH2 domain with β-sheet-forming hydrogen bonds shown in green. SH2 domain core β-strands are labeled with standard nomenclature. (D) Detailed depiction of 018 binding to the STAT1 SH2 domain. 018 sidechains are shown as sticks and backbone atoms as ribbons. Key STAT1 sidechains are depicted as sticks under semi-transparent surface. (E) A zoomed-in view of HxH motif binding. (F and G) V5-tagged and TAP-tagged proteins were co-expressed in U3A (STAT1−/−) cells by transfection as indicted and purified using Strep-Tactin. Total lysates (Input) and purified proteins (AP:Strep) were analyzed by immunoblotting. STAT3Q635H and 018AGA are labeled as Q635H and AGA, respectively (G). Data shown in (F and G) are representative of 2 individual experiments.

Comment in

References

    1. Aaronson D.S., Horvath C.M. A road map for those who don’t know JAK-STAT. Science. 2002;296:1653–1655. - PubMed
    1. Albarnaz J.D., Torres A.A., Smith G.L. Modulating vaccinia virus immunomodulators to improve immunological memory. Viruses. 2018;10:101. - PMC - PubMed
    1. Alcamí A., Smith G.L. Vaccinia, cowpox, and camelpox viruses encode soluble gamma interferon receptors with novel broad species specificity. J. Virol. 1995;69:4633–4639. - PMC - PubMed
    1. Alcamí A., Symons J.A., Smith G.L. The vaccinia virus soluble alpha/beta interferon (IFN) receptor binds to the cell surface and protects cells from the antiviral effects of IFN. J. Virol. 2000;74:11230–11239. - PMC - PubMed
    1. Arunkumar G., Chandni R., Mourya D.T., Singh S.K., Sadanandan R., Sudan P., Bhargava B., Nipah Investigators People and Health Study Group Outbreak investigation of Nipah virus disease in Kerala, India, 2018. J. Infect. Dis. 2019;219:1867–1878. - PubMed