

Social and geographic inequalities in water, sanitation and hygiene access in 21 refugee camps and settlements in Bangladesh, Kenya, Uganda, South Sudan, and Zimbabwe
- PMID: 35183166
- PMCID: PMC8857872
- DOI: 10.1186/s12939-022-01626-3
Social and geographic inequalities in water, sanitation and hygiene access in 21 refugee camps and settlements in Bangladesh, Kenya, Uganda, South Sudan, and Zimbabwe
Erratum in
-
Correction: Social and geographic inequalities in water, sanitation and hygiene access in 21 refugee camps and settlements in Bangladesh, Kenya, Uganda, South Sudan, and Zimbabwe.Int J Equity Health. 2022 May 10;21(1):64. doi: 10.1186/s12939-022-01671-y. Int J Equity Health. 2022. PMID: 35538546 Free PMC article. No abstract available.
Abstract
Introduction: Many refugees face challenges accessing water, sanitation, and hygiene (WASH) services. However, there is limited literature on WASH access for refugee populations, including for menstrual health services. Unmet WASH access needs may therefore be hidden, amplifying morbidity and mortality risks for already vulnerable refugee populations. The aim of this study was therefore to quantitatively analyze WASH access among refugee camps, with a focus on households with women of reproductive age.
Methods: This was a cross-sectional study that utilized the Standardized WASH Knowledge, Attitude and Practice (KAP) Survey. A total of 5632 household questionnaires were completed by the United Nations Refugee Agency in 2019 in 21 refugee camps and settlements in Bangladesh, Kenya, South Sudan, Uganda, and Zimbabwe. WASH access (14 items) and social and geographic stratifiers were analyzed at the household-level including the refugee camp, country of the settlement, having women of reproductive age, members with disability/elderly status, and household size. We calculated frequencies, odds ratios, and performed bivariate and multivariate analyses to measure inequalities. We developed a Female WASH Access Index to characterize WASH access for households with women of reproductive age.
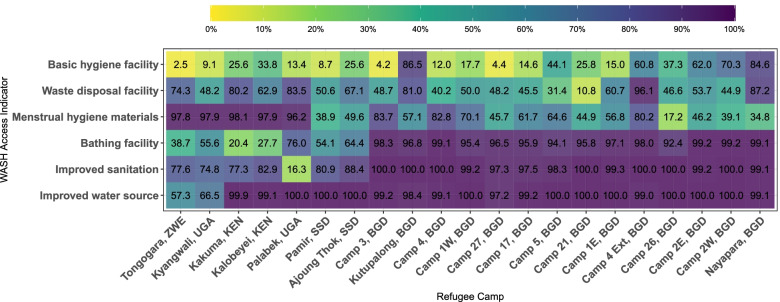
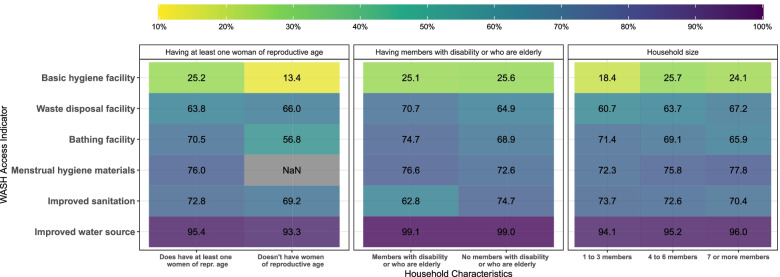
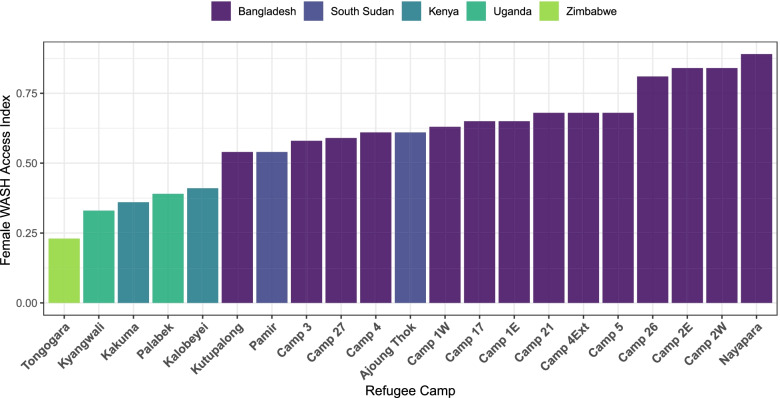
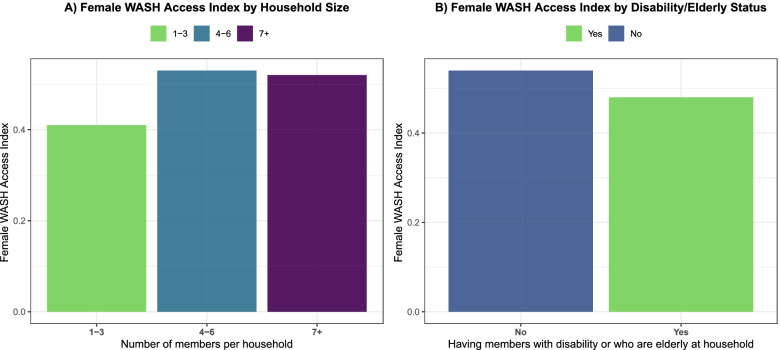
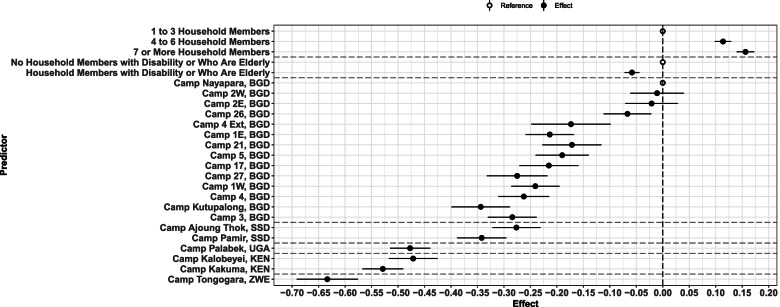
Results: Most refugee households had high levels of access to improved water (95%), low levels of access to waste disposal facility (64%) and sanitation privacy (63%), and very low access to basic sanitation (30%) and hand hygiene facility (24%). 76% of households with women of reproductive age had access to menstrual health materials. WASH access indicators and the Female WASH Access Index showed large inequalities across social and geographic stratifiers. Households with disabled or elderly members, and fewer members had poorer WASH access. Households with women of reproductive age had lower access to basic sanitation.
Conclusions: Large inequalities in WASH access indicators were identified between refugee sites and across countries, in all metrics. We found high levels of access to improved water across most of the refugee camps and settlements studied. Access to basic hygiene and sanitation, sanitation privacy, waste disposal, and menstrual health materials, could be improved across refugee sites. Households with women of reproductive age, with 4+ members, and without members with disability/elderly status were associated with higher WASH access. The female WASH access index piloted here could be a useful tool to quickly summarize WASH access in households with women of reproductive age.
Keywords: Africa; Asia; Menstrual health; Refugees; WASH; WASH access index; Women.
© 2022. The Author(s).
Conflict of interest statement
None.
Figures
References
-
- UNHCR . UNHCR Data. UNHCR; 2020.
-
- UNHCR . Convention and protocol relating to the status of refugees. UNHCR; 1967. - PubMed
-
- Council on Foreign Relations . The World’s Swelling Refugee Population Has Shrinking Options. Council on Foreign Relations; 2021.
