

Future health spending forecast in leading emerging BRICS markets in 2030: health policy implications
- PMID: 35183217
- PMCID: PMC8857747
- DOI: 10.1186/s12961-022-00822-5
Future health spending forecast in leading emerging BRICS markets in 2030: health policy implications
Erratum in
-
Correction to: Future health spending forecast in leading emerging BRICS markets in 2030: health policy implications.Health Res Policy Syst. 2022 Mar 17;20(1):30. doi: 10.1186/s12961-022-00836-z. Health Res Policy Syst. 2022. PMID: 35300693 Free PMC article. No abstract available.
Abstract
Background: The leading emerging markets of Brazil, Russia, India, China and South Africa (BRICS) are increasingly shaping the landscape of the global health sector demand and supply for medical goods and services. BRICS' share of global health spending and future projections will play a prominent role during the 2020s. The purpose of the current research was to examine the decades-long underlying historical trends in BRICS countries' health spending and explore these data as the grounds for reliable forecasting of their health expenditures up to 2030.
Methods: BRICS' health spending data spanning 1995-2017 were extracted from the Institute for Health Metrics and Evaluation (IHME) Financing Global Health 2019 database. Total health expenditure, government, prepaid private and out-of-pocket spending per capita and gross domestic product (GDP) share of total health spending were forecasted for 2018-2030. Autoregressive integrated moving average (ARIMA) models were used to obtain future projections based on time series analysis.
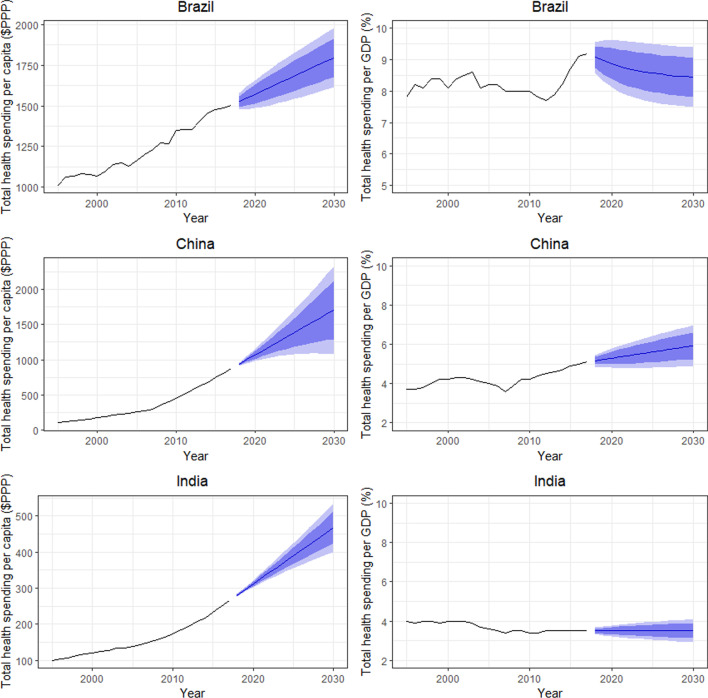
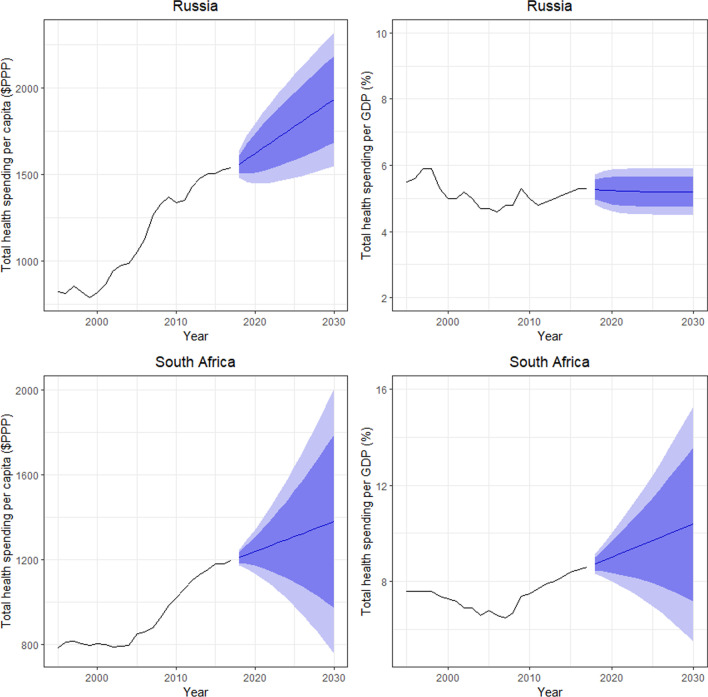
Results: Per capita health spending in 2030 is projected to be as follows: Brazil, $1767 (95% prediction interval [PI] 1615, 1977); Russia, $1933 (95% PI 1549, 2317); India, $468 (95% PI 400.4, 535); China, $1707 (95% PI 1079, 2334); South Africa, $1379 (95% PI 755, 2004). Health spending as a percentage of GDP in 2030 is projected as follows: Brazil, 8.4% (95% PI 7.5, 9.4); Russia, 5.2% (95% PI 4.5, 5.9); India, 3.5% (95% PI 2.9%, 4.1%); China, 5.9% (95% PI 4.9, 7.0); South Africa, 10.4% (95% PI 5.5, 15.3).
Conclusions: All BRICS countries show a long-term trend towards increasing their per capita spending in terms of purchasing power parity (PPP). India and Russia are highly likely to maintain stable total health spending as a percentage of GDP until 2030. China, as a major driver of global economic growth, will be able to significantly expand its investment in the health sector across an array of indicators. Brazil is the only large nation whose health expenditure as a percentage of GDP is about to contract substantially during the third decade of the twenty-first century. The steepest curve of increased per capita spending until 2030 seems to be attributable to India, while Russia should achieve the highest values in absolute terms. Health policy implications of long-term trends in health spending indicate the need for health technology assessment dissemination among the BRICS ministries of health and national health insurance funds. Matters of cost-effective allocation of limited resources will remain a core challenge in 2030 as well.
Keywords: 2030; BRICS; Brazil; China; Forecast; Health expenditure; Health financing; Health policy; India; Projections; Russia; South Africa; Spending; Sustainable Development Goals; UN.
© 2022. The Author(s).
Conflict of interest statement
The authors declare that they have no competing interests.
Figures
References
-
- Nuvolari A. Understanding successive industrial revolutions: a “development block” approach. Environ Innov Soc Trans. 2019;32:33–44.
-
- Schneider W, Salameh E. Historical course follows climate change: patterns of the northern hemisphere—from peoples’ migration until the industrial revolution (3rd–18th Century) Open J Geol. 2018;8(13):1167–1194.
-
- Nwoko KC. Globalization and the political economy of the Northern and Southern Hemispheres: Nigeria, Brazil, Germany and the United States. IUP J Int Relations. 2011;5:2.
-
- Prashad V. The poorer nations: A possible history of the global south. Verso. https://www.versobooks.com/books/1643-the-poorer-nations. (2013).
-
- Horner R, Nadvi K. Global value chains and the rise of the Global South: unpacking twenty-first century polycentric trade. Global Netw. 2018;18(2):207–237.
MeSH terms
Grants and funding
LinkOut - more resources
Full Text Sources
Research Materials
Miscellaneous
