. 2022 Feb 18;13(2):162.
doi: 10.1038/s41419-022-04613-2.

PINK1-parkin-mediated neuronal mitophagy deficiency in prion disease

Affiliations

PINK1-parkin-mediated neuronal mitophagy deficiency in prion disease

Jie Li et al. Cell Death Dis. .

Abstract

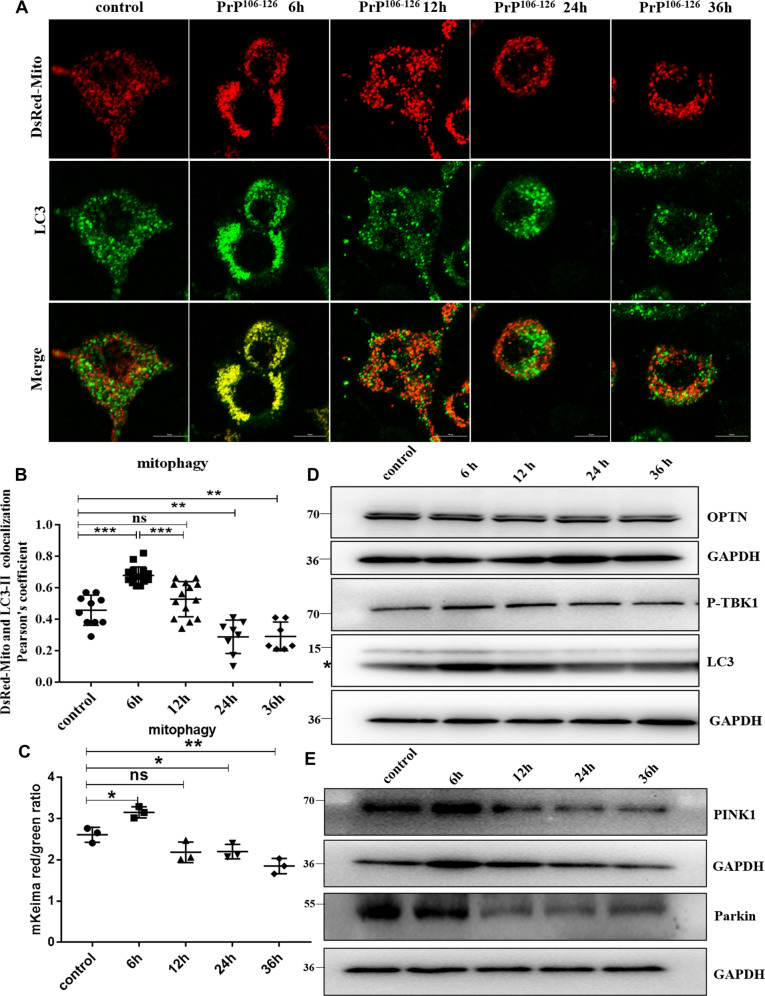
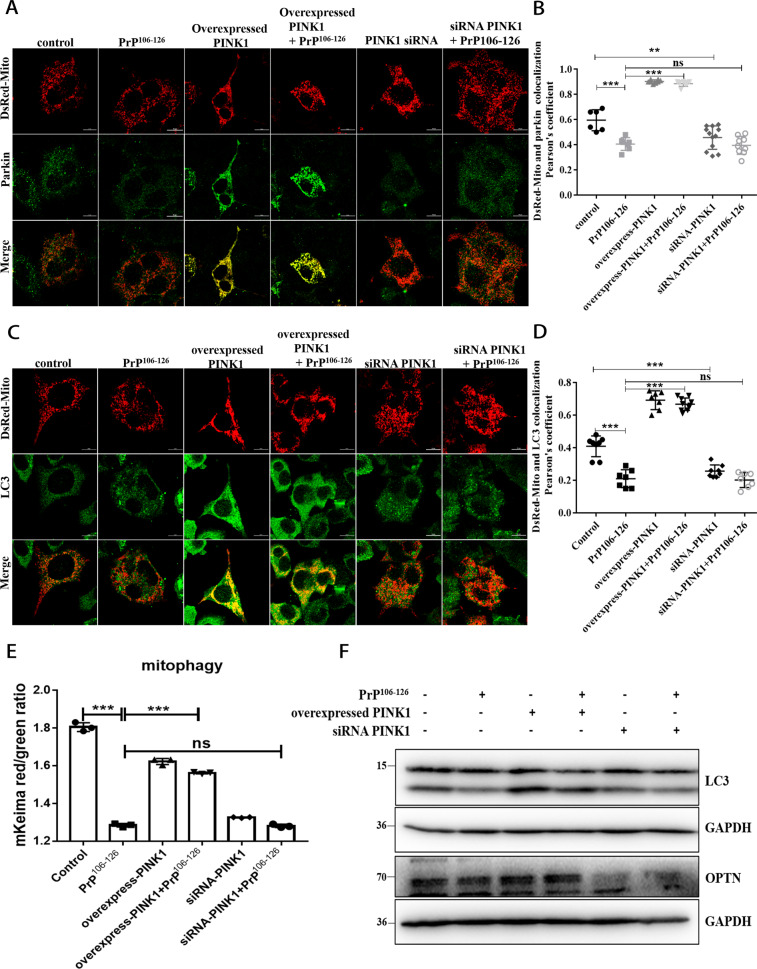
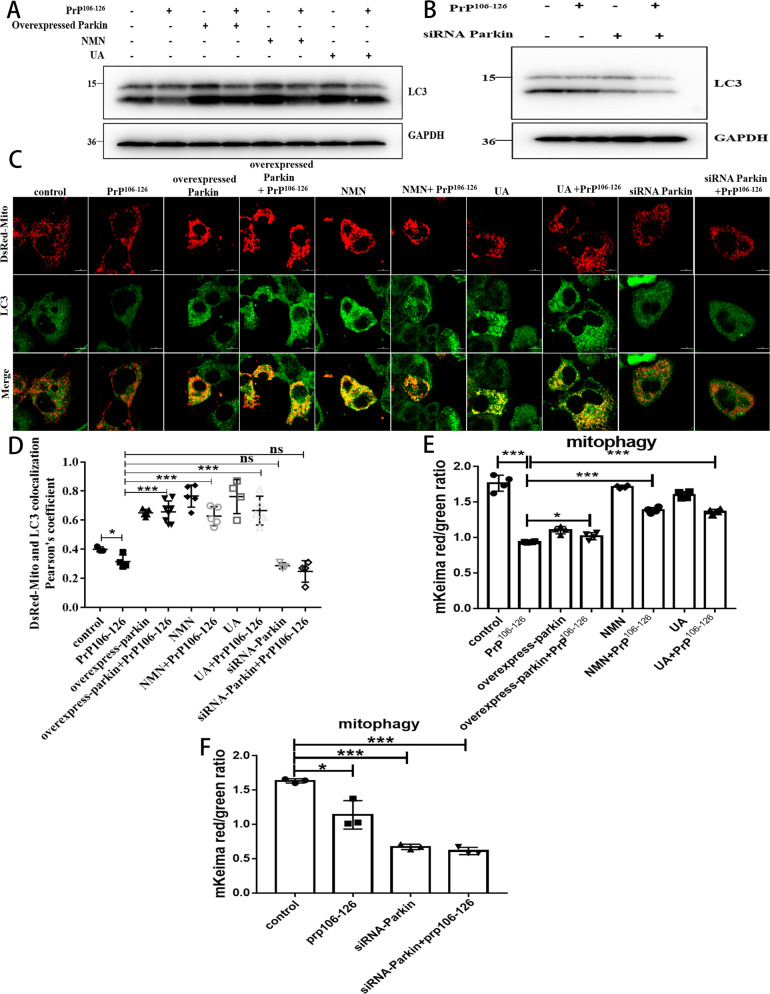
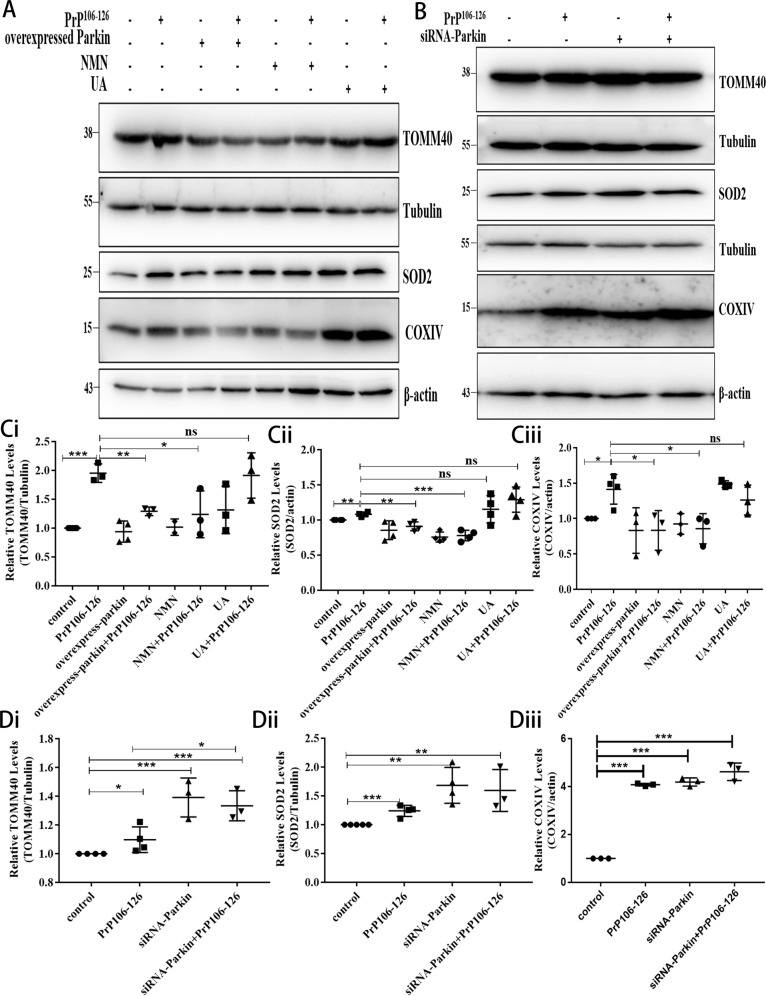
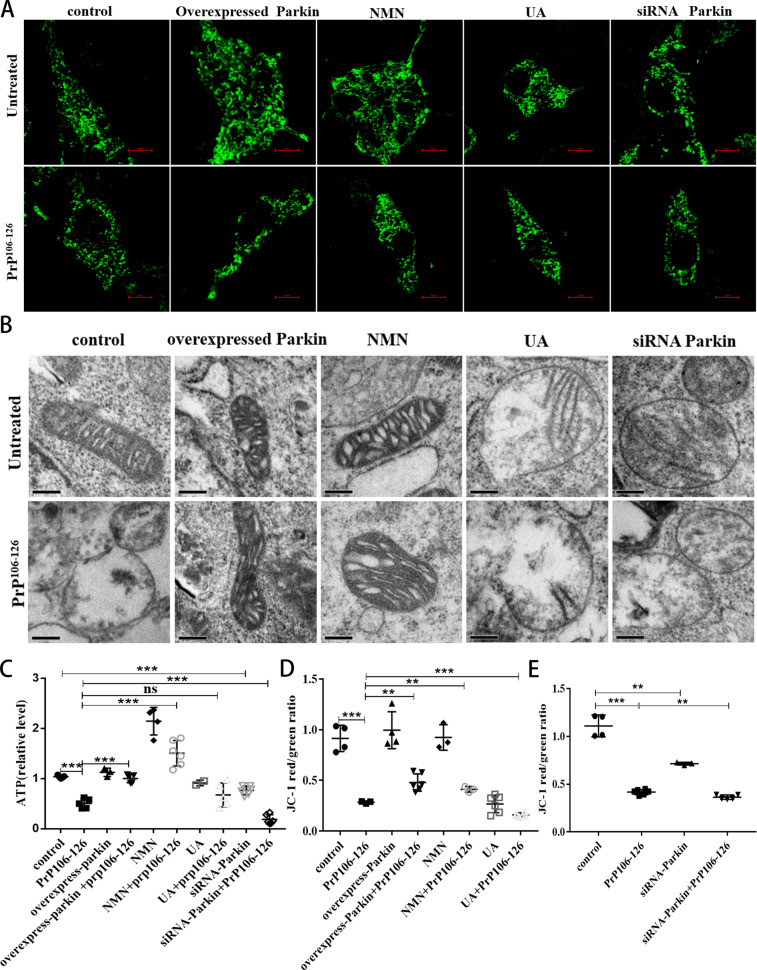
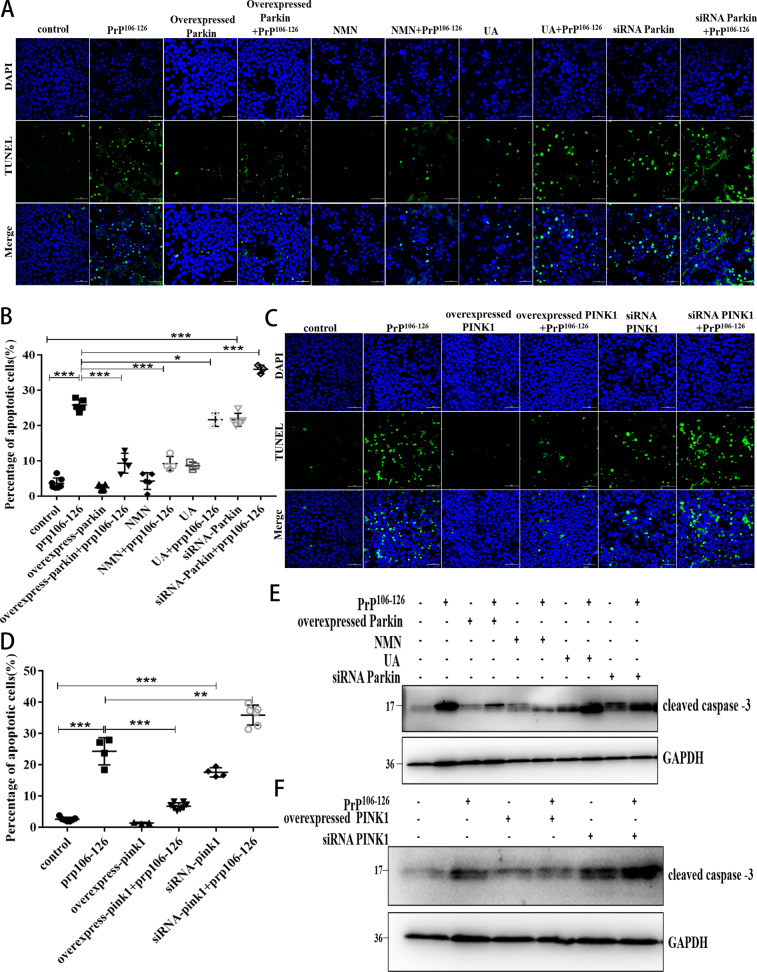
A persistent accumulation of damaged mitochondria is part of prion disease pathogenesis. Normally, damaged mitochondria are cleared via a major pathway that involves the E3 ubiquitin ligase parkin and PTEN-induced kinase 1 (PINK1) that together initiate mitophagy, recognize and eliminate damaged mitochondria. However, the precise mechanisms underlying mitophagy in prion disease remain largely unknown. Using prion disease cell models, we observed PINK1-parkin-mediated mitophagy deficiency in which parkin depletion aggravated blocked mitochondrial colocalization with LC3-II-labeled autophagosomes, and significantly increased mitochondrial protein levels, which led to inhibited mitophagy. Parkin overexpression directly induced LC3-II colocalization with mitochondria and alleviated defective mitophagy. Moreover, parkin-mediated mitophagy was dependent on PINK1, since PINK1 depletion blocked mitochondrial Parkin recruitment and reduced optineurin and LC3-II proteins levels, thus inhibiting mitophagy. PINK1 overexpression induced parkin recruitment to the mitochondria, which then stimulated mitophagy. In addition, overexpressed parkin and PINK1 also protected neurons from apoptosis. Furthermore, we found that supplementation with two mitophagy-inducing agents, nicotinamide mononucleotide (NMN) and urolithin A (UA), significantly stimulated PINK1-parkin-mediated mitophagy. However, compared with NMN, UA could not alleviate prion-induced mitochondrial fragmentation and dysfunction, and neuronal apoptosis. These findings show that PINK1-parkin-mediated mitophagy defects lead to an accumulation of damaged mitochondria, thus suggesting that interventions that stimulate mitophagy may be potential therapeutic targets for prion diseases.


Conflict of interest statement

The authors declare no competing interests.

Figures

Fig. 1
Fig. 1. PrP106-126-induced mitophagy deficiency in N2a cells.
A Mitophagy events through time show the colocalization between the autophagosome protein LC3-II and the mitochondria (labeled with DsRed-Mito) in N2a cells treated with PrP106-126. Scale bar: 10 µm. B Comparison of the localization of LC3-II and DsRed-Mito in cells in A. C Mitophagy in N2a cells treated with PrP106-126 was characterized by the COX8-mKeima fluorescence ratio change in Figure S1A. D, E Western blots of mitophagy-related proteins undergoing PrP106-126 treatments. GAPDH was used as the loading control. The “*“ in the Western blots band indicates LC3-II. Data were mean (SD); ns not significant; *P < 0.05; **P < 0.01; ***P < 0.001. All experiments were repeated at least three times.
Fig. 2
Fig. 2. PINK1 is required for parkin-mediated mitophagy in a prion disease model.
A Immunofluorescence images of mitochondrial Marker DsRed-Mito and parkin colocalization in N2a cells from Figure S4A–D with or without PrP106-126 treatment. Scale bar: 10 µm. B Comparisons of parkin recruitment in cells in A. C Immunofluorescence images of mitophagy events indicated by autophagosome protein LC3-II colocalization with mitochondria (labeled with DsRed-Mito) in N2a cells. Scale bar: 10 µm. D Comparison of the localization of LC3-II and DsRed-Mito in cells in C. E Mitophagy was characterized by the COX8-mKeima fluorescence ratio change in Fig. S4E. F Western blots of mitophagy-related proteins (LC3, OPTN) in overexpressed and knocked down (siRNA) F-PINK1 cells with or without PrP106-126 treatment. GAPDH was the loading control. Data were mean (SD). ns not significant; *P < 0.05; **P < 0.01; ***P < 0.001. All experiments were repeated at least three times.
Fig. 3
Fig. 3. Mitophagy defects caused by PrP106-126 can be alleviated by NMN, UA, and overexpression of Parkin.
A, B Western blots of LC3-I and LC3-II levels in N2a cells from Figure S6A–D, with and without PrP106-126, nicotinamide mononucleotide (NMN), and urolithin A (UA) treatments. C Immunofluorescence images of mitophagy events indicated by the colocalization of autophagosome protein LC3-II and the mitochondria (labeled with DsRed-Mito). Scale bar: 10 µm. D Comparison of the localization of LC3-II and DsRed-Mito in cells from C. E, F Mitophagy was characterized by the COX8-mKeima fluorescence ratio change in Figure S7A, B. Data were mean (SD). ns not significant; *P < 0.05; **P < 0.01; ***P < 0.001. All experiments were repeated at least three times.
Fig. 4
Fig. 4. NMN supplementation and Parkin overexpression can reduce the accumulation of damaged neuronal mitochondria caused by PrP106-126.
A, B Western blots of mitochondrial protein (TOMM40, COXIV, SOD2) expressions in N2a cells with A overexpressed and B knocked down (siRNA) parkin cells, with and without PrP106-126, nicotinamide mononucleotide (NMN), and urolithin A (UA) treatments (Tubulin and β-actin served as loading controls.) C, D Comparisons of mitochondrial protein levels, relative to controls, in cells from A and B, respectively. Data were mean (SD). ns not significant; *P < 0.05; **P < 0.01; ***P < 0.001. All experiments were repeated at least three times.
Fig. 5
Fig. 5. NMN supplementation and Parkin overexpression can alleviate PrP106-126-induced morphological mitochondrial damage and dysfunction.
A Immunofluorescence images of Mito-GPF-tagged mitochondria showing differing morphologies after various treatments. Scale bar: 10 µm. B Mitochondrial ultrastructure of cells observed using transmission electron microscopy. Scale bar: 200 nm. C Comparisons of ATP levels in N2a cells. D, E Comparisons of the analyzed MMP data, as measured by changes in red/green intensity ratios, in cells in Figure S8C, D. Data were mean (SD). ns not significant; *P < 0.05; **P < 0.01; ***P < 0.001. All experiments were repeated at least three times.
Fig. 6
Fig. 6. Activation of PINK1-parkin-mediated mitophagy attenuates PrP106-126-induced neuronal apoptosis.
A, C Fluorescence images of cell apoptosis detected by TUNEL assays (green stain) in control or treated N2a cells. DAPI (blue) indicates intact cells. Scale bar: 50 µm. B, D Comparisons of the proportions of apoptotic cells to all cells in each group in A and C, respectively. E, F Western blots of the cleaved caspase 3 levels in treated cells. GAPDH was used as the loading control. Data were mean (SD). ns not significant; *P < 0.05; **P < 0.01; ***P < 0.001. All experiments were repeated at least three times.

References

    1. Hur K, Kim JI, Choi SI, Choi EK, Carp RI, Kim YS. The pathogenic mechanisms of prion diseases. Mech Ageing Dev. 2002;123:1637–47. - PubMed
    1. Prusiner SB. Molecular biology and pathogenesis of prion diseases. Trends Biochem Sci. 1996;21:482–7. - PubMed
    1. Gu Y, Fujioka H, Mishra RS, Li R, Singh N. Prion peptide 106-126 modulates the aggregation of cellular prion protein and induces the synthesis of potentially neurotoxic transmembrane PrP. J Biol Chem. 2002;277:2275–86. - PubMed
    1. Forloni G, Angeretti N, Chiesa R, Monzani E, Salmona M, Bugiani O, et al. Neurotoxicity of a prion protein fragment. Nature. 1993;362:543–6. - PubMed
    1. Thellung S, Florio T, Villa V, Corsaro A, Arena S, Amico C, et al. Apoptotic cell death and impairment of L-type voltage-sensitive calcium channel activity in rat cerebellar granule cells treated with the prion protein fragment 106-126. Neurobiol Dis. 2000;7:299–309. - PubMed

Publication types