. 2022 Feb 19:9:uhac041.
doi: 10.1093/hr/uhac041. Online ahead of print.

Across-population genomic prediction in grapevine opens up promising prospects for breeding

Affiliations

Across-population genomic prediction in grapevine opens up promising prospects for breeding

Charlotte Brault et al. Hortic Res. .

Abstract

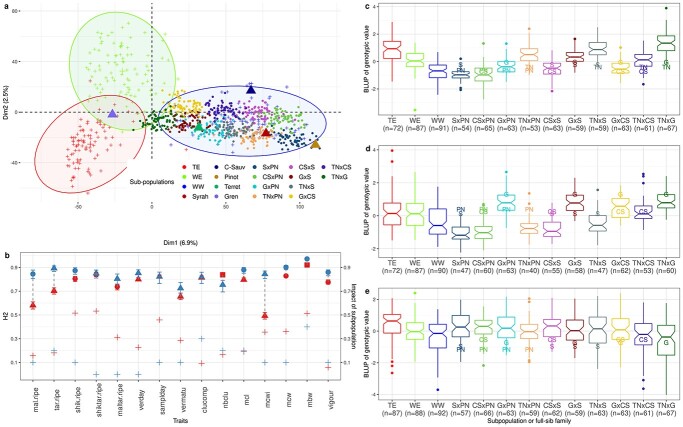
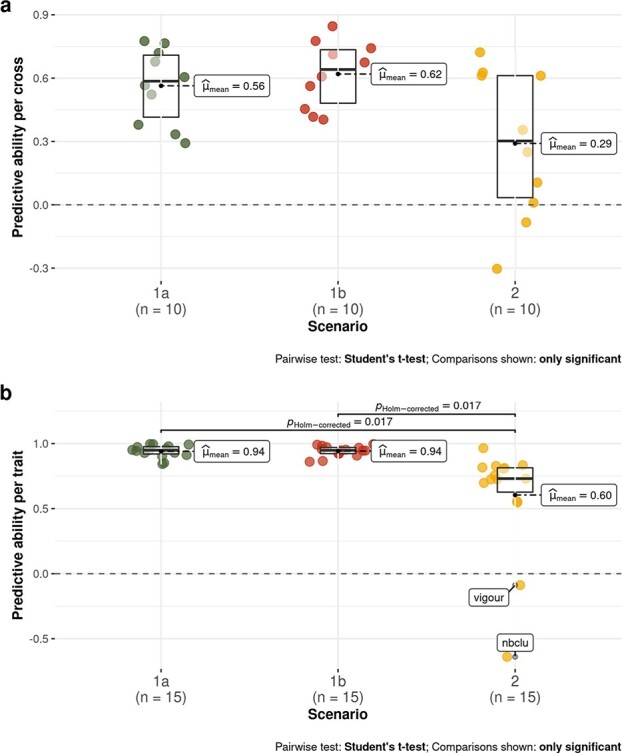
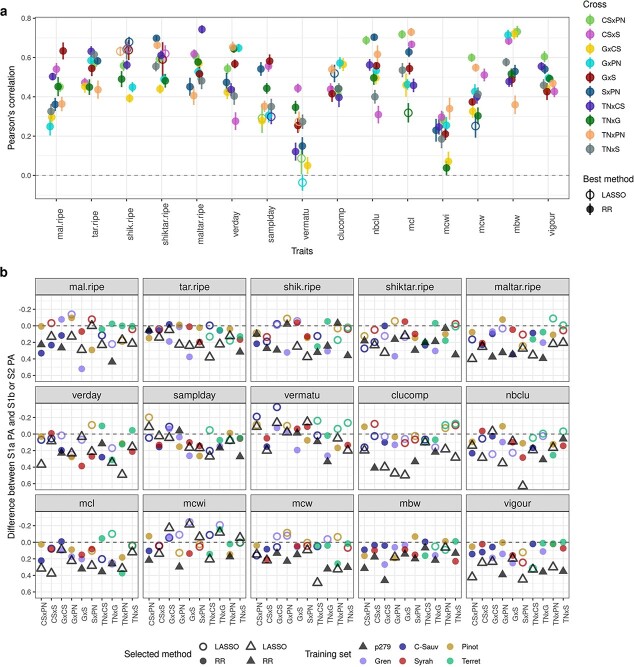
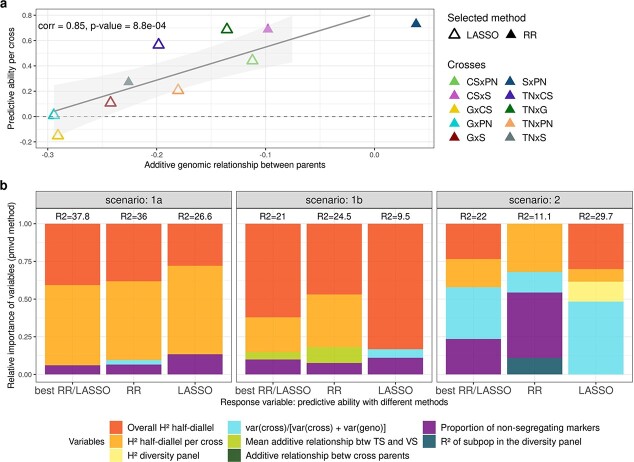
Crop breeding involves two selection steps: choosing progenitors and selecting individuals within progenies. Genomic prediction, based on genome-wide marker estimation of genetic values, could facilitate these steps. However, its potential usefulness in grapevine (Vitis vinifera L.) has only been evaluated in non-breeding contexts mainly through cross-validation within a single population. We tested across-population genomic prediction in a more realistic breeding configuration, from a diversity panel to ten bi-parental crosses connected within a half-diallel mating design. Prediction quality was evaluated over 15 traits of interest (related to yield, berry composition, phenology and vigour), for both the average genetic value of each cross (cross mean) and the genetic values of individuals within each cross (individual values). Genomic prediction in these conditions was found useful: for cross mean, average per-trait predictive ability was 0.6, while per-cross predictive ability was halved on average, but reached a maximum of 0.7. Mean predictive ability for individual values within crosses was 0.26, about half the within-half-diallel value taken as a reference. For some traits and/or crosses, these across-population predictive ability values are promising for implementing genomic selection in grapevine breeding. This study also provided key insights on variables affecting predictive ability. Per-cross predictive ability was well predicted by genetic distance between parents and when this predictive ability was below 0.6, it was improved by training set optimization. For individual values, predictive ability mostly depended on trait-related variables (magnitude of the cross effect and heritability). These results will greatly help designing grapevine breeding programs assisted by genomic prediction.

Keywords: across-population; diversity panel; genomic prediction; grapevine; half-diallel; multi-parental population.


Figures

Figure 1
Figure 1
Description of the half-diallel, relative to the diversity panel. a: PCA of the diversity panel based on 32 894 SNPs with the 3 sub-populations distinguished by different colors, on which half-diallel progenies (dots) and parents (triangles) were projected. b: Broad-sense heritability estimates in the whole half-diallel (red) and in the diversity panel (blue) for the 15 traits studied (left axis), with shape corresponding to the transformation applied to raw data; the relative variance due to the cross effect and the coefficient of determination of the subpopulation effect, for the half-diallel (red) and the diversity panel (blue), respectively, are also reported with “+” (right axis). c, d, e: genotypic value BLUP distribution in each subpopulation or progeny, for mean berry weight, mean cluster width and vigour, respectively; BLUPs for parents are indicated by their initial letters (Table S4). Number of genotypes per subpopulation/progeny is indicated below the subpopulation/progeny name. These traits were chosen to represent various levels of H2 and relative importance of cross effect. BLUP distributions for all traits are presented in Figure S3.
Figure 2
Figure 2
Schematic description of the three scenarios tested. TS: training set, VS: validation set. Each small grey circle represents one cross of the half-diallel and the large grey triangle represents the diversity panel. In scenario 1a, GP was applied within the half-diallel population with 10-fold cross-validation repeated 10 times. In scenario 1b, the three half-sib families from each parent were used separately as TS. In scenario 2, TS was the diversity panel. See details in Table S6.
Figure 3
Figure 3
Boxplots of PA values for the three scenarios (1a: within whole half-diallel prediction; 1b: half-sib prediction within half-diallel; 2: across-population prediction with diversity panel as training set and each half-diallel cross as validation set). Each PA value was the best one obtained between RR and LASSO methods. Average PA is indicated next to each boxplot. a: per-cross PA, b: per-trait PA. Per-cross PA corresponds to the Pearson’s correlation between observed and predicted family mean, over the 10 crosses. Similarly, per-trait PA was calculated over the 15 traits.
Figure 4
Figure 4
a: Mendelian sampling PA per trait and cross for scenario 1a with the best method between RR and LASSO. Vertical bars represent the standard error around the mean (95% of the confidence interval), based on the outer cross-validation replicates. PA corresponds to the Pearson’s correlation between the BLUPs of the genotypic value and the predicted genotypic values. b: Difference between PA of scenario 1a and of the other scenarios. S2 is displayed with a triangle, and S1b by circles, colored according to the parental training set and filled if the best method was RR and empty otherwise.
Figure 5
Figure 5
a: Plot of per-cross PA for cross mean in scenario 2, obtained with the best method between RR and LASSO for each cross, against the distance between cross parents on the first axis of the diversity panel PCA (Figure 1a). Best method is indicated with the triangle filling and cross with the color. b: Relative importance of variables affecting PA for Mendelian sampling in the three scenarios tested. Variables were selected from an overall model, after a model selection step. Response individual PA values were obtained either as the best one between RR and LASSO, with RR or with LASSO. Relative importance was estimated with pmvd method, from relaimpo R-package version 2.2–5. Coefficients of determination (R [2]) of selected models are indicated above each stacked bar.
Figure 6
Figure 6
PA for cross mean predicion after training set optimization and with the best method between RR and LASSO, for each cross. Best method is indicated with the triangle filling and TS optimization method with the color. For comparison, random selection of TS genotypes (in grey) was performed and repeated ten times, error bars correspond to 95% of the confidence interval around the mean. We also report per-cross PA with the whole diversity panel (in red), with a maximum TS size of 279 which may vary depending on traits.

References

    1. Meuwissen THE, Hayes BJ, Goddard ME. Prediction of Total genetic value using genome-wide dense marker maps. Genetics. 2001;11. - PMC - PubMed
    1. Heffner EL, Sorrells ME, Jannink J-L. Genomic selection for crop improvement. Crop Sci. 2009;157:1819–29.
    1. Werner CR, Gaynor RC, Gorjanc Get al. . How population structure impacts genomic selection accuracy in cross-validation: implications for practical breeding. Front Plant Sci. 2020;11:592977. - PMC - PubMed
    1. Falconer DS, Mackay TFC. Introduction to Quantitative Genetics. Pearson: Prentice Hall; 2009.
    1. Bernardo R. Genomewide selection of parental Inbreds: classes of loci and virtual Biparental populations. Crop Sci. 2014;54:2586–95.