. 2022 Feb 19:9:uhac028.
doi: 10.1093/hr/uhac028. Online ahead of print.

Genetic architecture and genomic predictive ability of apple quantitative traits across environments

Affiliations

Genetic architecture and genomic predictive ability of apple quantitative traits across environments

Michaela Jung et al. Hortic Res. .

Erratum in

Abstract

Implementation of genomic tools is desirable to increase the efficiency of apple breeding. Recently, the multi-environment apple reference population (apple REFPOP) proved useful for rediscovering loci, estimating genomic predictive ability, and studying genotype by environment interactions (G × E). So far, only two phenological traits were investigated using the apple REFPOP, although the population may be valuable when dissecting genetic architecture and reporting predictive abilities for additional key traits in apple breeding. Here we show contrasting genetic architecture and genomic predictive abilities for 30 quantitative traits across up to six European locations using the apple REFPOP. A total of 59 stable and 277 location-specific associations were found using GWAS, 69.2% of which are novel when compared with 41 reviewed publications. Average genomic predictive abilities of 0.18-0.88 were estimated using main-effect univariate, main-effect multivariate, multi-environment univariate, and multi-environment multivariate models. The G × E accounted for up to 24% of the phenotypic variability. This most comprehensive genomic study in apple in terms of trait-environment combinations provided knowledge of trait biology and prediction models that can be readily applied for marker-assisted or genomic selection, thus facilitating increased breeding efficiency.


Figures

Figure 1
Figure 1
Locations and the respective number of phenotyping seasons for each trait. Locations of the measurements are labeled as: BEL – Belgium, CHE – Switzerland, ESP – Spain, FRA – France, ITA – Italy, POL – Poland. Traits measured at a single location are labeled with an asterisk.
Figure 2
Figure 2
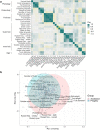
Exploratory phenotypic data analysis of the studied quantitative apple traits. a Pairwise correlations between traits with the phenotypic clonal values and genomic breeding values correlations in the lower and upper triangular part, respectively. Phenotypic clonal values correlation was assessed as Pearson correlation between pairs of global clonal values (across-location clonal values with the addition of location-specific clonal values for traits measured at a single location), the genomic breeding values correlation as Pearson correlation between pairs of genomic breeding values estimated from a G-BLUP model. Trait categories are outlined along the vertical axis. Traits measured at a single location are labeled with an asterisk. b Principal component analysis biplot based on global clonal values.
Figure 3
Figure 3
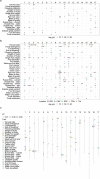
Significant marker-trait associations found by GWAS. a Distribution of the significant associations and corresponding p-values from across-location GWAS over the 17 apple chromosomes. b Distribution of the significant associations and corresponding p-values from location-specific GWAS over the 17 apple chromosomes. Locations are labeled as BEL (Belgium), CHE (Switzerland), ESP (Spain), FRA (France) and ITA (Italy). a-b Size of the symbols indicate the formula image. The x-axis shows chromosome numbers. c Physical positions (in bp) of the significant associations on chromosomes with their respective coefficients of determination (formula image) from the across-location GWAS complemented with the location-specific GWAS for traits measured at a single location. Size of the symbols indicate the formula image. The x-axis shows chromosome numbers.
Figure 4
Figure 4
Comparison of the significant marker-trait associations with previously published associations. a Venn diagram comparing the unique associations, which were either previously published (former), reported in the across-location GWAS (present) or the location-specific GWAS (present per location). Color intensity and the values reflect the number of associations per diagram area. b Scatterplot of unique associations comparing published associations (former) with the merged across-location and location-specific GWAS (present). The traits were assembled into trait groups based on similarity between the approaches to the trait measurement. Symbol size reflects the number of markers used in the studies. In case more than one publication reported an association in the same chromosome segment, only the report with the largest number of markers is shown (see Supplementary Table 4 for the complete list of previously published associations). a-b Positions of associations were assigned to three chromosome segments: top, center and bottom. Only the unique combinations of trait groups with segments and type of study (former or present) are shown.
Figure 5
Figure 5
Allele frequency dynamics of the major significant marker-trait associations. a-d The associations were chosen based on the coefficient of determination (formula image>0.1) from the global GWAS. a For each association, frequency of the allele with increasing effect on trait phenotypes in the apple REFPOP is shown. For the progeny group (progeny) and its five ancestor generations (ancestors), the allele frequencies are shown as points connected with a line. Out of all known ancestors, the allele frequency was estimated for 30 accessions included in the apple REFPOP. Colors of the points and lines correspond to chromosome locations of the associated SNPs. b Allelic combinations carried by the apple REFPOP genotypes, sorted according to geographic origin of accessions and affiliation of progeny to parental combinations (the x-axis was labeled according to Supplementary Table 1 and 2 in Jung et al. [36]). c Global clonal values of traits and their standard error for each allelic combination, centered to mean 0 and scaled to standard deviation of 1. d Frequency of the minor allele in the whole apple REFPOP. b-d The legend and y-axis are shared between plots. In d, the color of an allele corresponds to the color of the homozygous allelic combination of the same allele in b and c.
Figure 6
Figure 6
Genomic predictive ability in apple quantitative traits using eight genomic prediction models and two cross-validation scenarios. a Predictive ability of four main-effect univariate models, i.e. random forest (RF), BayesCπ, Bayesian reproducing kernel Hilbert spaces regression (RKHS) and genomic-BLUP (G-BLUP), and one main-effect multivariate model with an unstructured covariance matrix of the random effect (MTM.UN). The models were applied with a five-fold cross-validation where 20% of the genotypes were masked in each of the five runs. The MTM.UN was used in case a trait showed genomic breeding values correlation larger than 0.3 with at least one other trait. b Predictive ability of two multi-environment univariate models, i.e. across-environment G-BLUP (G-BLUP.E) and marker by environment interaction G-BLUP (G-BLUP.E.G × E), and the multi-environment multivariate factor-analytic model (MTM.FA). The models were applied under two five-fold cross-validation scenarios CV1 and CV2. The CV1 was applied for all traits using G-BLUP.E and G-BLUP.E.G × E and for traits measured in at least three environments using MTM.FA. The CV2 was applied for traits measured in Switzerland and in at least a one other location. a-b Predictive ability was estimated as a Pearson correlation coefficient between the observed and the predicted values of genotypes whose phenotypes were masked in a five-fold cross-validation. For the multi-environment models, the correlation coefficients were estimated for each environment separately. In the box plot, the bottom and top line of the boxes indicate the 25th percentile and 75th percentile quartiles (the interquartile range), the center line indicates the median (50th percentile). The whiskers extend from the bottom and top line up to 1.5-times the interquartile range. The points beyond the 1.5-times the interquartile range from the bottom and top line are labeled as dots.
Figure 7
Figure 7
Synthesis of phenotypic and genomic analyses. Across-environment clonal mean heritability, genomic heritability, average predictive ability (formula image) for the main-effect G-BLUP and the proportion of phenotypic variance explained by the effect of each significantly associated marker (SNP 1–8), genotype (G), environment (E) and genotype by environment interaction (G × E). The significantly associated markers corresponded to results of the global GWAS. SNPs associated with each trait were sorted according to the proportion of phenotypic variance they explained, i.e. SNP 1 represented the association explaining the most variance within a trait. Proportions of phenotypic variance components were used to estimate clusters of traits outlined along the vertical axis. Within each cluster, the traits were sorted according to formula image.

References

    1. FAOSTAT (Food and Agriculture Organization of the United Nations, 2019).
    1. Cornille A, Giraud T, Smulders MJMet al. . The domestication and evolutionary ecology of apples. Trends Genet. 2014;30:57–65. 10.1016/j.tig.2013.10.002. - DOI - PubMed
    1. Way RD, Aldwinckle HS, Lamb RCet al. . Apples (Malus). Acta Hortic. 1991;3–46. 10.17660/ActaHortic.1991.290.1. - DOI
    1. Muranty H, Denancé C, Feugey Let al. . Using whole-genome SNP data to reconstruct a large multi-generation pedigree in apple germplasm. BMC Plant Biol. 2020;20:2. 10.1186/s12870-019-2171-6. - DOI - PMC - PubMed
    1. Migicovsky Z, Gardner KM, Richards Cet al. . Genomic consequences of apple improvement. Hortic Res. 2021;8:9. 10.1038/s41438-020-00441-7. - DOI - PMC - PubMed