. 2022 Aug;32(8):5297-5307.
doi: 10.1007/s00330-022-08605-w. Epub 2022 Feb 19.

Abnormal dynamic ventilation function of COVID-19 survivors detected by pulmonary free-breathing proton MRI

Affiliations

Abnormal dynamic ventilation function of COVID-19 survivors detected by pulmonary free-breathing proton MRI

Cheng Wang et al. Eur Radiol. 2022 Aug.

Abstract

Objectives: To visualize and quantitatively assess regional lung function of survivors of COVID-19 who were hospitalized using pulmonary free-breathing 1H MRI.

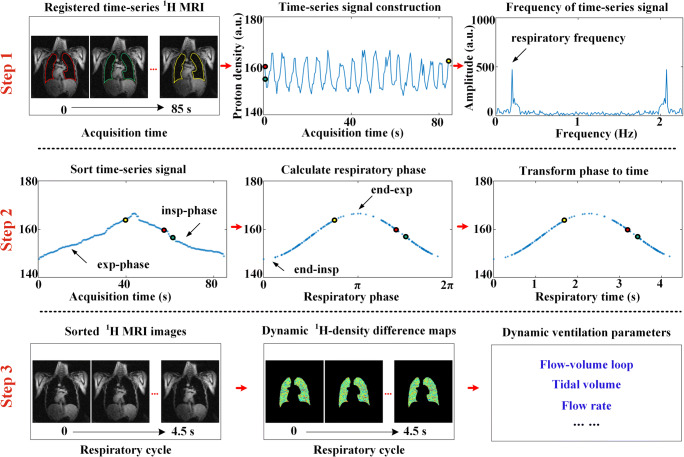
Methods: A total of 12 healthy volunteers and 27 COVID-19 survivors (62.4 ± 8.1 days between infection and image acquisition) were recruited in this prospective study and performed chest 1H MRI acquisitions with free tidal breathing. Then, conventional Fourier decomposition ventilation (FD-V) and global fractional ventilation (FVGlobal) were analyzed. Besides, a modified PREFUL (mPREFUL) method was developed to adapt to COVID-19 survivors and generate dynamic ventilation maps and parameters. All the ventilation maps and parameters were analyzed using Student's t-test. Pearson's correlation and a Bland-Altman plot between FVGlobal and mPREFUL were analyzed.

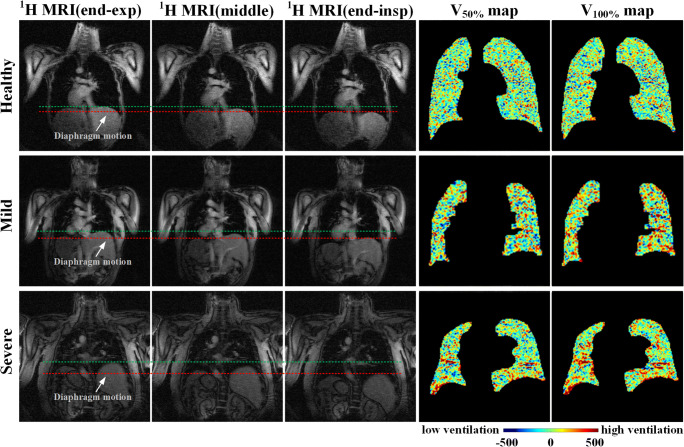
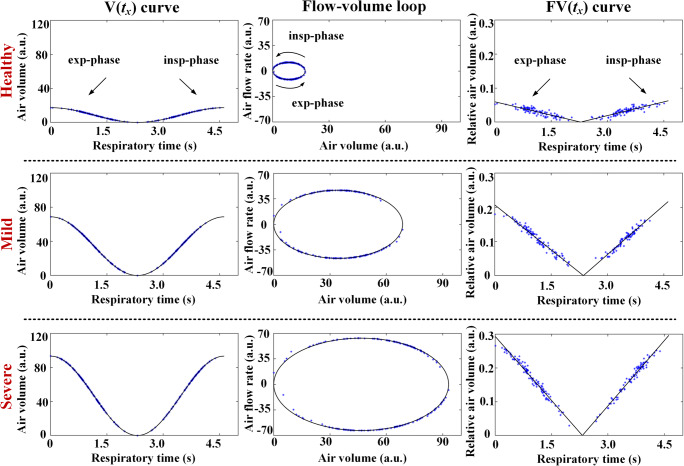
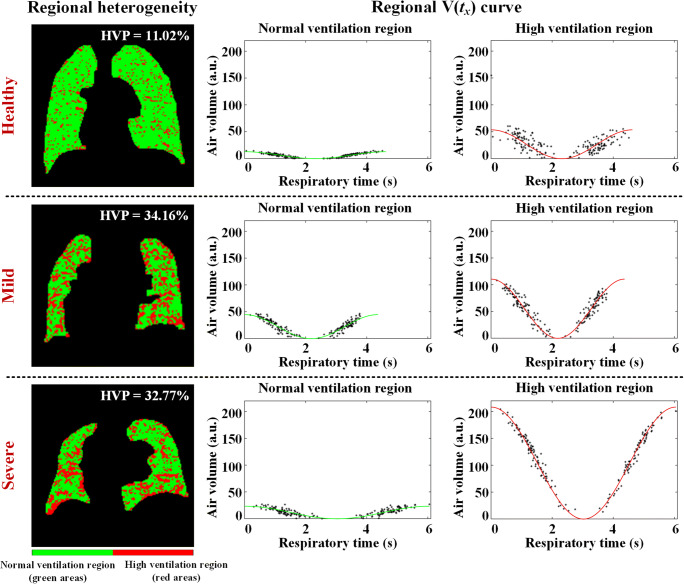
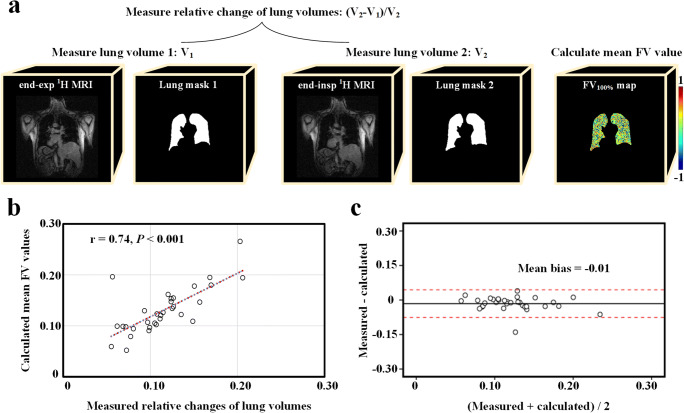
Results: There was no significant difference between COVID-19 and healthy groups regarding a static FD-V map (0.47 ± 0.12 vs 0.42 ± 0.08; p = .233). However, mPREFUL demonstrated lots of regional high ventilation areas (high ventilation percentage (HVP): 23.7% ± 10.6%) existed in survivors. This regional heterogeneity (i.e., HVP) in survivors was significantly higher than in healthy volunteers (p = .003). The survivors breathed deeper (flow-volume loop: 5375 ± 3978 vs 1688 ± 789; p = .005), and breathed more air in respiratory cycle (total amount: 62.6 ± 19.3 vs 37.3 ± 9.9; p < .001). Besides, mPREFUL showed both good Pearson's correlation (r = 0.74; p < .001) and Bland-Altman consistency (mean bias = -0.01) with FVGlobal.

Conclusions: Dynamic ventilation imaging using pulmonary free-breathing 1H MRI found regional abnormity of dynamic ventilation function in COVID-19 survivors.

Key points: • Pulmonary free-breathing1H MRI was used to visualize and quantitatively assess regional lung ventilation function of COVID-19 survivors. • Dynamic ventilation maps generated from 1H MRI were more sensitive to distinguish the COVID-19 and healthy groups (total air amount: 62.6 ± 19.3 vs 37.3 ± 9.9; p < .001), compared with static ventilation maps (FD-V value: 0.47 ± 0.12 vs 0.42 ± 0.08; p = .233). • COVID-19 survivors had larger regional heterogeneity (high ventilation percentage: 23.7% ± 10.6% vs 13.1% ± 7.9%; p = .003), and breathed deeper (flow-volume loop: 5375 ± 3978 vs 1688 ± 789; p = .005) than healthy volunteers.

Keywords: COVID-19 survivors; Dynamic ventilation imaging; Phase-resolved functional lung (PREFUL); Pulmonary free-breathing 1H MRI; Regional lung function.


Conflict of interest statement

The authors declare no competing interests.

Figures

Fig. 1
Fig. 1
The framework of mPREFUL by using free-breathing 1H MRI, which contained three steps. Step 1 served to construct time-series signal according to the mean values of lung proton density. Step 2 served to sort the time-series signal in exp-phase and insp-phase of the full respiratory cycle (FRC), and then calculate the respiratory phase and respiratory time of each image according to the cosine model. Step 3 served to calculate the dynamic 1H-density difference and relative difference maps between each time point image and the end-exp image in the FRC. Note that the proton density was expressed in arbitrary units (a.u.)
Fig. 2
Fig. 2
The dynamic 1H MRI images at the end-exp, middle, and end-insp time points, and corresponding dynamic ventilation maps (V(tx) maps) at the middle time point (V50% map) and end-insp time point (V100% map) of a healthy volunteer (male, 31 years old), a mild COVID-19 survivor (female, 47 years old), and a severe COVID-19 survivor (male, 53 years old). The distance between green line and red line in dynamic 1H MRI images indicated the range of diaphragm motion in the respiratory cycle. The hyperintense signal areas (red color areas) of the V50% map and V100% map indicated high ventilation areas
Fig. 3
Fig. 3
The V(tx) curves, flow-volume loops, and FV(tx) curves of a healthy volunteer (male, 31 years old), a mild COVID-19 survivor (female, 47 years old), and a severe COVID-19 survivor (male, 38 years old). In V(tx) curves, the blue points represented the mean values of V(tx) maps at each time point, which were then fitted into continuous curves (black solid curves). In flow-volume loops, the blue points represented the slopes of V(tx) curves at each time point. In FV(tx) curves, the blue points represented the mean values of FV(tx) maps at each time point
Fig. 4
Fig. 4
The regional heterogeneity analysis of dynamic ventilation maps (V100% map) of the representative subjects (the same subjects in Fig. 2), and the regional V(tx) curves of these subjects. The green areas in lungs represented the normal ventilation regions, and the aggregate of all red areas in the heterogeneity maps represented the high ventilation regions. The high ventilation percentage (HVP) of the lungs was labeled in these subjects
Fig. 5
Fig. 5
The group analysis of FD-V map, dynamic ventilation maps (V100% map, FV100% map), dynamic ventilation parameters (HVP, V(tx) curve, FV(tx) curve, and flow-volume loop), and FVGlobal for the healthy volunteers, mild COVID-19 survivors, and severe COVID-19 survivors. The symbol * meant p < 0.05, ** meant p < 0.01, and *** meant p < 0.001
Fig. 6
Fig. 6
The validation of dynamic ventilation maps. a The measurement of relative change between end-exp lung volume and end-insp lung volume. b The Pearson correlation between the measured relative changes of lung volumes and the calculated mean FV values of FV100% maps for all subjects. c The Bland-Altman plot of the measured relative changes of lung volumes and the calculated mean FV values of FV100% maps for all subjects

References

    1. Zhu N, Zhang D, Wang W, et al. A novel coronavirus from patients with pneumonia in China, 2019. New Engl J Med. 2020;382(8):727–733. doi: 10.1056/NEJMoa2001017. - DOI - PMC - PubMed
    1. World Health Organization (2021) Coronavirus disease (COVID-2019) situation reports. Available via https://www.who.int/publications/m/item/weekly-operational-update-on-cov.... Accessed 2 Dec 2021
    1. Mo X, Jian W, Su Z, et al. Abnormal pulmonary function in COVID-19 patients at time of hospital discharge. Eur Respir J. 2020;55:2001217. doi: 10.1183/13993003.01217-2020. - DOI - PMC - PubMed
    1. Hui DS, Joynt GM, Wong KT, et al. Impact of severe acute respiratory syndrome (SARS) on pulmonary function, functional capacity and quality of life in a cohort of survivors. Thorax. 2005;60:401–409. doi: 10.1136/thx.2004.030205. - DOI - PMC - PubMed
    1. You J, Zhang L, Ni-Jia-Ti MY, et al. Anormal pulmonary function and residual CT abnormalities in rehabilitating COVID-19 patients after discharge. J Infection. 2020;81(2):e150–e152. doi: 10.1016/j.jinf.2020.06.003. - DOI - PMC - PubMed