. 2022 Apr;16(8):1714-1727.
doi: 10.1002/1878-0261.13194. Epub 2022 Feb 28.

CHML is an NRF2 target gene that regulates mTOR function

Affiliations

CHML is an NRF2 target gene that regulates mTOR function

Matthew Dodson et al. Mol Oncol. 2022 Apr.

Abstract

The transcription factor nuclear factor erythroid 2-related factor 2 (NRF2) is often highly expressed in non-small cell lung cancer (NSCLC). Through its target genes, NRF2 enhances cancer progression and chemo/radioresistance, leading to a poorer prognosis in patients with high NRF2 expression. In this study, we identified CHM-like Rab escort protein (CHML; encoding Rep2) as an NRF2 target gene with an antioxidant response element (ARE) in its promoter region (-1622 to -1612). Analysis of patient data curated by The Cancer Genome Atlas (TCGA) and Oncomine databases revealed that CHML mRNA expression was elevated in lung adenocarcinoma (LUAD) patient tumor tissues and correlated with decreased patient survival. Immunohistochemistry (IHC) analysis of normal versus lung cancer patient tissues revealed that Rep2 protein levels were higher in lung tumors compared with normal tissue, which also correlated with increased levels of NRF2. Importantly, siRNA-mediated knockdown of CHML/Rep2 in A549 NSCLC cells decreased their ability to proliferate. Mechanistically, Rep2 mediates mTOR function, as loss of Rep2 inhibited, whereas overexpression enhanced, mTOR translocation and activation at the lysosome. Our findings identify a novel NRF2-Rep2-dependent regulation of mTOR function.

Keywords: CHML/REP2; NRF2; NSCLC; mTOR.


Conflict of interest statement

The authors have no conflicts of interest to declare.

Figures

Fig. 1
Fig. 1
CHML/Rep2 is an NRF2 target gene. (A) Sequence and upstream location of putative CHML antioxidant response element (ARE; −1622ATGACTCAGCA‐1612). Biotinylated wild type (WT; ATGACTCAGCA) or mutant (MT; AACTCTCACGA) ARE‐containing oligonucleotides were incubated with A549 WT or NRF2 knockout (KO) cell lysate and ARE‐bound proteins were pulled down using streptavidin beads. NRF2 protein levels were assessed via immunoblot analysis. GAPDH was used as an internal loading control. (B) ChIP‐PCR of NRF2‐bound DNA immunoprecipitated from A549 WT cells using an anti‐NRF2 antibody. A region of the CHML promoter containing the putative ARE was amplified and compared to an IgG control. (C) A549 WT and NRF2 KO or H1299 WT and KEAP1 KO cells were co‐transfected with 1 µg of a plasmid encoding a Firefly luciferase under the control of either a WT or MT‐CHML ARE‐driven promoter, as well as 1 µg of a Renilla luciferase plasmid under the control of a universal promoter as an internal control and subjected to a dual luciferase activity assay. Data = mean ± SD. n = 3 per group. *P < 0.05 compared to WT control. Unpaired student’s t‐test. (D‐H) Immunoblot analysis of NRF2, Rep2, and NQO1 protein levels in BEAS‐2B or H1299 WT cells treated with 5 µm sulforaphane (SF) for 16 h (D‐E), H1299 WT vs. KEAP1 KO cells (F), A549 WT cells treated for 16 h with 40 nm Brusatol (G), or A549 WT vs. NRF2 KO cells (H). (I) CHML mRNA levels in A549 WT vs. NRF2 KO cells. Data = mean ± SD. n = 3 per group. *P < 0.05 compared to A549 WT control. Unpaired student’s t‐test. (J‐L) Immunoblot analysis of NRF2, Rep2, and NQO1 protein levels in MDA‐231 and A375 cells treated with SF for 16 h (J‐K) or A375 cells transfected with 1 µg of an NRF2 plasmid for 24 h (L). All groups for immunoblot analysis were performed in triplicate, and experiments were repeated two times to ensure validity of results.
Fig. 2
Fig. 2
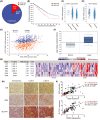
Increased expression of CHML/Rep2 correlates with decreased survival and increased expression of NFE2L2 and its target genes in lung adenocarcinoma patients. TCGA analysis of (A) % of lung adenoma carcinoma cases (LUAD) exhibiting high CHML mRNA levels, (B) Patient survival based on CHML mRNA expression levels, and (C‐D) KEAP1 copy number and mutation status compared to CHML mRNA levels from a lung adenocarcinoma patient cohort (n = 503). (E) Comparison of mRNA expression levels of SLC7A11 and TXNRD1 versus CHML from the same TCGA pan‐cancer atlas cohort. (F‐G) Curated Oncomine data indicating CHML mRNA levels in lung adenocarcinoma (n = 91) vs normal (n = 65) tissue compared to other well‐established NRF2 target genes. Red = higher expression, blue = lower expression. Genes are ranked based on significance of fold change compared to other genes. (H‐I) Immunohistochemistry analysis and correlation plot of NRF2/SLC7A11 levels and Rep2 expression in normal vs. lung adenocarcinoma (LUAD) patient tissues. Red dots = normal tissue (n = 14); Black dots = LUAD patient tissue (n = 140). P < 0.0001. One‐way ANOVA. Scale bar = 100 μm.
Fig. 3
Fig. 3
CHML/Rep2 knockdown decreases A549 proliferation and migration. (A) Immunoblot analysis of Rep2 protein levels in A549 WT cells following treatment with 5 nm of either NT or CHML siRNA for 72 h. (B) Representative images and (C) quantification of percent confluence (indicator of cell proliferation) following knockdown. Scale bar = 100 μm. (D) MTT assay for cell viability of A549 cells transfected with 5 nm of either NT or CHML siRNA for 24 h. (E) Representative images of a scratch assay (indicator of cell migration) following Rep2 knockdown and Bru treatment. Scale bar = 200 μm. (F) Quantification of % wound closure over the 24 h brusatol treatment period from (E). Data = mean ± SD. n = 5 per group. *P < 0.05 compared to control siRNA group. Unpaired student’s t‐test. All experiments were repeated two times to ensure validity of results.
Fig. 4
Fig. 4
Knockdown of CHML/Rep2 decreases protein levels without affecting autophagy. (A) Immunoblot analysis of Rep2, p62, and LC3‐I/II protein levels in A549 cells treated with 5 nm of either NT or CHML/Rep2 siRNA for 72 h. (B) RFP‐GFP‐LC3 tandem fluorescence analysis of autophagy flux following siRNA knockdown same as (A). Yellow puncta = autophagosomes, red puncta = autolysosomes. Scale bar = 10 μm. (C) Immunoblot analysis of Rep2, p62, and LC3‐I/II protein levels in A549 cells transfected with 1 µg of either an empty vector (EV) or WT‐CHML (Rep2 OE) for 24 h. (D) RFP‐GFP‐LC3 tandem fluorescent analysis of autophagy flux following Rep2 overexpression same as (C). Scale bar = 10 μm. (E) Immunoblot analysis of Rep2, LAMP1, Atg7, p62, Snap29, Rab7, and LC3‐I/II protein levels following Rep2 knockdown for 72 h. All groups for immunoblot and immunofluorescence analysis were performed in triplicate, and experiments were repeated two times to ensure validity of results.
Fig. 5
Fig. 5
Knockdown of CHML/Rep2 decreases, whereas overexpression increases, mTOR activation. (A) Immunoblot analysis of phosphorylated mTOR (S2448), mTOR, phosphorylated S6K (S371), S6K, phosphorylated S6 (S235/236), and S6 protein levels in A549 cells treated with 5 nm NT or CHML/Rep2 siRNA for 72 h., then amino acid starved for 30 min., and left untreated or treated for 15 min. with 1 mm l‐arginine (R) to activate the mTOR pathway. (B) Endogenous immunofluorescence of mTOR (red) colocalization with LAMP1‐positive lysosomes (green) following knockdown and l‐arginine treatment same as (A). Scale bar = 10 μm. (C) Immunoblot analysis of the same proteins assessed in (A) in A549 WT cells transfected with 1 µg of either empty vector or WT‐CHML for 24 h, then amino acid starved for 30 min., and left untreated or treated for 15 min. with 1 mm l‐arginine (R). (D) Endogenous immunofluorescence of mTOR (red) colocalization with LAMP1‐positive lysosomes (green) following Rep2 overexpression and l‐arginine treatment same as (C). Scale bar = 10 μm. All groups for immunoblot and immunofluorescence analysis were performed in triplicate, and experiments were repeated two times to ensure validity of results. (E) RT‐PCR of mTOR, S6KB, S6, and CHML mRNA levels following Rep2 knockdown (72 h) or overexpression (24 h). Data = mean ± SD. n = 3 per group. *P < 0.05 compared to NT siRNA or EV group. Unpaired student’s t‐test. (F) SILAC determination of protein synthesis following knockdown with CHML/Rep2 siRNA and treatment with heavy arginine or heavy lysine for 24 h. Data = mean ± SD. n = 6 per group. *P < 0.05 compared to NT siRNA group. (G) Immunoblot analysis of mTOR pathway proteins in A549 WT vs. NRF2 KO cells treated with Rep2 siRNA or transfected with a WT‐CHML plasmid as described above. All groups for immunoblot analysis were performed in triplicate, and experiments were repeated two times to ensure validity of results.
Fig. 6
Fig. 6
Summary Figure. Rep2 is a transcriptional target of NRF2 that mediates translocation of mTOR to the lysosomal membrane, where it is activated and initiates a downstream phosphorylation cascade that initiates protein translation. Loss of Rep2 decreases mTOR‐dependent protein synthesis leading to decreased proliferation in non‐small cell lung cancer (NSCLC) cells.

References

    1. Bradner JE, Hnisz D, Young RA. Transcriptional Addiction in Cancer. Cell. 2017;168:629–43. 10.1016/j.cell.2016.12.013. - DOI - PMC - PubMed
    1. Bushweller JH. Targeting transcription factors in cancer ‐ from undruggable to reality. Nat Rev Cancer. 2019;19:611–24. 10.1038/s41568-019-0196-7. - DOI - PMC - PubMed
    1. Rojo de la Vega M, Chapman E, Zhang DD. NRF2 and the Hallmarks of Cancer. Cancer Cell. 2018;34:21–43. 10.1016/j.ccell.2018.03.022. - DOI - PMC - PubMed
    1. Dodson M, de la Vega MR, Cholanians AB, Schmidlin CJ, Chapman E, Zhang DD. Modulating NRF2 in Disease: Timing Is Everything. Annu Rev Pharmacol Toxicol. 2019;59:555–75. 10.1146/annurev-pharmtox-010818-021856. - DOI - PMC - PubMed
    1. Kan Z, Jaiswal BS, Stinson J, Janakiraman V, Bhatt D, Stern HM, et al. Diverse somatic mutation patterns and pathway alterations in human cancers. Nature. 2010;466:869–73. 10.1038/nature09208. - DOI - PubMed

Publication types

MeSH terms

Substances