

Revealing the transcriptional heterogeneity of organ-specific metastasis in human gastric cancer using single-cell RNA Sequencing
- PMID: 35184420
- PMCID: PMC8858624
- DOI: 10.1002/ctm2.730
Revealing the transcriptional heterogeneity of organ-specific metastasis in human gastric cancer using single-cell RNA Sequencing
Abstract
Background: Deciphering intra- and inter-tumoural heterogeneity is essential for understanding the biology of gastric cancer (GC) and its metastasis and identifying effective therapeutic targets. However, the characteristics of different organ-tropism metastases of GC are largely unknown.
Methods: Ten fresh human tissue samples from six patients, including primary tumour and adjacent non-tumoural samples and six metastases from different organs or tissues (liver, peritoneum, ovary, lymph node) were evaluated using single-cell RNA sequencing. Validation experiments were performed using histological assays and bulk transcriptomic datasets.
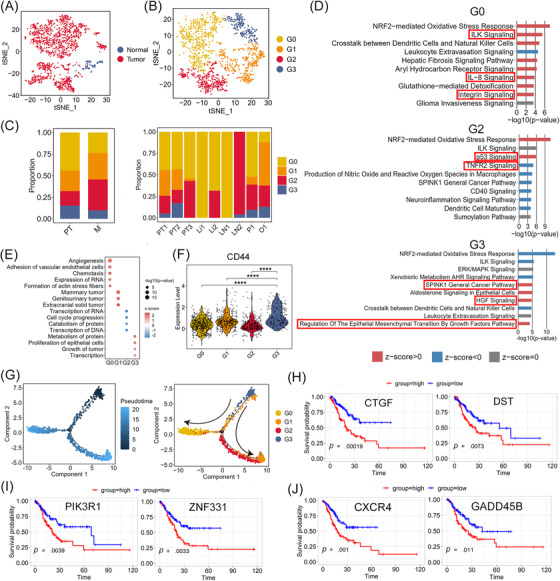
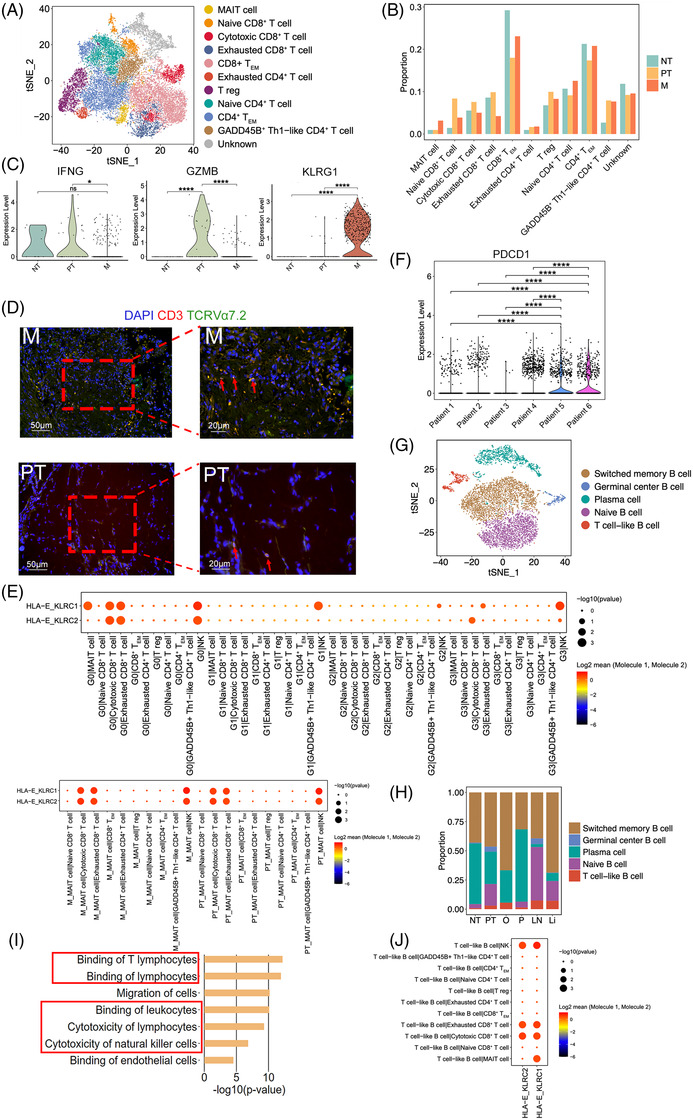
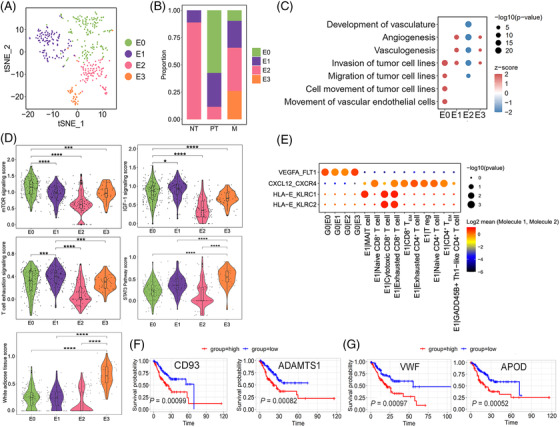
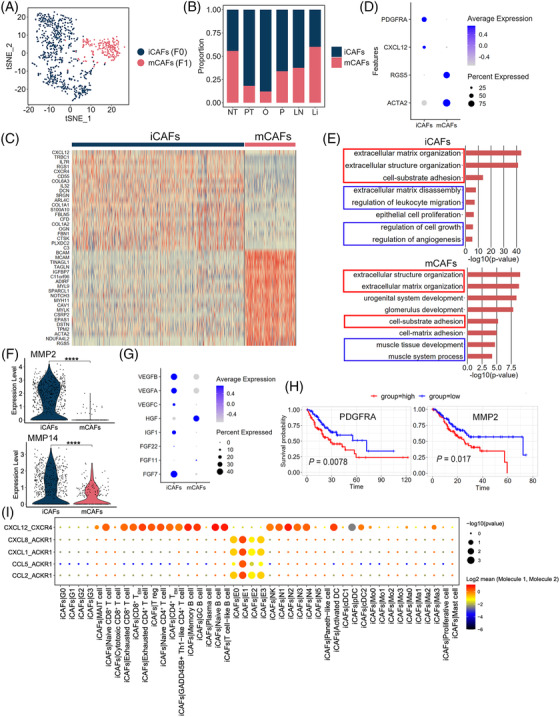
Results: Malignant epithelial subclusters associated with invasion features, intraperitoneal metastasis propensity, epithelial-mesenchymal transition-induced tumour stem cell phenotypes, or dormancy-like characteristics were discovered. High expression of the first three subcluster-associated genes displayed worse overall survival than those with low expression in a GC cohort containing 407 samples. Immune and stromal cells exhibited cellular heterogeneity and created a pro-tumoural and immunosuppressive microenvironment. Furthermore, a 20-gene signature of lymph node-derived exhausted CD8+ T cells was acquired to forecast lymph node metastasis and validated in GC cohorts. Additionally, although anti-NKG2A (KLRC1) antibody have not been used to treat GC patients even in clinical trials, we uncovered not only malignant tumour cells but one endothelial subcluster, mucosal-associated invariant T cells, T cell-like B cells, plasmacytoid dendritic cells, macrophages, monocytes, and neutrophils may contribute to HLA-E-KLRC1/KLRC2 interaction with cytotoxic/exhausted CD8+ T cells and/or natural killer (NK) cells, suggesting novel clinical therapeutic opportunities in GC. Additionally, our findings suggested that PD-1 expression in CD8+ T cells might predict clinical responses to PD-1 blockade therapy in GC.
Conclusions: This study provided insights into heterogeneous microenvironment of GC primary tumours and organ-specific metastases and provide support for precise diagnosis and treatment.
Keywords: HLA-E-KLRC1/KLRC2; gastric cancer; metastasis; single-cell RNA sequencing; tumoural heterogeneity.
© 2022 The Authors. Clinical and Translational Medicine published by John Wiley & Sons Australia, Ltd on behalf of Shanghai Institute of Clinical Bioinformatics.
Conflict of interest statement
The authors have declared that no conflict of interest exists.
Figures


Similar articles
-
Deciphering of intra-tumoural heterogeneity and the interplay between metastasis-associated meta-program and myofibroblasts in gastric cancer.Clin Transl Med. 2025 May;15(5):e70319. doi: 10.1002/ctm2.70319. Clin Transl Med. 2025. PMID: 40292733 Free PMC article.
-
Single-cell RNA sequencing to map tumor heterogeneity in gastric carcinogenesis paving roads to individualized therapy.Cancer Immunol Immunother. 2024 Sep 13;73(11):233. doi: 10.1007/s00262-024-03820-4. Cancer Immunol Immunother. 2024. PMID: 39271545 Free PMC article. Review.
-
Single-cell RNA-seq dissecting heterogeneity of tumor cells and comprehensive dynamics in tumor microenvironment during lymph nodes metastasis in gastric cancer.Int J Cancer. 2022 Oct 15;151(8):1367-1381. doi: 10.1002/ijc.34172. Epub 2022 Jul 4. Int J Cancer. 2022. PMID: 35716132
-
Single-cell analysis uncovers high-proliferative tumour cell subtypes and their interactions in the microenvironment of gastric cancer.J Cell Mol Med. 2024 Jun;28(12):e18373. doi: 10.1111/jcmm.18373. J Cell Mol Med. 2024. PMID: 38894657 Free PMC article.
-
Exploring the current landscape of single-cell RNA sequencing applications in gastric cancer research.J Cell Mol Med. 2024 Apr;28(7):e18159. doi: 10.1111/jcmm.18159. J Cell Mol Med. 2024. PMID: 38494861 Free PMC article. Review.
Cited by
-
Single cell sequencing revealed the mechanism of CRYAB in glioma and its diagnostic and prognostic value.Front Immunol. 2024 Jan 11;14:1336187. doi: 10.3389/fimmu.2023.1336187. eCollection 2023. Front Immunol. 2024. PMID: 38274814 Free PMC article.
-
Pan-cancer analysis identifies migrasome-related genes as a potential immunotherapeutic target: A bulk omics research and single cell sequencing validation.Front Immunol. 2022 Nov 3;13:994828. doi: 10.3389/fimmu.2022.994828. eCollection 2022. Front Immunol. 2022. PMID: 36405728 Free PMC article.
-
Alteration in Serum Levels of Tumor Necrosis Factor Alpha is associated with Histopathologic Progression of Gastric Cancer.Iran Biomed J. 2023 Jan 1;27(1):72-8. doi: 10.52547/ibj.3847. Iran Biomed J. 2023. PMID: 36624700 Free PMC article.
-
Unraveling the ecological landscape of mast cells in esophageal cancer through single-cell RNA sequencing.Front Immunol. 2024 Oct 4;15:1470449. doi: 10.3389/fimmu.2024.1470449. eCollection 2024. Front Immunol. 2024. PMID: 39430754 Free PMC article.
-
Machine Learning Integration with Single-Cell Transcriptome Sequencing Datasets Reveals the Impact of Tumor-Associated Neutrophils on the Immune Microenvironment and Immunotherapy Outcomes in Gastric Cancer.Int J Mol Sci. 2024 Nov 26;25(23):12715. doi: 10.3390/ijms252312715. Int J Mol Sci. 2024. PMID: 39684426 Free PMC article.
References
-
- Arnold M, Ferlay J, van Berge Henegouwen MI, Soerjomataram I. Global burden of oesophageal and gastric cancer by histology and subsite in 2018. Gut. 2020;69:1564–1571. - PubMed
-
- Feng W, Ding Y, Zong W, Ju S. Non‐coding RNAs in regulating gastric cancer metastasis. Clin Chim Acta. 2019;496:125–133. - PubMed
Publication types
MeSH terms
Grants and funding
LinkOut - more resources
Full Text Sources
Medical
Molecular Biology Databases
Research Materials
Miscellaneous